Senior Manager Jobs in London

Senior Manager
England > London

The median Senior Manager salary in London is £72,500 per year according to job vacancies posted during the 6 months to 25 April 2024.

The first table below provides salary benchmarking and summary statistics including a comparison to same period in the previous 2 years.

6 months to
25 Apr 2024
Same period 2023 Same period 2022
Rank 129 191 245
Rank change year-on-year +62 +54 +39
Permanent jobs requiring a Senior Manager 585 693 1,118
As % of all permanent jobs advertised in London 2.48% 1.92% 1.71%
As % of the Job Titles category 2.64% 2.02% 1.78%
Number of salaries quoted 293 375 566
10th Percentile £45,850 £61,250 £53,729
25th Percentile £55,000 £70,000 £63,750
Median annual salary (50th Percentile) £72,500 £85,000 £80,000
Median % change year-on-year -14.71% +6.25% +6.67%
75th Percentile £100,000 £97,500 £97,500
90th Percentile £117,000 £116,500 £122,500
England median annual salary £62,500 £77,000 £71,005
% change year-on-year -18.83% +8.44% +5.19%

All Permanent IT Job Vacancies
London

The following table is for comparison with the above and includes summary statistics for all permanent IT job vacancies advertised in London. Most job vacancies include a discernible job title that can be normalized. As such, the figures in the second row provide an indication of the number of permanent jobs in our overall sample.

Permanent vacancies in London with a recognized job title 22,169 34,255 62,848
% of permanent jobs with a recognized job title 94.11% 95.07% 96.34%
Number of salaries quoted 16,697 25,036 34,819
10th Percentile £38,500 £42,500 £41,250
25th Percentile £51,250 £55,000 £52,500
Median annual salary (50th Percentile) £70,000 £72,500 £70,000
Median % change year-on-year -3.45% +3.57% -
75th Percentile £93,750 £95,000 £91,250
90th Percentile £115,000 £115,000 £110,000
England median annual salary £54,000 £60,567 £60,000
% change year-on-year -10.84% +0.95% +9.09%

Senior Manager
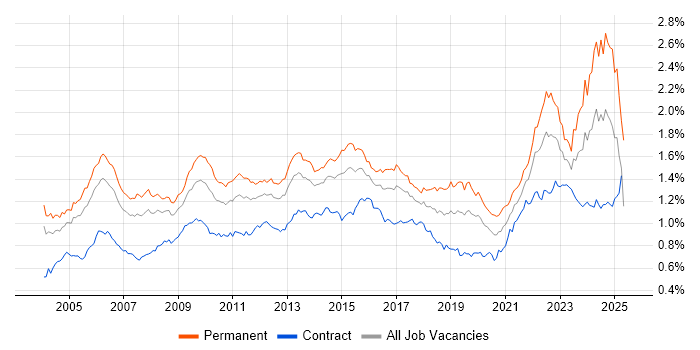
Job Vacancy Trend in London

Job postings that featured Senior Manager in the job title as a proportion of all IT jobs advertised in London.

Job vacancy trend for Senior Manager in London

Senior Manager
Salary Trend in London

3-month moving average salary quoted in jobs citing Senior Manager in London.

Salary trend for Senior Manager in London

Senior Manager
Salary Histogram in London

Salary distribution for jobs citing Senior Manager in London over the 6 months to 25 April 2024.

Salary histogram for Senior Manager in London

Senior Manager
Job Locations in London

The table below looks at the demand and provides a guide to the median salaries quoted in IT jobs citing Senior Manager within the London region over the 6 months to 25 April 2024. The 'Rank Change' column provides an indication of the change in demand within each location based on the same 6 month period last year.

Location Rank Change
on Same Period
Last Year
Matching
Permanent
IT Job Ads
Median Salary
Past 6 Months
Median Salary
% Change
on Same Period
Last Year
Live
Jobs
Central London +85 71 £64,080 -22.33% 36
West London +25 33 £54,225 -22.54% 16
South London +28 29 £92,000 +12.20%
North London +7 7 £70,000 - 1
East London +18 5 - - 9
Senior Manager
England

Senior Manager Skill Set
Top 30 Co-occurring Skills and Capabilities in London

For the 6 months to 25 April 2024, Senior Manager job roles required the following skills and capabilities in order of popularity. The figures indicate the absolute number co-occurrences and as a proportion of all permanent job ads across the London region featuring Senior Manager in the job title.

1 249 (42.56%) Finance
2 226 (38.63%) Social Skills
3 169 (28.89%) Inclusion and Diversity
4 153 (26.15%) Project Management
5 143 (24.44%) Agile
6 140 (23.93%) Microsoft
6 140 (23.93%) Mentoring
7 114 (19.49%) Law
8 106 (18.12%) Degree
9 99 (16.92%) SaaS
10 97 (16.58%) Service Delivery
11 87 (14.87%) Performance Management
12 83 (14.19%) ServiceNow
12 83 (14.19%) Contract Negotiation
13 79 (13.50%) Dell
13 79 (13.50%) SLA
14 76 (12.99%) Analytics
15 71 (12.14%) Marketing
15 71 (12.14%) Coaching
16 70 (11.97%) Roadmaps
17 68 (11.62%) Project Delivery
18 67 (11.45%) Stakeholder Management
19 65 (11.11%) Risk Management
20 57 (9.74%) Problem-Solving
21 54 (9.23%) Azure
22 45 (7.69%) PRINCE2
23 44 (7.52%) Continuous Improvement
23 44 (7.52%) Analytical Skills
24 43 (7.35%) Legal
25 41 (7.01%) Line Management

Senior Manager Skill Set
Co-occurring Skills and Capabilities in London by Category

The follow tables expand on the table above by listing co-occurrences grouped by category. The same employment type, locality and period is covered with up to 20 co-occurrences shown in each of the following categories:

Application Platforms
1 24 (4.10%) Microsoft Exchange
2 16 (2.74%) SharePoint
3 8 (1.37%) CMS
4 5 (0.85%) Umbraco
5 4 (0.68%) Apache
5 4 (0.68%) Apache Spark
6 3 (0.51%) Sitecore CMS
7 2 (0.34%) Drupal
7 2 (0.34%) Ethereum
7 2 (0.34%) Exchange Server 2010
7 2 (0.34%) Joomla!
7 2 (0.34%) WordPress
8 1 (0.17%) Confluence
8 1 (0.17%) GlassFish
8 1 (0.17%) JCAPS
8 1 (0.17%) SAS
8 1 (0.17%) WebLogic
8 1 (0.17%) WebSphere
8 1 (0.17%) WebSphere Application Server
Applications
1 10 (1.71%) Microsoft Office
2 9 (1.54%) Microsoft Excel
2 9 (1.54%) Microsoft Project
3 7 (1.20%) Microsoft PowerPoint
4 3 (0.51%) MS Visio
Business Applications
1 29 (4.96%) Endur
2 8 (1.37%) Dynamics CRM
3 5 (0.85%) SAP S/4HANA
4 4 (0.68%) Shopify
5 3 (0.51%) Primavera
6 2 (0.34%) NetSuite
7 1 (0.17%) Adaptiv
7 1 (0.17%) Aladdin
7 1 (0.17%) SAP HCM
7 1 (0.17%) SAP IBP
7 1 (0.17%) SAP MDG
7 1 (0.17%) Workday HCM
Cloud Services
1 99 (16.92%) SaaS
2 54 (9.23%) Azure
3 29 (4.96%) Microsoft 365
4 26 (4.44%) AWS
5 25 (4.27%) Power Platform
6 18 (3.08%) GCP
7 12 (2.05%) Dynamics 365
8 11 (1.88%) PaaS
9 10 (1.71%) Entra ID
10 6 (1.03%) Azure Pipelines
11 5 (0.85%) IaaS
12 4 (0.68%) Amazon S3
12 4 (0.68%) Amazon SQS
12 4 (0.68%) AWS Lambda
12 4 (0.68%) AWS Step Functions
12 4 (0.68%) Serverless
13 3 (0.51%) Google Analytics
13 3 (0.51%) Microsoft Purview
13 3 (0.51%) PowerApps
14 2 (0.34%) Cloud Computing
Communications & Networking
1 12 (2.05%) WAN
2 8 (1.37%) 5G
2 8 (1.37%) LAN
3 7 (1.20%) SAN
3 7 (1.20%) SD-WAN
3 7 (1.20%) Wi-Fi
4 6 (1.03%) DNS
4 6 (1.03%) Network Security
5 4 (0.68%) DHCP
5 4 (0.68%) Firewall
6 3 (0.51%) Broadband
6 3 (0.51%) VLAN
7 2 (0.34%) MPLS
7 2 (0.34%) Remote Desktop
7 2 (0.34%) Structured Cabling
7 2 (0.34%) VPN
7 2 (0.34%) WLAN
8 1 (0.17%) 4G
8 1 (0.17%) Extranet
8 1 (0.17%) FTP
Database & Business Intelligence
1 33 (5.64%) SQL Server
2 20 (3.42%) Power BI
3 18 (3.08%) Relational Database
4 17 (2.91%) RDBMS
5 10 (1.71%) Data Warehouse
6 9 (1.54%) SQL Server Analysis Services
6 9 (1.54%) SQL Server Integration Services
6 9 (1.54%) SQL Server Reporting Services
7 7 (1.20%) SAP HANA
8 5 (0.85%) Big Data
8 5 (0.85%) Data Lake
8 5 (0.85%) NoSQL
9 4 (0.68%) Elasticsearch
10 3 (0.51%) Snowflake Schema
10 3 (0.51%) Star Schema
10 3 (0.51%) Tableau
11 2 (0.34%) Looker
11 2 (0.34%) Power Query
11 2 (0.34%) QlikView
12 1 (0.17%) Hadoop
Development Applications
1 5 (0.85%) Git
1 5 (0.85%) JIRA
2 3 (0.51%) Eclipse
3 2 (0.34%) JUnit
4 1 (0.17%) Ant
4 1 (0.17%) Burp Suite
4 1 (0.17%) Gatling
4 1 (0.17%) LoadRunner
4 1 (0.17%) Maven
4 1 (0.17%) SonarQube
4 1 (0.17%) Sonatype Nexus
4 1 (0.17%) Subversion
General
1 249 (42.56%) Finance
2 226 (38.63%) Social Skills
3 169 (28.89%) Inclusion and Diversity
4 114 (19.49%) Law
5 71 (12.14%) Marketing
6 44 (7.52%) Analytical Skills
7 43 (7.35%) Legal
8 34 (5.81%) Retail
9 32 (5.47%) Banking
10 24 (4.10%) Games
11 21 (3.59%) Pharmaceutical
12 19 (3.25%) Presentation Skills
13 17 (2.91%) Manufacturing
14 16 (2.74%) Influencing Skills
15 15 (2.56%) Telecoms
16 14 (2.39%) Local Government
16 14 (2.39%) Public Sector
17 9 (1.54%) Automotive
18 8 (1.37%) Front Office
19 6 (1.03%) Back Office
Libraries, Frameworks & Software Standards
1 9 (1.54%) .NET
2 6 (1.03%) React
3 5 (0.85%) Middleware
4 4 (0.68%) .NET Core
4 4 (0.68%) .NET Framework
4 4 (0.68%) Apache Beam
4 4 (0.68%) Kafka
4 4 (0.68%) PySpark
4 4 (0.68%) PyTorch
4 4 (0.68%) TensorFlow
4 4 (0.68%) Unity DI Container
5 3 (0.51%) MDX
6 2 (0.34%) EDI
6 2 (0.34%) HTML
6 2 (0.34%) web3js
6 2 (0.34%) XML
7 1 (0.17%) ATL
7 1 (0.17%) J2EE
7 1 (0.17%) JDBC
7 1 (0.17%) JMS
Miscellaneous
1 25 (4.27%) Product Ownership
1 25 (4.27%) Self-Motivation
2 17 (2.91%) Swaptions
3 16 (2.74%) Onboarding
4 14 (2.39%) Data Structures
5 13 (2.22%) Blog
6 12 (2.05%) Management Information System
7 11 (1.88%) PMI
7 11 (1.88%) Virtual Team
8 9 (1.54%) Algorithms
8 9 (1.54%) Data Centre
8 9 (1.54%) Social Media
9 8 (1.37%) Life Science
9 8 (1.37%) NHS
10 7 (1.20%) Driving Licence
10 7 (1.20%) Security Posture
11 6 (1.03%) Private Cloud
12 5 (0.85%) Cyber Threat
12 5 (0.85%) Hedge funds
13 4 (0.68%) PKI
Operating Systems
1 12 (2.05%) Windows
2 5 (0.85%) Windows Server
3 3 (0.51%) Windows Server 2012
4 1 (0.17%) Apple iOS
4 1 (0.17%) Linux
4 1 (0.17%) Mac OS
Processes & Methodologies
1 153 (26.15%) Project Management
2 143 (24.44%) Agile
3 140 (23.93%) Mentoring
4 97 (16.58%) Service Delivery
5 87 (14.87%) Performance Management
6 83 (14.19%) Contract Negotiation
7 76 (12.99%) Analytics
8 71 (12.14%) Coaching
9 70 (11.97%) Roadmaps
10 68 (11.62%) Project Delivery
11 67 (11.45%) Stakeholder Management
12 65 (11.11%) Risk Management
13 57 (9.74%) Problem-Solving
14 45 (7.69%) PRINCE2
15 44 (7.52%) Continuous Improvement
16 41 (7.01%) Line Management
17 40 (6.84%) Budget Management
18 39 (6.67%) Scrum
19 35 (5.98%) Business Transformation
20 34 (5.81%) Cybersecurity
Programming Languages
1 31 (5.30%) SQL
2 27 (4.62%) Java
3 18 (3.08%) Python
4 17 (2.91%) VB
5 7 (1.20%) JavaScript
6 5 (0.85%) C#
6 5 (0.85%) Data Analysis Expressions
6 5 (0.85%) TypeScript
7 3 (0.51%) T-SQL
8 2 (0.34%) R
8 2 (0.34%) Scala
9 1 (0.17%) Bash
9 1 (0.17%) Bicep
9 1 (0.17%) Go
9 1 (0.17%) Groovy
9 1 (0.17%) PowerShell
9 1 (0.17%) Shell Script
9 1 (0.17%) XPath
Qualifications
1 106 (18.12%) Degree
2 24 (4.10%) Security Cleared
3 21 (3.59%) Master's Degree
4 18 (3.08%) ACCA
5 16 (2.74%) PMI Certification
6 10 (1.71%) CISM
6 10 (1.71%) PMP
7 9 (1.54%) CISSP
7 9 (1.54%) RIBA
8 8 (1.37%) Computer Science Degree
8 8 (1.37%) Microsoft Certification
9 7 (1.20%) Numerate Degree
9 7 (1.20%) PRINCE2 Certification
9 7 (1.20%) PRINCE2 Practitioner
10 6 (1.03%) CISA
10 6 (1.03%) SC Cleared
11 5 (0.85%) DV Cleared
11 5 (0.85%) HND
11 5 (0.85%) MBA
11 5 (0.85%) Postgraduate
Quality Assurance & Compliance
1 79 (13.50%) SLA
2 30 (5.13%) IFRS
3 24 (4.10%) QA
4 16 (2.74%) IFRS 9
5 14 (2.39%) Data Quality
6 12 (2.05%) ISO/IEC 27001
7 10 (1.71%) PMO
8 8 (1.37%) NIST
9 6 (1.03%) GDPR
9 6 (1.03%) GRC
10 5 (0.85%) COBIT
11 3 (0.51%) SOC 2
12 2 (0.34%) Actionable Recommendations
12 2 (0.34%) COSO
12 2 (0.34%) Cyber Essentials
13 1 (0.17%) ISO/IEC 17025
13 1 (0.17%) ITGC
13 1 (0.17%) NCSC
13 1 (0.17%) NEBOSH
13 1 (0.17%) PMBOK
System Software
1 13 (2.22%) Active Directory
2 4 (0.68%) Hyper-V
3 3 (0.51%) VMware Infrastructure
4 2 (0.34%) Docker
4 2 (0.34%) Firmware
4 2 (0.34%) VMware ESXi
5 1 (0.17%) vSphere
Systems Management
1 4 (0.68%) Active Directory Federation Services
2 3 (0.51%) CASB
2 3 (0.51%) Kubernetes
3 2 (0.34%) WSUS
4 1 (0.17%) Control-M
4 1 (0.17%) Istio
4 1 (0.17%) Microsoft Intune
4 1 (0.17%) Nmap
Vendors
1 140 (23.93%) Microsoft
2 83 (14.19%) ServiceNow
3 79 (13.50%) Dell
4 24 (4.10%) SAP
5 22 (3.76%) Oracle
6 17 (2.91%) CA
6 17 (2.91%) OpenLink
6 17 (2.91%) Sybase
6 17 (2.91%) TIBCO
7 15 (2.56%) Salesforce
8 8 (1.37%) Cisco
9 6 (1.03%) Databricks
10 5 (0.85%) Apple
10 5 (0.85%) Google
11 4 (0.68%) OpenAI
11 4 (0.68%) VMware
11 4 (0.68%) Zscaler
12 3 (0.51%) Netskope
12 3 (0.51%) Optimizely
12 3 (0.51%) Sitecore