Splunk Jobs in London

Splunk
England > London

The table below provides summary statistics for permanent job vacancies advertised in London with a requirement for knowledge and experience of Splunk products and/or services. Included is a benchmarking guide to the salaries offered in vacancies that have cited Splunk over the 6 months to 27 April 2024 with a comparison to the same period in the previous 2 years.

The figures below represent the IT labour market in general and are not representative of salaries within Splunk, Inc.

6 months to
27 Apr 2024
Same period 2023 Same period 2022
Rank 400 323 369
Rank change year-on-year -77 +46 +21
Permanent jobs citing Splunk 108 370 674
As % of all permanent jobs advertised in London 0.46% 1.03% 1.03%
As % of the Vendors category 1.13% 2.63% 2.75%
Number of salaries quoted 85 262 338
10th Percentile £50,100 £50,250 £55,000
25th Percentile £52,500 £62,500 £62,750
Median annual salary (50th Percentile) £72,500 £76,250 £80,000
Median % change year-on-year -4.92% -4.69% +6.67%
75th Percentile £88,750 £87,500 £100,000
90th Percentile £96,500 £98,625 £115,000
England median annual salary £60,000 £70,000 £70,000
% change year-on-year -14.29% - +3.70%

All Vendors
London

Splunk is in the Vendor Products and Services category. The following table is for comparison with the above and provides summary statistics for all permanent job vacancies with a requirement for knowledge or experience of vendor products and services advertised in London.

Permanent vacancies with a requirement for knowledge or experience of vendor products and services 9,555 14,066 24,470
As % of all permanent jobs advertised in London 40.70% 39.27% 37.44%
Number of salaries quoted 6,591 9,650 12,821
10th Percentile £35,750 £37,500 £36,750
25th Percentile £47,500 £51,250 £50,000
Median annual salary (50th Percentile) £65,000 £67,500 £65,000
Median % change year-on-year -3.70% +3.85% -
75th Percentile £87,500 £88,750 £85,000
90th Percentile £105,000 £105,000 £102,500
England median annual salary £50,000 £57,000 £55,000
% change year-on-year -12.28% +3.64% +2.80%

Splunk
Job Vacancy Trend in London

Job postings citing Splunk as a proportion of all IT jobs advertised in London.
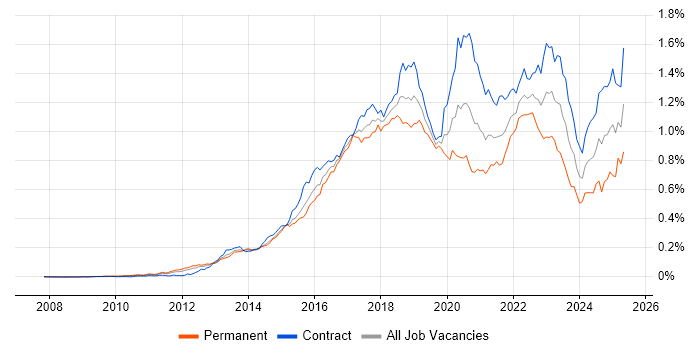
Job vacancy trend for Splunk in London

Splunk
Salary Trend in London

3-month moving average salary quoted in jobs citing Splunk in London.

Salary trend for Splunk in London

Splunk
Salary Histogram in London

Salary distribution for jobs citing Splunk in London over the 6 months to 27 April 2024.

Salary histogram for Splunk in London

Splunk
Job Locations in London

The table below looks at the demand and provides a guide to the median salaries quoted in IT jobs citing Splunk within the London region over the 6 months to 27 April 2024. The 'Rank Change' column provides an indication of the change in demand within each location based on the same 6 month period last year.

Location Rank Change
on Same Period
Last Year
Matching
Permanent
IT Job Ads
Median Salary
Past 6 Months
Median Salary
% Change
on Same Period
Last Year
Live
Jobs
Central London -14 13 £72,500 -13.43%
South London - 5 £61,050 - 1
North London -1 1 £65,000 -
Splunk
England

Splunk
Co-occurring Skills and Capabilities in London by Category

The follow tables expand on the table above by listing co-occurrences grouped by category. The same employment type, locality and period is covered with up to 20 co-occurrences shown in each of the following categories:

Application Platforms
1 7 (6.48%) Microsoft Exchange
2 6 (5.56%) Confluence
3 2 (1.85%) nginx
4 1 (0.93%) Apache
4 1 (0.93%) JBoss
Applications
1 9 (8.33%) Microsoft Excel
Cloud Services
1 39 (36.11%) Azure
2 30 (27.78%) AWS
3 15 (13.89%) Cloud Computing
4 13 (12.04%) GCP
5 12 (11.11%) Azure DevOps
5 12 (11.11%) Azure Sentinel
5 12 (11.11%) Microsoft 365
6 9 (8.33%) Datadog
6 9 (8.33%) Microsoft Purview
6 9 (8.33%) PaaS
7 6 (5.56%) Amazon EC2
7 6 (5.56%) IaaS
8 5 (4.63%) OpenShift
8 5 (4.63%) SaaS
9 4 (3.70%) Amazon CloudWatch
9 4 (3.70%) Amazon ECS
9 4 (3.70%) Amazon EKS
9 4 (3.70%) Azure Monitor
9 4 (3.70%) Azure Pipelines
9 4 (3.70%) Serverless
Communications & Networking
1 23 (21.30%) TCP/IP
2 21 (19.44%) Firewall
2 21 (19.44%) Network Security
3 15 (13.89%) WAN
4 12 (11.11%) VPN
5 8 (7.41%) DNS
5 8 (7.41%) LAN
5 8 (7.41%) Wireshark
6 7 (6.48%) Cisco Firepower
6 7 (6.48%) Cisco IOS
6 7 (6.48%) Cisco ISE
6 7 (6.48%) SD-WAN
7 2 (1.85%) IPv4
7 2 (1.85%) IPv6
7 2 (1.85%) SSL
8 1 (0.93%) DHCP
8 1 (0.93%) FTP
8 1 (0.93%) HTTP
8 1 (0.93%) Reverse Proxy
8 1 (0.93%) SMTP
Database & Business Intelligence
1 8 (7.41%) SQL Server
2 6 (5.56%) Elasticsearch
3 5 (4.63%) CockroachDB
3 5 (4.63%) PostgreSQL
4 4 (3.70%) NoSQL
4 4 (3.70%) RDBMS
4 4 (3.70%) Relational Database
5 2 (1.85%) Big Data
5 2 (1.85%) Hadoop
5 2 (1.85%) Power BI
6 1 (0.93%) Amazon Redshift
6 1 (0.93%) Apache Cassandra
6 1 (0.93%) MongoDB
6 1 (0.93%) Oracle Exadata
6 1 (0.93%) Tableau
Development Applications
1 25 (23.15%) Jenkins
2 11 (10.19%) Git
3 8 (7.41%) GitLab
3 8 (7.41%) JIRA
3 8 (7.41%) JUnit
4 7 (6.48%) Sonatype Nexus
5 6 (5.56%) Bitbucket
5 6 (5.56%) Selenium
6 5 (4.63%) Jaeger
6 5 (4.63%) JMeter
6 5 (4.63%) SonarQube
7 4 (3.70%) Maven
7 4 (3.70%) Mockito
8 3 (2.78%) CircleCI
8 3 (2.78%) Cucumber
8 3 (2.78%) Subversion
8 3 (2.78%) TestNG
8 3 (2.78%) Travis CI
9 2 (1.85%) Atlassian Bamboo
9 2 (1.85%) TeamCity
General
1 46 (42.59%) Social Skills
2 35 (32.41%) Finance
3 24 (22.22%) Analytical Skills
4 16 (14.81%) Banking
5 13 (12.04%) Law
6 8 (7.41%) Inclusion and Diversity
6 8 (7.41%) Presentation Skills
7 7 (6.48%) Public Sector
8 6 (5.56%) Marketing
8 6 (5.56%) Pharmaceutical
9 5 (4.63%) Financial Institution
9 5 (4.63%) Investment Banking
10 4 (3.70%) Legal
11 2 (1.85%) Influencing Skills
12 1 (0.93%) Local Government
12 1 (0.93%) Organisational Skills
Job Titles
1 27 (25.00%) Security Engineer
2 26 (24.07%) Analyst
3 24 (22.22%) Senior
4 17 (15.74%) SOC Analyst
5 13 (12.04%) Senior Security Engineer
6 11 (10.19%) Architect
7 10 (9.26%) Network Engineer
7 10 (9.26%) Network Security Engineer
8 9 (8.33%) Developer
8 9 (8.33%) DevOps Engineer
9 8 (7.41%) Senior Analyst
10 7 (6.48%) Cisco Engineer
10 7 (6.48%) Cisco Network Engineer
10 7 (6.48%) Cisco Security Engineer
10 7 (6.48%) Senior Cisco Engineer
10 7 (6.48%) Senior Cisco Network Engineer
10 7 (6.48%) Senior Network Engineer
10 7 (6.48%) Senior Network Security Engineer
11 6 (5.56%) Lead
12 5 (4.63%) Information Security Engineer
Libraries, Frameworks & Software Standards
1 17 (15.74%) Kafka
2 12 (11.11%) HTML
3 11 (10.19%) Spring Boot
4 9 (8.33%) Elastic Stack
5 6 (5.56%) Spring
6 5 (4.63%) .NET
6 5 (4.63%) Middleware
6 5 (4.63%) OpenTelemetry
6 5 (4.63%) Web Services
7 4 (3.70%) ActiveMQ
7 4 (3.70%) Apache Camel
7 4 (3.70%) Hibernate
7 4 (3.70%) jQuery
7 4 (3.70%) RabbitMQ
7 4 (3.70%) REST
7 4 (3.70%) WebSockets
7 4 (3.70%) WireMock
8 2 (1.85%) Apache NiFi
8 2 (1.85%) Mustache
8 2 (1.85%) RESTful
Miscellaneous
1 18 (16.67%) Management Information System
2 16 (14.81%) Security Operations Centre
3 10 (9.26%) Client/Server
4 9 (8.33%) Distributed Systems
5 7 (6.48%) Hedge funds
5 7 (6.48%) PKI
5 7 (6.48%) Public Cloud
6 5 (4.63%) Analytical Mindset
6 5 (4.63%) Distributed Denial-of-Service
6 5 (4.63%) Self-Motivation
7 4 (3.70%) Cyber Kill Chain
7 4 (3.70%) Cyberattack
7 4 (3.70%) Market Risk
8 3 (2.78%) Distributed Computing
8 3 (2.78%) Hybrid Cloud
9 2 (1.85%) Cloud Native
9 2 (1.85%) Cyber Threat
9 2 (1.85%) Data Centre
10 1 (0.93%) Greenfield Project
10 1 (0.93%) Linux Command Line
Operating Systems
1 35 (32.41%) Windows
2 34 (31.48%) Linux
3 10 (9.26%) Windows Server
4 8 (7.41%) Android
4 8 (7.41%) Apple iOS
4 8 (7.41%) Unix
5 6 (5.56%) CentOS
5 6 (5.56%) Red Hat Enterprise Linux
6 4 (3.70%) Solaris
6 4 (3.70%) Ubuntu
6 4 (3.70%) zOS
7 1 (0.93%) Mac OS
7 1 (0.93%) Mac OS X
7 1 (0.93%) Windows 10
7 1 (0.93%) Windows Server 2012
7 1 (0.93%) Windows Server 2016
7 1 (0.93%) Windows Server 2019
Processes & Methodologies
1 48 (44.44%) Cybersecurity
2 41 (37.96%) SIEM
3 40 (37.04%) DevOps
4 31 (28.70%) Agile
5 28 (25.93%) CI/CD
6 26 (24.07%) Security Operations
7 23 (21.30%) Incident Response
7 23 (21.30%) Vulnerability Management
8 22 (20.37%) Security Management
9 21 (19.44%) Process Improvement
10 19 (17.59%) Cloud Security
10 19 (17.59%) Problem-Solving
11 17 (15.74%) Zero Trust
12 16 (14.81%) Disaster Recovery
12 16 (14.81%) Identity Access Management
12 16 (14.81%) Information Security
13 14 (12.96%) Roadmaps
14 12 (11.11%) Ethical Hacking
14 12 (11.11%) Key Management
14 12 (11.11%) Microservices
Programming Languages
1 28 (25.93%) Python
2 25 (23.15%) PowerShell
3 22 (20.37%) SQL
4 21 (19.44%) Java
5 12 (11.11%) C#
6 7 (6.48%) Bash
7 6 (5.56%) JavaScript
7 6 (5.56%) Shell Script
8 3 (2.78%) Perl
9 2 (1.85%) C++
10 1 (0.93%) C
10 1 (0.93%) Go
10 1 (0.93%) PL/SQL
10 1 (0.93%) Ruby
Qualifications
1 20 (18.52%) CISSP
2 12 (11.11%) Cisco Certification
2 12 (11.11%) Degree
3 11 (10.19%) Security Cleared
4 8 (7.41%) (ISC)2 CCSP
4 8 (7.41%) CCSP
4 8 (7.41%) CEH
4 8 (7.41%) SANS
4 8 (7.41%) SSCP
5 7 (6.48%) Computer Science Degree
6 6 (5.56%) SC Cleared
7 5 (4.63%) CISA
7 5 (4.63%) DV Cleared
7 5 (4.63%) GIAC
7 5 (4.63%) JNCIA
8 4 (3.70%) CCIE
8 4 (3.70%) CISM
9 3 (2.78%) AWS Certification
9 3 (2.78%) AWS Certified Solutions Architect
10 2 (1.85%) CompTIA CySA+
Quality Assurance & Compliance
1 25 (23.15%) ISO/IEC 27001
2 16 (14.81%) NIST
3 10 (9.26%) PCI DSS
4 4 (3.70%) ISO/IEC 27002 (supersedes ISO/IEC 17799)
5 2 (1.85%) HIPAA
5 2 (1.85%) ISO 31000
5 2 (1.85%) SOC 2
6 1 (0.93%) Accessibility
6 1 (0.93%) Data Quality
6 1 (0.93%) QA
6 1 (0.93%) SLA
System Software
1 23 (21.30%) Docker
2 12 (11.11%) Active Directory
3 9 (8.33%) Virtual Desktop
3 9 (8.33%) VMware Infrastructure
4 7 (6.48%) Hyper-V
5 3 (2.78%) Virtual Machines
5 3 (2.78%) VirtualBox
Systems Management
1 22 (20.37%) Kubernetes
2 19 (17.59%) QRadar
3 17 (15.74%) Ansible
4 14 (12.96%) Kibana
5 12 (11.11%) Terraform
6 11 (10.19%) Grafana
6 11 (10.19%) Microsoft Intune
7 10 (9.26%) Prometheus
8 9 (8.33%) Puppet
9 8 (7.41%) Nagios
9 8 (7.41%) Nmap
10 7 (6.48%) Cisco CUCM
10 7 (6.48%) Stealthwatch
11 6 (5.56%) Kiali
11 6 (5.56%) Progress Chef
12 5 (4.63%) ZABBIX
13 4 (3.70%) logstash
14 3 (2.78%) Packer
15 2 (1.85%) Graphite
16 1 (0.93%) Salt
Vendors
1 17 (15.74%) Microsoft
2 16 (14.81%) IBM
3 13 (12.04%) Qualys
4 12 (11.11%) Dynatrace
5 11 (10.19%) Cisco
5 11 (10.19%) New Relic
6 10 (9.26%) VMware
7 9 (8.33%) AppDynamics
7 9 (8.33%) Rapid7
8 8 (7.41%) Thycotic
9 7 (6.48%) Google
10 6 (5.56%) Red Hat
11 5 (4.63%) Juniper
12 4 (3.70%) ServiceNow
13 3 (2.78%) LogRhythm
14 2 (1.85%) Atlassian
14 2 (1.85%) Black Duck
14 2 (1.85%) Cloudera
15 1 (0.93%) ArcSight
15 1 (0.93%) BMC