Influencing Skills Jobs in London

Influencing Skills
England > London

The table below looks at the prevalence of the term Influencing Skills in permanent job vacancies advertised in London. Included is a benchmarking guide to the salaries offered in vacancies that have cited Influencing Skills over the 6 months to 27 April 2024 with a comparison to the same period over the previous 2 years.

6 months to
27 Apr 2024
Same period 2023 Same period 2022
Rank 154 253 294
Rank change year-on-year +99 +41 +12
Permanent jobs citing Influencing Skills 485 508 915
As % of all permanent jobs advertised in London 2.07% 1.42% 1.40%
As % of the General category 3.06% 2.05% 2.07%
Number of salaries quoted 146 283 443
10th Percentile £42,202 £46,275 £45,000
25th Percentile £55,000 £60,000 £55,000
Median annual salary (50th Percentile) £72,500 £72,800 £72,500
Median % change year-on-year -0.41% +0.41% +3.57%
75th Percentile £80,000 £88,750 £95,000
90th Percentile £97,500 £104,100 £108,500
England median annual salary £62,500 £65,000 £60,000
% change year-on-year -3.85% +8.33% -

All General Skills
London

Influencing Skills is in the General Skills category. The following table is for comparison with the above and provides summary statistics for all permanent job vacancies advertised in London with a requirement for common skills.

Permanent vacancies with a requirement for common skills 15,828 24,723 44,132
As % of all permanent jobs advertised in London 67.42% 69.03% 67.53%
Number of salaries quoted 11,305 16,984 22,561
10th Percentile £36,250 £42,500 £41,250
25th Percentile £50,625 £55,000 £52,500
Median annual salary (50th Percentile) £70,000 £74,500 £70,000
Median % change year-on-year -6.04% +6.43% -
75th Percentile £93,750 £95,000 £92,500
90th Percentile £117,500 £120,000 £112,500
England median annual salary £52,500 £60,249 £60,000
% change year-on-year -12.86% +0.42% +4.35%

Influencing Skills
Job Vacancy Trend in London

Job postings citing Influencing Skills as a proportion of all IT jobs advertised in London.
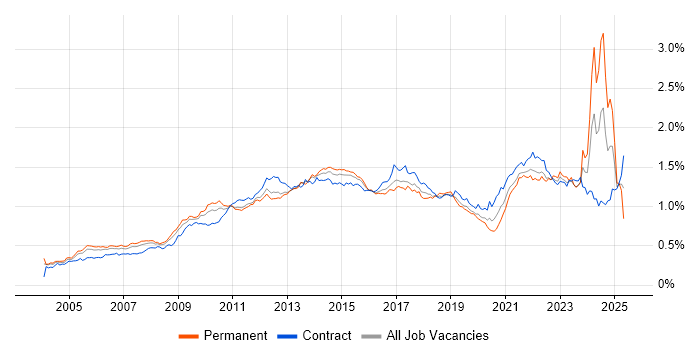
Job vacancy trend for Influencing Skills in London

Influencing Skills
Salary Trend in London

3-month moving average salary quoted in jobs citing Influencing Skills in London.

Salary trend for Influencing Skills in London

Influencing Skills
Salary Histogram in London

Salary distribution for jobs citing Influencing Skills in London over the 6 months to 27 April 2024.

Salary histogram for Influencing Skills in London

Influencing Skills
Job Locations in London

The table below looks at the demand and provides a guide to the median salaries quoted in IT jobs citing Influencing Skills within the London region over the 6 months to 27 April 2024. The 'Rank Change' column provides an indication of the change in demand within each location based on the same 6 month period last year.

Location Rank Change
on Same Period
Last Year
Matching
Permanent
IT Job Ads
Median Salary
Past 6 Months
Median Salary
% Change
on Same Period
Last Year
Live
Jobs
West London +49 131 - - 14
South London +58 61 £60,000 +39.53% 3
Central London -12 34 £56,395 -16.45% 23
North London +1 6 - - 1
Influencing Skills
England

Influencing Skills
Co-occurring Skills and Capabilities in London by Category

The follow tables expand on the table above by listing co-occurrences grouped by category. The same employment type, locality and period is covered with up to 20 co-occurrences shown in each of the following categories:

Application Platforms
1 10 (2.06%) SharePoint
2 5 (1.03%) Confluence
3 3 (0.62%) Apache Spark
4 2 (0.41%) Apache
4 2 (0.41%) SAS
5 1 (0.21%) Drupal
Applications
1 251 (51.75%) Microsoft Excel
2 14 (2.89%) Microsoft PowerPoint
3 8 (1.65%) Microsoft Office
4 4 (0.82%) Microsoft Project
5 3 (0.62%) Adobe Captivate
5 3 (0.62%) Adobe Creative Suite
5 3 (0.62%) Adobe Illustrator
5 3 (0.62%) MS Visio
5 3 (0.62%) Photoshop
6 2 (0.41%) SPSS
7 1 (0.21%) Sketch
Business Applications
1 6 (1.24%) SAP S/4HANA
2 5 (1.03%) SAP CRM
2 5 (1.03%) SAP CX
2 5 (1.03%) SAP GTS
2 5 (1.03%) SAP SD
2 5 (1.03%) SAP WM
3 2 (0.41%) SAP MM
3 2 (0.41%) SAP PM
4 1 (0.21%) Data Workbench
4 1 (0.21%) Elite 3E
4 1 (0.21%) Salesforce CRM
4 1 (0.21%) SAP HCM
4 1 (0.21%) Shopify
4 1 (0.21%) Workday HCM
Cloud Services
1 24 (4.95%) Azure
2 22 (4.54%) Power Platform
3 13 (2.68%) GCP
4 12 (2.47%) AWS
5 11 (2.27%) Microsoft 365
6 9 (1.86%) PowerApps
7 7 (1.44%) Azure DevOps
8 6 (1.24%) Azure Data Factory
8 6 (1.24%) Collibra
9 5 (1.03%) SaaS
10 4 (0.82%) Dynamics 365
11 3 (0.62%) Adobe Creative Cloud
11 3 (0.62%) Azure Key Vault
11 3 (0.62%) GitHub
11 3 (0.62%) GitHub Actions
11 3 (0.62%) Microsoft Purview
11 3 (0.62%) PaaS
12 2 (0.41%) IaaS
12 2 (0.41%) SAP Commerce Cloud
12 2 (0.41%) SuccessFactors
Communications & Networking
1 223 (45.98%) Broadband
2 8 (1.65%) Firewall
3 2 (0.41%) Network Security
3 2 (0.41%) VPN
4 1 (0.21%) DNS
4 1 (0.21%) Internet
4 1 (0.21%) LAN
4 1 (0.21%) WAN
4 1 (0.21%) Wi-Fi
Database & Business Intelligence
1 11 (2.27%) Power BI
2 9 (1.86%) Data Lake
3 6 (1.24%) Tableau
4 4 (0.82%) Azure SQL Database
4 4 (0.82%) Delta Lake
4 4 (0.82%) NoSQL
4 4 (0.82%) Relational Database
5 3 (0.62%) Big Data
5 3 (0.62%) BigQuery
5 3 (0.62%) PostgreSQL
5 3 (0.62%) SQL Server
6 2 (0.41%) Bigtable
6 2 (0.41%) Looker
6 2 (0.41%) Metadata
6 2 (0.41%) MySQL
6 2 (0.41%) Power Query
6 2 (0.41%) PowerPivot
6 2 (0.41%) SQL Server Integration Services
6 2 (0.41%) SQL Server Reporting Services
7 1 (0.21%) Ataccama
Development Applications
1 12 (2.47%) Jenkins
2 7 (1.44%) JIRA
3 5 (1.03%) Git
4 4 (0.82%) Cucumber
5 3 (0.62%) Maven
6 2 (0.41%) Bitbucket
6 2 (0.41%) Selenium
6 2 (0.41%) SonarQube
6 2 (0.41%) Sonatype Nexus
7 1 (0.21%) Appium
7 1 (0.21%) Charles Proxy
7 1 (0.21%) ERwin
7 1 (0.21%) Gradle
7 1 (0.21%) JUnit
7 1 (0.21%) Mocha
7 1 (0.21%) Oracle Forms
7 1 (0.21%) Sinon.JS
General
1 375 (77.32%) Social Skills
2 302 (62.27%) Finance
3 285 (58.76%) Analytical Skills
4 56 (11.55%) Inclusion and Diversity
5 26 (5.36%) Legal
6 25 (5.15%) Marketing
7 15 (3.09%) Presentation Skills
8 13 (2.68%) Banking
9 9 (1.86%) Law
10 8 (1.65%) Retail
11 7 (1.44%) Social Housing
12 6 (1.24%) Local Government
12 6 (1.24%) Organisational Skills
13 5 (1.03%) Games
14 4 (0.82%) Advertising
14 4 (0.82%) Police
14 4 (0.82%) Public Sector
15 3 (0.62%) Investment Banking
15 3 (0.62%) Multimedia
16 2 (0.41%) Manufacturing
Job Titles
1 261 (53.81%) Analyst
2 149 (30.72%) Senior
3 113 (23.30%) Senior Analyst
4 66 (13.61%) Commercial Analyst
5 63 (12.99%) Financial Analyst
6 46 (9.48%) Lead
7 32 (6.60%) Project Manager
8 23 (4.74%) Architect
9 22 (4.54%) Product Manager
10 20 (4.12%) Business Analyst
11 17 (3.51%) Deployment Manager
11 17 (3.51%) Deployment Project Manager
11 17 (3.51%) Engineering Manager
12 16 (3.30%) Senior Manager
13 11 (2.27%) Solutions Architect
14 9 (1.86%) Data Engineer
14 9 (1.86%) Principal Architect
14 9 (1.86%) Technical Manager
15 7 (1.44%) Network Manager
15 7 (1.44%) Senior Data Engineer
Libraries, Frameworks & Software Standards
1 17 (3.51%) HTML
2 6 (1.24%) .NET
3 5 (1.03%) Middleware
3 5 (1.03%) SailPoint
4 4 (0.82%) CSS
4 4 (0.82%) PySpark
5 3 (0.62%) Kafka
6 2 (0.41%) .NET Core
6 2 (0.41%) AngularJS
6 2 (0.41%) OAuth
6 2 (0.41%) OAuth2
6 2 (0.41%) OpenID
6 2 (0.41%) React
6 2 (0.41%) RESTful
7 1 (0.21%) Apache Beam
7 1 (0.21%) Chai
7 1 (0.21%) Dropwizard
7 1 (0.21%) Keycloak
7 1 (0.21%) Nunjucks
7 1 (0.21%) REST
Miscellaneous
1 37 (7.63%) Onboarding
2 24 (4.95%) Product Ownership
3 17 (3.51%) Robotics
4 14 (2.89%) Cyberattack
5 8 (1.65%) Virtual Team
6 6 (1.24%) Greenfield Project
7 5 (1.03%) Digital Media
7 5 (1.03%) Management Information System
8 4 (0.82%) Freedom of Information
9 3 (0.62%) Cloud Security Posture
9 3 (0.62%) Data Centre
9 3 (0.62%) PKI
9 3 (0.62%) Security Posture
9 3 (0.62%) Self-Motivation
10 2 (0.41%) Algorithms
10 2 (0.41%) Blog
10 2 (0.41%) Data Structures
10 2 (0.41%) IoT
10 2 (0.41%) Social Media
10 2 (0.41%) Video Conferencing
Operating Systems
1 10 (2.06%) Windows
2 7 (1.44%) Windows Server
3 3 (0.62%) Linux
4 1 (0.21%) Android
4 1 (0.21%) Apple iOS
4 1 (0.21%) Windows 10
4 1 (0.21%) Windows Server 2012
Processes & Methodologies
1 332 (68.45%) Agile
2 287 (59.18%) Decision-Making
3 270 (55.67%) Mentoring
4 234 (48.25%) Business Case
5 224 (46.19%) Actionable Insight
6 222 (45.77%) Budgeting
7 221 (45.57%) Budgeting and Forecasting
8 103 (21.24%) Problem-Solving
9 59 (12.16%) Continuous Improvement
9 59 (12.16%) Roadmaps
10 55 (11.34%) Stakeholder Management
11 50 (10.31%) Project Management
12 48 (9.90%) Analytics
13 45 (9.28%) Thought Leadership
14 42 (8.66%) Coaching
15 39 (8.04%) Project Delivery
16 35 (7.22%) Process Improvement
17 26 (5.36%) DevOps
18 25 (5.15%) Technology Strategy
19 24 (4.95%) IT Strategy
Programming Languages
1 17 (3.51%) SQL
2 6 (1.24%) Java
2 6 (1.24%) JavaScript
3 5 (1.03%) Python
4 4 (0.82%) C#
5 3 (0.62%) PowerShell
6 2 (0.41%) Go
6 2 (0.41%) T-SQL
6 2 (0.41%) TypeScript
6 2 (0.41%) VBA
7 1 (0.21%) C++
7 1 (0.21%) Scala
Qualifications
1 226 (46.60%) CIMA
2 223 (45.98%) ACCA
3 66 (13.61%) Degree
4 22 (4.54%) Security Cleared
5 19 (3.92%) CISSP
6 15 (3.09%) DV Cleared
7 11 (2.27%) Master's Degree
8 9 (1.86%) Computer Science Degree
9 6 (1.24%) DBS Check
9 6 (1.24%) PMI Certification
9 6 (1.24%) SC Cleared
10 5 (1.03%) Cisco Certification
11 4 (0.82%) (ISC)2 CCSP
11 4 (0.82%) MBA
11 4 (0.82%) PMP
12 3 (0.62%) CCSK
12 3 (0.62%) CCSP
13 2 (0.41%) CIPD
13 2 (0.41%) CITP
13 2 (0.41%) Numerate Degree
Quality Assurance & Compliance
1 11 (2.27%) GDPR
2 8 (1.65%) Data Quality
3 6 (1.24%) Cyber Essentials
3 6 (1.24%) PMO
3 6 (1.24%) QA
4 4 (0.82%) Accessibility
5 2 (0.41%) ISO/IEC 27001
6 1 (0.21%) COBIT
6 1 (0.21%) GRC
6 1 (0.21%) NCSC
6 1 (0.21%) NIST
6 1 (0.21%) Sarbanes-Oxley
System Software
1 7 (1.44%) Docker
2 6 (1.24%) Hyper-V
3 1 (0.21%) Active Directory
Systems Management
1 17 (3.51%) Functional Safety
2 7 (1.44%) Kubernetes
3 6 (1.24%) FortiGate
4 5 (1.03%) Terraform
5 3 (0.62%) CASB
5 3 (0.62%) Kibana
5 3 (0.62%) Prometheus
6 2 (0.41%) Grafana
7 1 (0.21%) Ansible
7 1 (0.21%) Cisco Prime
7 1 (0.21%) Progress Chef
Vendors
1 250 (51.55%) Microsoft
2 8 (1.65%) SAP
3 7 (1.44%) Databricks
4 6 (1.24%) ServiceNow
4 6 (1.24%) VMware
5 5 (1.03%) Google
6 4 (0.82%) Adobe
6 4 (0.82%) Oracle
6 4 (0.82%) Salesforce
7 3 (0.62%) Netskope
7 3 (0.62%) Symantec
7 3 (0.62%) Zscaler
8 2 (0.41%) Cadence
8 2 (0.41%) Dynatrace
8 2 (0.41%) Sitecore
8 2 (0.41%) Splunk
9 1 (0.21%) Cisco
9 1 (0.21%) Maconomy
9 1 (0.21%) SolarWinds
9 1 (0.21%) Teradata