Master's Degree Jobs in London

Master's Degree
England > London

The table below provides summary statistics for permanent job vacancies advertised in London with a requirement for Master's Degree qualifications. It includes a benchmarking guide to the salaries offered over the 6 months leading up to 26 July 2024, comparing them to the same period in the previous two years.

6 months to
26 Jul 2024
Same period 2023 Same period 2022
Rank 123 141 184
Rank change year-on-year +18 +43 +14
Permanent jobs citing Master's Degree 561 654 1,878
As % of all permanent jobs advertised in London 2.71% 2.41% 2.50%
As % of the Qualifications category 9.73% 9.23% 11.64%
Number of salaries quoted 255 415 578
10th Percentile £52,510 £46,250 £26,175
25th Percentile £62,600 £56,000 £50,166
Median annual salary (50th Percentile) £85,000 £80,000 £80,000
Median % change year-on-year +6.25% - -5.88%
75th Percentile £107,500 £115,000 £101,250
90th Percentile £130,000 £137,500 £132,500
England median annual salary £65,000 £75,000 £65,000
% change year-on-year -13.33% +15.38% -

All Academic and Professional Certifications
London

Master's Degree falls under the Academic Qualifications and Professional Certifications category. For comparison with the information above, the following table provides summary statistics for all permanent job vacancies requiring academic qualifications or professional certifications in London.

Permanent vacancies requiring academic qualifications or professional certifications 5,766 7,082 16,138
As % of all permanent jobs advertised in London 27.80% 26.11% 21.51%
Number of salaries quoted 3,193 4,957 7,030
10th Percentile £36,250 £38,750 £36,250
25th Percentile £48,750 £52,000 £48,750
Median annual salary (50th Percentile) £67,500 £67,500 £65,000
Median % change year-on-year - +3.85% -
75th Percentile £87,500 £88,750 £86,250
90th Percentile £102,300 £112,500 £102,500
England median annual salary £55,000 £60,000 £55,000
% change year-on-year -8.33% +9.09% -

Master's Degree
Job Vacancy Trend in London

Job postings citing Master's Degree as a proportion of all IT jobs advertised in London.
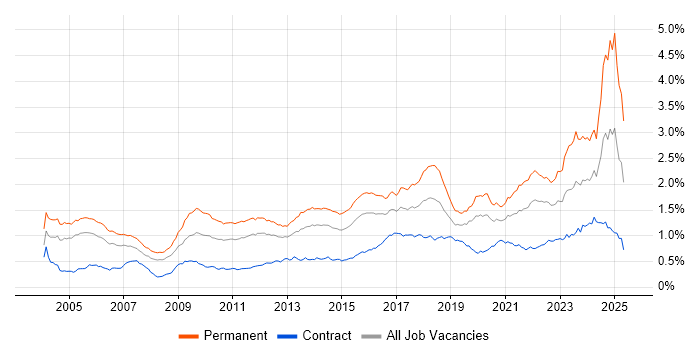
Job vacancy trend for Master's Degree in London

Master's Degree
Salary Trend in London

3-month moving average salary quoted in jobs citing Master's Degree in London.

Salary trend for Master's Degree in London

Master's Degree
Salary Histogram in London

Salary distribution for jobs citing Master's Degree in London over the 6 months to 26 July 2024.

Salary histogram for Master's Degree in London

Master's Degree
Job Locations in London

The table below looks at the demand and provides a guide to the median salaries quoted in IT jobs citing Master's Degree within the London region over the 6 months to 26 July 2024. The 'Rank Change' column provides an indication of the change in demand within each location based on the same 6 month period last year.

Location Rank Change
on Same Period
Last Year
Matching
Permanent
IT Job Ads
Median Salary
Past 6 Months
Median Salary
% Change
on Same Period
Last Year
Live
Jobs
Central London +39 175 £85,000 -2.86% 20
West London -25 6 £62,500 +38.89% 18
South London - 6 £56,650 - 2
East London +20 3 £120,000 +118.18% 12
North London +5 3 £72,500 +3.57% 3
Master's Degree
England

Master's Degree
Co-occurring Skills and Capabilities in London by Category

The follow tables expand on the table above by listing co-occurrences grouped by category. The same employment type, locality and period is covered with up to 20 co-occurrences shown in each of the following categories:

Application Platforms
1 11 (1.96%) Apache Spark
2 9 (1.60%) Apache Airflow
3 6 (1.07%) Skype for Business
4 5 (0.89%) Apache
5 3 (0.53%) Confluence
6 2 (0.36%) Adobe Experience Manager
6 2 (0.36%) CMS
6 2 (0.36%) IIS
6 2 (0.36%) Jupyter
6 2 (0.36%) SharePoint
6 2 (0.36%) Solana
7 1 (0.18%) DataSynapse
7 1 (0.18%) Microsoft Exchange
7 1 (0.18%) Umbraco
Applications
1 30 (5.35%) Microsoft Office
2 26 (4.63%) Microsoft Excel
3 7 (1.25%) Spreadsheet
4 5 (0.89%) Microsoft PowerPoint
5 1 (0.18%) Adobe Illustrator
5 1 (0.18%) Blender
5 1 (0.18%) InDesign
5 1 (0.18%) Photoshop
Business Applications
1 14 (2.50%) Ripple
2 3 (0.53%) SAP S/4HANA
3 2 (0.36%) Sparx Enterprise Architect
4 1 (0.18%) Data Workbench
4 1 (0.18%) Distributed Ledger
4 1 (0.18%) Endur
4 1 (0.18%) Oracle EBS
4 1 (0.18%) Oracle Payroll
4 1 (0.18%) SAP EWM
4 1 (0.18%) Workfront
Cloud Services
1 79 (14.08%) AWS
2 73 (13.01%) Azure
3 29 (5.17%) GCP
4 23 (4.10%) Power Platform
5 11 (1.96%) Microsoft 365
6 10 (1.78%) Azure DevOps
6 10 (1.78%) Cloud Computing
6 10 (1.78%) GitHub
7 8 (1.43%) SaaS
8 7 (1.25%) AWS Lambda
8 7 (1.25%) Serverless
8 7 (1.25%) WhatsApp
9 6 (1.07%) SurveyMonkey
10 5 (0.89%) Amazon Kinesis
10 5 (0.89%) Amazon S3
11 4 (0.71%) Amazon EKS
11 4 (0.71%) Amazon SQS
11 4 (0.71%) Dynamics 365
11 4 (0.71%) Google Gemini
12 3 (0.53%) Snowflake
Communications & Networking
1 17 (3.03%) Firewall
1 17 (3.03%) Internet
2 6 (1.07%) Cisco IOS
2 6 (1.07%) Skype
2 6 (1.07%) Telepresence
3 5 (0.89%) Wi-Fi
4 4 (0.71%) Intranet
4 4 (0.71%) TCP/IP
5 3 (0.53%) 5G
5 3 (0.53%) Broadband
5 3 (0.53%) SNMP
6 2 (0.36%) VPN
6 2 (0.36%) Wireless
7 1 (0.18%) ADSL
7 1 (0.18%) Intrusion Detection
7 1 (0.18%) LAN
7 1 (0.18%) SAN
7 1 (0.18%) VLAN
7 1 (0.18%) VPLS
7 1 (0.18%) WAN
Database & Business Intelligence
1 77 (13.73%) Tableau
2 25 (4.46%) Big Data
3 23 (4.10%) Power BI
4 16 (2.85%) Data Warehouse
4 16 (2.85%) SQL Server
5 12 (2.14%) Hadoop
6 11 (1.96%) Amazon QuickSight
6 11 (1.96%) Amazon Redshift
6 11 (1.96%) MySQL
7 8 (1.43%) NoSQL
7 8 (1.43%) PostgreSQL
7 8 (1.43%) Redis
8 7 (1.25%) SQL Server Integration Services
8 7 (1.25%) SQL Server Reporting Services
9 6 (1.07%) MS Access
10 5 (0.89%) Data Lake
10 5 (0.89%) Data Mining
10 5 (0.89%) Relational Database
11 4 (0.71%) Elasticsearch
11 4 (0.71%) MongoDB
Development Applications
1 63 (11.23%) Git
2 19 (3.39%) Jenkins
3 11 (1.96%) GitLab
4 5 (0.89%) Selenium
5 4 (0.71%) MLflow
6 3 (0.53%) Cypress.io
6 3 (0.53%) WebDriver
7 2 (0.36%) CircleCI
7 2 (0.36%) Jasmine
7 2 (0.36%) NUnit
7 2 (0.36%) PowerDesigner
7 2 (0.36%) Team Foundation Server
7 2 (0.36%) webpack
8 1 (0.18%) Bitbucket
8 1 (0.18%) JIRA
8 1 (0.18%) Mocha
8 1 (0.18%) Octopus Deploy
8 1 (0.18%) TeamCity
8 1 (0.18%) TensorBoard
General
1 315 (56.15%) Social Skills
2 173 (30.84%) Finance
3 165 (29.41%) Analytical Skills
4 56 (9.98%) Pharmaceutical
5 47 (8.38%) Presentation Skills
6 43 (7.66%) Legal
7 39 (6.95%) Banking
7 39 (6.95%) Inclusion and Diversity
8 35 (6.24%) Law
9 25 (4.46%) Public Sector
10 24 (4.28%) Marketing
11 20 (3.57%) French Language
12 19 (3.39%) Dutch Language
12 19 (3.39%) German Language
12 19 (3.39%) Multimedia
12 19 (3.39%) Public Speaking
13 17 (3.03%) Retail
14 15 (2.67%) Financial Institution
15 14 (2.50%) Manufacturing
16 11 (1.96%) Games
Job Titles
1 146 (26.02%) Senior
2 94 (16.76%) Analyst
3 80 (14.26%) Data Scientist
4 72 (12.83%) Senior Data Scientist
5 66 (11.76%) Developer
6 47 (8.38%) Architect
7 35 (6.24%) Lead
8 22 (3.92%) Senior Developer
9 19 (3.39%) HR Trainer
9 19 (3.39%) Trainer
10 18 (3.21%) Quantitative Developer
10 18 (3.21%) Software Engineer
11 17 (3.03%) Data Analyst
11 17 (3.03%) Information Manager
11 17 (3.03%) Information Security Manager
11 17 (3.03%) Qualitative Analyst
11 17 (3.03%) Quantitative Analyst
11 17 (3.03%) Security Manager
12 15 (2.67%) Consultant
12 15 (2.67%) Solutions Architect
Libraries, Frameworks & Software Standards
1 64 (11.41%) TensorFlow
2 53 (9.45%) Pandas
3 50 (8.91%) scikit-learn
4 45 (8.02%) PySpark
5 30 (5.35%) .NET
6 27 (4.81%) Kafka
7 22 (3.92%) PyTorch
8 19 (3.39%) React
9 16 (2.85%) CSS
10 15 (2.67%) HTML
11 10 (1.78%) AngularJS
11 10 (1.78%) ASP.NET
12 8 (1.43%) .NET Core
12 8 (1.43%) .NET Framework
12 8 (1.43%) jQuery
12 8 (1.43%) JSON
12 8 (1.43%) RESTful
13 7 (1.25%) NumPy
13 7 (1.25%) RabbitMQ
14 6 (1.07%) Entity Framework
Miscellaneous
1 138 (24.60%) Algorithms
2 50 (8.91%) Onboarding
3 46 (8.20%) Life Science
4 33 (5.88%) Management Information System
5 24 (4.28%) Foreign Exchange (FX)
6 21 (3.74%) e-Learning
7 20 (3.57%) Blockchain
7 20 (3.57%) Self-Motivation
8 19 (3.39%) Data Structures
8 19 (3.39%) Learning Management System
9 18 (3.21%) Security Posture
10 15 (2.67%) Distributed Systems
11 13 (2.32%) Distributed Computing
11 13 (2.32%) Virtual Team
12 11 (1.96%) IoT
13 10 (1.78%) Enterprise Software
13 10 (1.78%) Hedge funds
14 9 (1.60%) Product Ownership
14 9 (1.60%) Robotics
15 8 (1.43%) Equities
Operating Systems
1 15 (2.67%) Linux
2 13 (2.32%) Windows
3 7 (1.25%) Windows 10
4 6 (1.07%) Windows 7
5 4 (0.71%) Unix
5 4 (0.71%) Windows Server
6 1 (0.18%) Android
6 1 (0.18%) Robot Operating System
6 1 (0.18%) Windows Server 2012
Processes & Methodologies
1 289 (51.52%) Computer Science
2 182 (32.44%) Statistics
3 172 (30.66%) Data Science
4 157 (27.99%) Problem-Solving
5 144 (25.67%) Visualisation
6 138 (24.60%) Mathematics
7 137 (24.42%) Analytics
8 122 (21.75%) Machine Learning
9 113 (20.14%) Decision-Making
10 97 (17.29%) Software Engineering
11 96 (17.11%) Agile
12 95 (16.93%) Physics
13 91 (16.22%) Artificial Intelligence
14 90 (16.04%) Data Visualisation
15 87 (15.51%) Customer Experience
16 82 (14.62%) Actionable Insight
17 77 (13.73%) Mentoring
18 70 (12.48%) Data Modelling
19 62 (11.05%) Continuous Improvement
19 62 (11.05%) Natural Language Processing
Programming Languages
1 209 (37.25%) Python
2 133 (23.71%) SQL
3 63 (11.23%) C#
4 56 (9.98%) Java
5 47 (8.38%) C++
6 29 (5.17%) JavaScript
7 27 (4.81%) R
8 15 (2.67%) TypeScript
9 13 (2.32%) MATLAB
10 6 (1.07%) C
10 6 (1.07%) Go
11 5 (0.89%) Scala
11 5 (0.89%) Shell Script
12 3 (0.53%) PowerShell
12 3 (0.53%) Rust
12 3 (0.53%) T-SQL
13 2 (0.36%) Ruby
14 1 (0.18%) Haskell
14 1 (0.18%) Kotlin
14 1 (0.18%) SPARQL
Qualifications
1 561 (100.00%) Degree
2 139 (24.78%) PhD
3 124 (22.10%) Computer Science Degree
4 50 (8.91%) DBS Check
5 46 (8.20%) MBA
6 34 (6.06%) CISSP
7 30 (5.35%) CISM
8 20 (3.57%) Security Cleared
9 14 (2.50%) CISA
10 8 (1.43%) CREST Certified
11 7 (1.25%) CESG Certified Professional
11 7 (1.25%) PMI Certification
11 7 (1.25%) PMP
11 7 (1.25%) SC Cleared
12 6 (1.07%) AWS Certification
12 6 (1.07%) ITIL Foundation Certificate
12 6 (1.07%) Six Sigma Black Belt
12 6 (1.07%) TOGAF Certification
13 5 (0.89%) AWS Certified Solutions Architect
13 5 (0.89%) DV Cleared
Quality Assurance & Compliance
1 33 (5.88%) Data Quality
2 22 (3.92%) QA
3 15 (2.67%) ISO/IEC 27001
4 11 (1.96%) Accessibility
5 7 (1.25%) GDPR
5 7 (1.25%) HMG Security Policy Framework
6 5 (0.89%) NIST
7 3 (0.53%) GRC
7 3 (0.53%) ISO 31000
7 3 (0.53%) ISO/IEC 27005
7 3 (0.53%) NCSC
7 3 (0.53%) NIST 800
7 3 (0.53%) PCI DSS
8 2 (0.36%) COBIT
8 2 (0.36%) GxP
9 1 (0.18%) California Consumer Privacy Act
9 1 (0.18%) HIPAA
9 1 (0.18%) ISO/IEC 27002 (supersedes ISO/IEC 17799)
9 1 (0.18%) NEBOSH
9 1 (0.18%) SNOMED CT
System Software
1 23 (4.10%) Docker
2 6 (1.07%) VMware Infrastructure
3 3 (0.53%) Active Directory
4 2 (0.36%) Hyper-V
5 1 (0.18%) Slurm Workload Manager
5 1 (0.18%) VirtualBox
Systems Management
1 28 (4.99%) Kubernetes
2 15 (2.67%) Terraform
3 8 (1.43%) Ansible
4 6 (1.07%) Kubeflow
5 3 (0.53%) Argo
5 3 (0.53%) Grafana
6 2 (0.36%) Kibana
6 2 (0.36%) Microsoft Intune
6 2 (0.36%) Prometheus
7 1 (0.18%) CFEngine
7 1 (0.18%) Core Impact
7 1 (0.18%) ITRS Geneos
7 1 (0.18%) Nessus
7 1 (0.18%) Progress Chef
7 1 (0.18%) Puppet
7 1 (0.18%) RSA Archer
7 1 (0.18%) Single Sign-On
Vendors
1 58 (10.34%) Microsoft
2 52 (9.27%) Databricks
3 11 (1.96%) Cisco
4 10 (1.78%) SAP
5 9 (1.60%) Google
6 8 (1.43%) Oracle
7 7 (1.25%) Apple
8 6 (1.07%) Alteryx
8 6 (1.07%) Minitab
8 6 (1.07%) Polycom
8 6 (1.07%) Qualtrics
8 6 (1.07%) VMware
9 5 (0.89%) OpenAI
10 4 (0.71%) Aruba
10 4 (0.71%) CA
10 4 (0.71%) HP
11 3 (0.53%) Adobe
11 3 (0.53%) Virgin Media
12 2 (0.36%) MicroStrategy
12 2 (0.36%) StreamSets