Computer Science Jobs in the South East

Computer Science
England > South East

The following table provides summary statistics for permanent job vacancies advertised in the South East with a requirement for Computer Science skills. Included is a benchmarking guide to the salaries offered in vacancies that have cited Computer Science over the 6 months to 1 December 2023 with a comparison to the same period in the previous 2 years.

6 months to
1 Dec 2023
Same period 2022 Same period 2021
Rank 32 28 32
Rank change year-on-year -4 +4 +23
Permanent jobs citing Computer Science 502 1,449 1,488
As % of all permanent jobs advertised in the South East 6.48% 8.32% 8.06%
As % of the Processes & Methodologies category 6.95% 8.75% 8.48%
Number of salaries quoted 349 520 687
10th Percentile £33,750 £32,500 £27,500
25th Percentile £44,560 £37,500 £34,995
Median annual salary (50th Percentile) £60,000 £52,500 £50,000
Median % change year-on-year +14.29% +5.00% -
75th Percentile £75,000 £71,563 £67,500
90th Percentile £92,500 £87,500 £75,500
England median annual salary £65,000 £62,500 £60,000
% change year-on-year +4.00% +4.17% -

All Process and Methodology Skills
South East

Computer Science is in the Processes and Methodologies category. The following table is for comparison with the above and provides summary statistics for all permanent job vacancies advertised in the South East with a requirement for process or methodology skills.

Permanent vacancies with a requirement for process or methodology skills 7,222 16,558 17,546
As % of all permanent jobs advertised in the South East 93.16% 95.10% 94.99%
Number of salaries quoted 4,839 9,997 11,818
10th Percentile £30,500 £31,250 £31,250
25th Percentile £40,000 £41,750 £40,500
Median annual salary (50th Percentile) £54,500 £55,000 £52,500
Median % change year-on-year -0.91% +4.76% +5.00%
75th Percentile £67,500 £72,500 £67,500
90th Percentile £82,500 £85,000 £80,000
England median annual salary £60,000 £62,500 £60,000
% change year-on-year -4.00% +4.17% +9.09%

Computer Science
Job Vacancy Trend in the South East

Job postings citing Computer Science as a proportion of all IT jobs advertised in the South East.
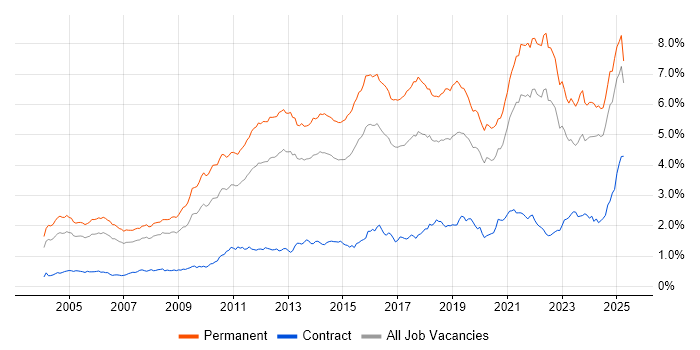
Job vacancy trend for Computer Science in the South East

Computer Science
Salary Trend in the South East

3-month moving average salary quoted in jobs citing Computer Science in the South East.

Salary trend for Computer Science in the South East

Computer Science
Salary Histogram in the South East

Salary distribution for jobs citing Computer Science in the South East over the 6 months to 1 December 2023.

Salary histogram for Computer Science in the South East

Computer Science
Job Locations in the South East

The table below looks at the demand and provides a guide to the median salaries quoted in IT jobs citing Computer Science within the South East region over the 6 months to 1 December 2023. The 'Rank Change' column provides an indication of the change in demand within each location based on the same 6 month period last year.

Location Rank Change
on Same Period
Last Year
Matching
Permanent
IT Job Ads
Median Salary
Past 6 Months
Median Salary
% Change
on Same Period
Last Year
Live
Jobs
Thames Valley -4 282 £60,000 +9.09% 120
Berkshire +1 208 £70,000 +3.70% 58
Hampshire -23 84 £50,000 -4.76% 52
East Sussex +76 63 £49,000 -14.78% 13
Buckinghamshire +7 42 £67,500 +25.58% 21
Surrey -17 34 £61,250 +11.36% 55
Oxfordshire -29 32 £52,500 +16.67% 41
West Sussex -5 25 £60,500 +21.00% 14
Kent -2 15 £60,000 +53.85% 16
Middlesex +16 1 £80,000 - 1
Computer Science
England

Computer Science
Co-occurring Skills and Capabilities in the South East by Category

The follow tables expand on the table above by listing co-occurrences grouped by category. The same employment type, locality and period is covered with up to 20 co-occurrences shown in each of the following categories:

Application Platforms
1 70 (13.94%) SAS
2 15 (2.99%) SharePoint
3 12 (2.39%) Apache Spark
4 8 (1.59%) Tomcat
5 7 (1.39%) Apache
6 5 (1.00%) ColdFusion
6 5 (1.00%) Confluence
6 5 (1.00%) ThingWorx
7 4 (0.80%) Apache Airflow
7 4 (0.80%) CMS
8 3 (0.60%) Adobe Experience Manager
9 1 (0.20%) CICS
9 1 (0.20%) Jupyter
9 1 (0.20%) Luigi
9 1 (0.20%) OpenStack
9 1 (0.20%) WordPress
Applications
1 13 (2.59%) Microsoft Office
2 5 (1.00%) Microsoft Excel
3 4 (0.80%) Simulink
3 4 (0.80%) Spreadsheet
4 2 (0.40%) Acrobat
4 2 (0.40%) Fireworks
4 2 (0.40%) MS Visio
4 2 (0.40%) Photoshop
4 2 (0.40%) RoboHelp
5 1 (0.20%) Mathcad
Business Applications
1 7 (1.39%) Dynamics CRM
2 1 (0.20%) JDE EnterpriseOne
2 1 (0.20%) NetSuite
2 1 (0.20%) SAP PP
2 1 (0.20%) SAP S/4HANA
2 1 (0.20%) SAP SCM
Cloud Services
1 66 (13.15%) Azure
2 55 (10.96%) AWS
3 21 (4.18%) GitHub
4 20 (3.98%) GCP
5 18 (3.59%) SaaS
6 15 (2.99%) Microsoft 365
7 10 (1.99%) Serverless
8 8 (1.59%) Amazon SQS
8 8 (1.59%) AWS Lambda
8 8 (1.59%) Azure Synapse Analytics
8 8 (1.59%) Power Platform
9 7 (1.39%) Cloud Computing
10 6 (1.20%) Azure DevOps
11 4 (0.80%) GitHub Actions
11 4 (0.80%) PaaS
12 3 (0.60%) Amazon S3
12 3 (0.60%) IaaS
12 3 (0.60%) PowerApps
13 2 (0.40%) AWS CloudFormation
13 2 (0.40%) Virtual Private Cloud
Communications & Networking
1 18 (3.59%) Internet
2 16 (3.19%) Firewall
3 10 (1.99%) VPN
4 8 (1.59%) TCP/IP
5 7 (1.39%) HTTP
5 7 (1.39%) Network Security
6 6 (1.20%) Intrusion Detection
7 4 (0.80%) WAN
8 3 (0.60%) DNS
8 3 (0.60%) IP Telephony
9 2 (0.40%) BGP
9 2 (0.40%) DHCP
9 2 (0.40%) Intranet
9 2 (0.40%) IPFIX
9 2 (0.40%) IPsec
9 2 (0.40%) LAN
9 2 (0.40%) OSPF
9 2 (0.40%) Software-Defined Networking
9 2 (0.40%) Wireless
10 1 (0.20%) Structured Cabling
Database & Business Intelligence
1 70 (13.94%) Base SAS
2 60 (11.95%) SQL Server
3 57 (11.35%) Metadata
4 42 (8.37%) NoSQL
5 26 (5.18%) MySQL
6 15 (2.99%) PostgreSQL
7 11 (2.19%) Big Data
8 10 (1.99%) Data Lake
9 9 (1.79%) Data Warehouse
10 8 (1.59%) DynamoDB
11 7 (1.39%) Power BI
11 7 (1.39%) Relational Database
12 4 (0.80%) DTS
12 4 (0.80%) Microsoft Analysis Services
12 4 (0.80%) Oracle Database
12 4 (0.80%) Oracle Reports
12 4 (0.80%) Snowflake Schema
12 4 (0.80%) SQL Server Analysis Services
12 4 (0.80%) SQL Server Integration Services
12 4 (0.80%) Star Schema
Development Applications
1 84 (16.73%) Git
2 25 (4.98%) Selenium
3 23 (4.58%) Cypress.io
4 13 (2.59%) Jenkins
5 12 (2.39%) CMake
5 12 (2.39%) Subversion
6 10 (1.99%) JIRA
7 8 (1.59%) Maven
8 5 (1.00%) GitLab
9 4 (0.80%) TestComplete
10 2 (0.40%) Bugzilla
10 2 (0.40%) CruiseControl
10 2 (0.40%) Cucumber
10 2 (0.40%) Gemini Tracker
10 2 (0.40%) Hudson
10 2 (0.40%) LabVIEW
10 2 (0.40%) SoapUI
10 2 (0.40%) TeamCity
10 2 (0.40%) Visual Studio
10 2 (0.40%) VSS/SourceSafe
General
1 115 (22.91%) Social Skills
2 83 (16.53%) Inclusion and Diversity
3 70 (13.94%) Pharmaceutical
4 61 (12.15%) Finance
5 59 (11.75%) Analytical Skills
6 25 (4.98%) Manufacturing
7 19 (3.78%) Electronics
8 17 (3.39%) Marketing
9 16 (3.19%) Telecoms
10 15 (2.99%) Public Sector
11 10 (1.99%) Presentation Skills
12 8 (1.59%) Legal
12 8 (1.59%) Military
13 6 (1.20%) Billing
14 5 (1.00%) Aerospace
15 3 (0.60%) Automotive
16 2 (0.40%) Dutch Language
16 2 (0.40%) German Language
16 2 (0.40%) Japanese Language
16 2 (0.40%) Organisational Skills
Job Titles
1 147 (29.28%) Developer
2 120 (23.90%) Senior
3 65 (12.95%) Software Developer
4 56 (11.16%) Programmer
5 53 (10.56%) SAS Programmer
5 53 (10.56%) SAS Statistical Programmer
5 53 (10.56%) Statistical Programmer
6 49 (9.76%) Software Engineer
7 39 (7.77%) Senior Developer
8 29 (5.78%) Front-End Developer (Client-Side Developer)
8 29 (5.78%) Senior Programmer
8 29 (5.78%) Senior SAS Programmer
8 29 (5.78%) Senior Statistical Programmer
9 24 (4.78%) Principal Statistical Programmer
10 23 (4.58%) Graduate
11 22 (4.38%) Lead
12 20 (3.98%) Junior
13 18 (3.59%) Architect
13 18 (3.59%) Project Manager
14 16 (3.19%) Senior Manager
Libraries, Frameworks & Software Standards
1 95 (18.92%) React
2 93 (18.53%) .NET
3 76 (15.14%) HTML
4 69 (13.75%) XML
5 68 (13.55%) CSS
6 26 (5.18%) HTML5
7 25 (4.98%) ASP.NET
8 24 (4.78%) CSS3
9 23 (4.58%) Jest
10 18 (3.59%) AngularJS
11 15 (2.99%) .NET Core
11 15 (2.99%) jQuery
12 14 (2.79%) Node.js
13 12 (2.39%) REST
14 10 (1.99%) Kafka
14 10 (1.99%) Spring
15 9 (1.79%) ASP.NET MVC
15 9 (1.79%) TensorFlow
16 8 (1.59%) STL
17 6 (1.20%) MFC
Miscellaneous
1 76 (15.14%) Life Science
2 71 (14.14%) Onboarding
3 46 (9.16%) Algorithms
4 37 (7.37%) Management Information System
5 28 (5.58%) Product Ownership
6 26 (5.18%) Virtual Team
7 22 (4.38%) IoT
8 21 (4.18%) Self-Motivation
9 14 (2.79%) Data Structures
10 12 (2.39%) Legacy Systems
11 11 (2.19%) Enterprise Software
12 10 (1.99%) Embedded Systems
13 9 (1.79%) e-Learning
14 7 (1.39%) Smart Meter
15 6 (1.20%) Industrial Internet of Things
15 6 (1.20%) Raspberry Pi
15 6 (1.20%) Renewable Energy
16 5 (1.00%) Greenfield Project
16 5 (1.00%) Linux Command Line
16 5 (1.00%) Operational Technology
Operating Systems
1 56 (11.16%) Linux
2 42 (8.37%) Windows
3 16 (3.19%) Unix
4 7 (1.39%) Windows Server
5 5 (1.00%) Android
6 3 (0.60%) Windows 10
7 2 (0.40%) Apple iOS
7 2 (0.40%) Embedded Linux
8 1 (0.20%) CentOS
8 1 (0.20%) Mac OS
8 1 (0.20%) Red Hat Enterprise Linux
8 1 (0.20%) Ubuntu
8 1 (0.20%) VMS
8 1 (0.20%) VxWorks
8 1 (0.20%) Windows Server 2012
8 1 (0.20%) Windows Server 2019
8 1 (0.20%) zOS
Processes & Methodologies
1 172 (34.26%) Problem-Solving
2 171 (34.06%) Agile
3 140 (27.89%) Mathematics
4 98 (19.52%) Software Engineering
5 97 (19.32%) Statistics
6 89 (17.73%) Artificial Intelligence
7 88 (17.53%) Creative Thinking
8 82 (16.33%) Collaborative Working
9 78 (15.54%) Project Management
10 71 (14.14%) Biotechnology
10 71 (14.14%) Line Management
11 60 (11.95%) Decision-Making
12 51 (10.16%) Data Management
12 51 (10.16%) Propensity Modelling
13 49 (9.76%) Physics
14 48 (9.56%) ERP
14 48 (9.56%) Immunology
15 45 (8.96%) Time Management
16 43 (8.57%) Machine Learning
17 42 (8.37%) SDLC
Programming Languages
1 153 (30.48%) JavaScript
2 125 (24.90%) C#
3 96 (19.12%) Python
4 83 (16.53%) SQL
5 77 (15.34%) C++
6 74 (14.74%) TypeScript
7 70 (13.94%) SAS Macro
8 55 (10.96%) C
9 39 (7.77%) PHP
10 34 (6.77%) Java
11 22 (4.38%) VB.NET
12 19 (3.78%) Fortran
13 18 (3.59%) Bash
14 14 (2.79%) Go
14 14 (2.79%) R
15 13 (2.59%) PowerShell
16 7 (1.39%) MATLAB
17 6 (1.20%) T-SQL
18 5 (1.00%) Perl
19 4 (0.80%) Shell Script
Qualifications
1 468 (93.23%) Degree
2 206 (41.04%) Computer Science Degree
3 65 (12.95%) Security Cleared
4 50 (9.96%) Master's Degree
5 31 (6.18%) Numerate Degree
6 27 (5.38%) SC Cleared
7 25 (4.98%) PhD
8 19 (3.78%) HNC
9 10 (1.99%) CISA
9 10 (1.99%) CRISC
10 8 (1.59%) Cisco Certification
11 7 (1.39%) DV Cleared
11 7 (1.39%) TOGAF Certification
12 6 (1.20%) CISSP
13 5 (1.00%) CCNA
13 5 (1.00%) DBS Check
14 4 (0.80%) BPSS Clearance
14 4 (0.80%) Microsoft Certification
14 4 (0.80%) Postgraduate
15 3 (0.60%) PMP
Quality Assurance & Compliance
1 80 (15.94%) QA
2 70 (13.94%) CDISC
3 21 (4.18%) WCAG
4 18 (3.59%) GDPR
5 15 (2.99%) ISO/IEC 27001
6 10 (1.99%) GRC
6 10 (1.99%) NIST
6 10 (1.99%) Sarbanes-Oxley
7 9 (1.79%) Data Quality
7 9 (1.79%) HIPAA
8 7 (1.39%) Accessibility
9 4 (0.80%) PCI DSS
10 3 (0.60%) ISO/IEC 27002 (supersedes ISO/IEC 17799)
11 1 (0.20%) Cyber Essentials
11 1 (0.20%) ECSS
11 1 (0.20%) FISMA
11 1 (0.20%) ISO 22301
11 1 (0.20%) ISO/IEC 27005
11 1 (0.20%) MISRA
11 1 (0.20%) PMO
System Software
1 83 (16.53%) Docker
2 14 (2.79%) Active Directory
3 8 (1.59%) VMware Infrastructure
4 4 (0.80%) Firmware
5 2 (0.40%) Virtual Machines
5 2 (0.40%) vSphere
6 1 (0.20%) BitLocker
6 1 (0.20%) Hyper-V
6 1 (0.20%) KVM
6 1 (0.20%) VMware ESXi
Systems Management
1 74 (14.74%) Kubernetes
2 7 (1.39%) Terraform
3 5 (1.00%) Ansible
4 3 (0.60%) Progress Chef
4 3 (0.60%) Single Sign-On
5 2 (0.40%) Jamf Pro
5 2 (0.40%) Microsoft Intune
5 2 (0.40%) Nessus
5 2 (0.40%) SCCM
6 1 (0.20%) Docker Swarm
6 1 (0.20%) Grafana
6 1 (0.20%) Mesos
6 1 (0.20%) Oozie
6 1 (0.20%) Puppet
6 1 (0.20%) SolarWinds Orion
6 1 (0.20%) WSUS
Vendors
1 39 (7.77%) Microsoft
2 19 (3.78%) Salesforce
3 18 (3.59%) Oracle
4 16 (3.19%) NEC
5 15 (2.99%) SAP
6 9 (1.79%) Cadence
6 9 (1.79%) Databricks
7 8 (1.59%) VMware
8 6 (1.20%) Google
9 5 (1.00%) Adobe
9 5 (1.00%) Atlassian
9 5 (1.00%) PTC
10 4 (0.80%) Foundry
11 3 (0.60%) CA Agile Central
11 3 (0.60%) NetApp
11 3 (0.60%) ServiceNow
11 3 (0.60%) UiPath
12 2 (0.40%) MuleSoft
12 2 (0.40%) QinetiQ
12 2 (0.40%) Sun