Developer Contracts with Hybrid/Remote/WFH Options

Developer
UK > Work from Home

The median Developer daily rate for remote or hybrid work is £525, according to job vacancies posted in the 6 months leading up to 26 June 2025.

The table below provides contractor rate benchmarking and summary statistics, comparing them to the same period in the previous two years.

6 months to
26 Jun 2025
Same period 2024 Same period 2023
Rank 6 3 5
Rank change year-on-year -3 +2 -3
Contract jobs requiring a Developer 1,666 2,643 4,330
As % of all contract jobs with a WFH option 16.93% 17.99% 18.20%
As % of the Job Titles category 18.02% 19.21% 19.13%
Number of daily rates quoted 1,222 1,945 3,290
10th Percentile £351 £327 £374
25th Percentile £413 £415 £425
Median daily rate (50th Percentile) £525 £500 £525
Median % change year-on-year +5.00% -4.76% -
75th Percentile £650 £628 £650
90th Percentile £838 £775 £775
UK median daily rate £505 £500 £550
% change year-on-year +1.00% -9.09% -
Number of hourly rates quoted 13 18 48
10th Percentile £26.79 £23.09 £35.70
25th Percentile £32.94 £35.00 £55.94
Median hourly rate £34.48 £45.50 £66.25
Median % change year-on-year -24.22% -31.32% +20.45%
75th Percentile £65.00 £65.00 £75.00
90th Percentile £75.00 £75.50 £78.00
UK median hourly rate £40.30 £65.00 £61.50
% change year-on-year -38.01% +5.69% +11.82%

All Contract IT Job Vacancies
Work from Home

For comparison with the information above, the following table provides summary statistics for all contract IT job vacancies with WFH or hybrid options. Most job vacancies include a discernible job title that can be normalized. As such, the figures in the second row provide an indication of the number of contract jobs in our overall sample.

Contract vacancies in Work from Home with a recognized job title 9,247 13,756 22,629
% of contract IT jobs with a recognized job title 93.98% 93.64% 95.13%
Number of daily rates quoted 6,219 9,270 16,031
10th Percentile £325 £325 £356
25th Percentile £413 £425 £440
Median daily rate (50th Percentile) £513 £525 £538
Median % change year-on-year -2.38% -2.33% +2.38%
75th Percentile £638 £634 £650
90th Percentile £763 £750 £750
UK median daily rate £500 £525 £538
% change year-on-year -4.76% -2.33% +1.42%
Number of hourly rates quoted 250 548 533
10th Percentile £13.99 £14.26 £16.98
25th Percentile £16.13 £22.50 £24.73
Median hourly rate £34.48 £43.00 £50.00
Median % change year-on-year -19.81% -14.00% +25.00%
75th Percentile £65.00 £65.00 £66.00
90th Percentile £75.00 £75.00 £75.00
UK median hourly rate £26.39 £37.50 £43.00
% change year-on-year -29.64% -12.79% +68.63%

Developer
Trend for Jobs with a WFH Option

Job vacancies with remote working options which featured Developer in the job title as a proportion of all IT jobs advertised.
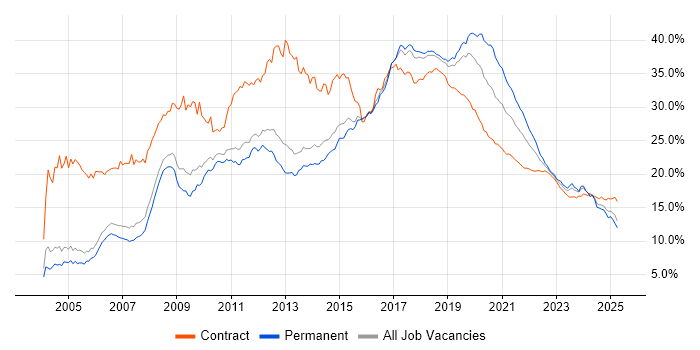
Developer trend for jobs with Hybrid/Remote/WFH options

Developer
Daily Rate Trend for Jobs with a WFH Option

3-month moving average daily rate quoted in job vacancies with remote working options citing Developer.

Developer daily rate for jobs with a WFH option

Developer
Daily Rate Histogram for Jobs with a WFH Option

Daily rate distribution for jobs with remote working options citing Developer over the 6 months to 26 June 2025.

Developer daily rate histogram for jobs with a WFH option

Developer
Hourly Rate Trend for Jobs with a WFH Option

3-month moving average hourly rate quoted in job vacancies with remote working options citing Developer.

Developer hourly rate for jobs with a WFH option

Developer
Hourly Rate Histogram for Jobs with a WFH Option

Hourly rate distribution for jobs with remote working options citing Developer over the 6 months to 26 June 2025.

Developer hourly rate histogram for jobs with a WFH option

Developer Skill Set
Top 30 Co-occurring Skills and Capabilities in Job Vacancies with WFH Options

For the 6 months to 26 June 2025, Developer contract job roles required the following skills and capabilities in order of popularity. The figures indicate the absolute number co-occurrences and as a proportion of all contract jobs with a WFH option featuring Developer in the job title.

1 604 (36.25%) Agile
2 463 (27.79%) AWS
3 459 (27.55%) Java
4 448 (26.89%) SQL
5 443 (26.59%) Python
6 391 (23.47%) Finance
7 389 (23.35%) JavaScript
8 378 (22.69%) Social Skills
9 351 (21.07%) Azure
10 338 (20.29%) React
11 305 (18.31%) Problem-Solving
12 303 (18.19%) DevOps
13 297 (17.83%) TypeScript
14 280 (16.81%) CI/CD
15 264 (15.85%) C#
16 246 (14.77%) Banking
17 241 (14.47%) Full-Stack Development
18 231 (13.87%) Software Engineering
19 227 (13.63%) .NET
20 213 (12.79%) PostgreSQL
21 209 (12.55%) Node.js
22 202 (12.12%) AngularJS
23 200 (12.00%) Docker
24 188 (11.28%) Git
25 187 (11.22%) Front Office
26 182 (10.92%) Analytical Skills
27 180 (10.80%) Security Cleared
28 169 (10.14%) TDD
29 166 (9.96%) Microservices
30 156 (9.36%) GCP

Developer Skill Set
Co-occurring Skills and Capabilities with WFH Options by Category

The follow tables expand on the table above by listing co-occurrences grouped by category. The same employment type, locality and period is covered with up to 20 co-occurrences shown in each of the following categories:

Application Platforms
1 47 (2.82%) Apache Airflow
2 40 (2.40%) SharePoint
3 29 (1.74%) Confluence
4 26 (1.56%) Apache
5 24 (1.44%) CMS
6 16 (0.96%) Moodle
7 13 (0.78%) Oracle Coherence
8 12 (0.72%) Apache Spark
9 10 (0.60%) Headless CMS
9 10 (0.60%) WordPress
10 9 (0.54%) JBoss
10 9 (0.54%) Tomcat
11 8 (0.48%) GemFire
12 7 (0.42%) Anypoint
12 7 (0.42%) Documentum
12 7 (0.42%) FileNet
13 6 (0.36%) Oracle Workflow
13 6 (0.36%) Umbraco
13 6 (0.36%) WebLogic
14 5 (0.30%) MQSeries
Applications
1 27 (1.62%) Microsoft Excel
2 8 (0.48%) Chatbot
2 8 (0.48%) Microsoft Office
3 2 (0.12%) Adobe Creative Suite
3 2 (0.12%) Microsoft PowerPoint
3 2 (0.12%) Spreadsheet
3 2 (0.12%) Trello
4 1 (0.060%) Sketch
Business Applications
1 23 (1.38%) Dynamics CRM
2 9 (0.54%) Oracle EBS
3 8 (0.48%) Aladdin
3 8 (0.48%) Endur
3 8 (0.48%) SAP S/4HANA
4 5 (0.30%) Oracle Assets
4 5 (0.30%) Oracle Payables
5 4 (0.24%) IBM Planning Analytics
5 4 (0.24%) Oracle Cash Management
5 4 (0.24%) Oracle General Ledger
5 4 (0.24%) Oracle Receivables
6 3 (0.18%) Oracle Payroll
6 3 (0.18%) SAP HR
6 3 (0.18%) Shopify
6 3 (0.18%) VisionPLUS
7 2 (0.12%) BASE24
7 2 (0.12%) Misys Midas
7 2 (0.12%) Oracle EBS R12
7 2 (0.12%) Payment Gateway
7 2 (0.12%) PeopleSoft Financials
Cloud Services
1 463 (27.79%) AWS
2 351 (21.07%) Azure
3 156 (9.36%) GCP
4 113 (6.78%) Power Platform
4 113 (6.78%) Serverless
5 110 (6.60%) Azure DevOps
6 64 (3.84%) GitHub
7 61 (3.66%) AWS Lambda
8 53 (3.18%) PowerApps
9 51 (3.06%) Amazon S3
10 50 (3.00%) dbt
11 47 (2.82%) Dynamics 365
12 43 (2.58%) Amazon SQS
13 40 (2.40%) Power Automate
14 29 (1.74%) Amazon EC2
15 27 (1.62%) AWS CloudFormation
16 26 (1.56%) Azure Service Bus
16 26 (1.56%) GitHub Actions
17 24 (1.44%) Azure Logic Apps
17 24 (1.44%) SaaS
Communications & Networking
1 28 (1.68%) HTTP
2 7 (0.42%) TCP/IP
3 6 (0.36%) FIX Connectivity
4 5 (0.30%) DNS
5 3 (0.18%) HTTPS
5 3 (0.18%) Radio Access Network
6 2 (0.12%) 3GPP
6 2 (0.12%) 4G
6 2 (0.12%) 5G
6 2 (0.12%) ATM
6 2 (0.12%) Kerberos
6 2 (0.12%) MQTT
6 2 (0.12%) SAN
6 2 (0.12%) VPN
6 2 (0.12%) Wireless
7 1 (0.060%) Ethernet VPN
7 1 (0.060%) LAN
7 1 (0.060%) POP3
7 1 (0.060%) SMS
7 1 (0.060%) WAN
Database & Business Intelligence
1 213 (12.79%) PostgreSQL
2 112 (6.72%) Relational Database
3 96 (5.76%) MongoDB
4 85 (5.10%) SQL Server
5 56 (3.36%) Power BI
6 54 (3.24%) MySQL
7 50 (3.00%) DB2
7 50 (3.00%) NoSQL
8 48 (2.88%) Amazon Athena
9 42 (2.52%) Apache Arrow
9 42 (2.52%) Apache Iceberg
9 42 (2.52%) Dremio
10 36 (2.16%) DynamoDB
11 34 (2.04%) Redis
12 25 (1.50%) Amazon RDS
13 23 (1.38%) Data Warehouse
14 18 (1.08%) Azure SQL Database
14 18 (1.08%) GIS
14 18 (1.08%) KDB
15 17 (1.02%) Oracle Database
Development Applications
1 188 (11.28%) Git
2 106 (6.36%) Jenkins
3 101 (6.06%) JIRA
4 96 (5.76%) JUnit
5 47 (2.82%) GitLab
6 46 (2.76%) Maven
7 29 (1.74%) Mockito
8 28 (1.68%) Cypress.io
9 27 (1.62%) SonarQube
10 24 (1.44%) Gradle
11 20 (1.20%) Bitbucket
11 20 (1.20%) Visual Studio
12 18 (1.08%) Cucumber
13 17 (1.02%) Selenium
14 16 (0.96%) Subversion
15 15 (0.90%) Liquibase
16 13 (0.78%) webpack
17 12 (0.72%) IntelliJ
18 11 (0.66%) Postman
19 10 (0.60%) Visual Studio Code
General
1 391 (23.47%) Finance
2 378 (22.69%) Social Skills
3 246 (14.77%) Banking
4 187 (11.22%) Front Office
5 182 (10.92%) Analytical Skills
6 133 (7.98%) Investment Banking
7 117 (7.02%) Public Sector
8 28 (1.68%) Marketing
9 27 (1.62%) Inclusion and Diversity
10 23 (1.38%) Manufacturing
10 23 (1.38%) Telecoms
11 22 (1.32%) Retail
12 16 (0.96%) Law
13 13 (0.78%) Organisational Skills
13 13 (0.78%) Pharmaceutical
14 12 (0.72%) Local Government
15 11 (0.66%) Financial Institution
16 10 (0.60%) Electronics
17 9 (0.54%) Documentation Skills
18 8 (0.48%) Legal
Libraries, Frameworks & Software Standards
1 338 (20.29%) React
2 227 (13.63%) .NET
3 209 (12.55%) Node.js
4 202 (12.12%) AngularJS
5 156 (9.36%) CSS
6 153 (9.18%) HTML
7 151 (9.06%) REST
8 150 (9.00%) Kafka
9 145 (8.70%) Spring
10 138 (8.28%) RESTful
11 111 (6.66%) Redux
12 95 (5.70%) Spring Boot
13 92 (5.52%) Vue
14 82 (4.92%) Web Services
15 75 (4.50%) .NET Core
16 61 (3.66%) SOAP
17 60 (3.60%) XML
18 59 (3.54%) FastAPI
19 55 (3.30%) Django
20 52 (3.12%) Next.js
Miscellaneous
1 127 (7.62%) Fixed Income
2 113 (6.78%) Equities
3 102 (6.12%) Foreign Exchange (FX)
4 71 (4.26%) Data Structures
5 50 (3.00%) Mobile App
6 47 (2.82%) Derivative
7 44 (2.64%) Greenfield Project
8 40 (2.40%) Product Ownership
9 39 (2.34%) Enterprise Software
10 38 (2.28%) Cloud Native
11 35 (2.10%) Algorithms
12 32 (1.92%) Hedge funds
13 30 (1.80%) Distributed Systems
14 29 (1.74%) Legacy Applications
15 27 (1.62%) Virtual Team
16 26 (1.56%) Onboarding
17 20 (1.20%) Legacy Systems
18 18 (1.08%) Self-Motivation
19 15 (0.90%) Equity Derivative
19 15 (0.90%) Low-Code
Operating Systems
1 136 (8.16%) Linux
2 42 (2.52%) Windows
3 35 (2.10%) Android
4 32 (1.92%) Unix
5 15 (0.90%) Apple iOS
6 9 (0.54%) Red Hat Enterprise Linux
7 7 (0.42%) Windows Server
8 2 (0.12%) Debian
8 2 (0.12%) Ubuntu
8 2 (0.12%) Windows Server 2016
9 1 (0.060%) CentOS
9 1 (0.060%) Embedded Linux
9 1 (0.060%) Mac OS X
9 1 (0.060%) OpenVMS
9 1 (0.060%) VMS
Processes & Methodologies
1 604 (36.25%) Agile
2 305 (18.31%) Problem-Solving
3 303 (18.19%) DevOps
4 280 (16.81%) CI/CD
5 241 (14.47%) Full-Stack Development
6 231 (13.87%) Software Engineering
7 169 (10.14%) TDD
8 166 (9.96%) Microservices
9 149 (8.94%) User Experience
10 128 (7.68%) Fintech
11 121 (7.26%) Scrum
12 120 (7.20%) Investment Management
13 119 (7.14%) Containerisation
14 118 (7.08%) SDLC
15 112 (6.72%) Asset Management
16 108 (6.48%) Front End Development
17 104 (6.24%) Artificial Intelligence
18 101 (6.06%) Test Automation
19 99 (5.94%) Analytics
20 87 (5.22%) Continuous Improvement
Programming Languages
1 459 (27.55%) Java
2 448 (26.89%) SQL
3 443 (26.59%) Python
4 389 (23.35%) JavaScript
5 297 (17.83%) TypeScript
6 264 (15.85%) C#
7 66 (3.96%) C++
8 49 (2.94%) Shell Script
9 45 (2.70%) Go
9 45 (2.70%) PHP
10 42 (2.52%) PL/SQL
11 32 (1.92%) Kotlin
12 30 (1.80%) Apex Code
13 28 (1.68%) ABAP
14 26 (1.56%) PowerShell
15 24 (1.44%) Ruby
16 17 (1.02%) T-SQL
17 13 (0.78%) Bash
17 13 (0.78%) Scala
17 13 (0.78%) VBA
Qualifications
1 180 (10.80%) Security Cleared
2 153 (9.18%) SC Cleared
3 96 (5.76%) Degree
4 38 (2.28%) Computer Science Degree
5 30 (1.80%) BPSS Clearance
6 23 (1.38%) Numerate Degree
7 14 (0.84%) AWS Certification
8 10 (0.60%) Master's Degree
9 8 (0.48%) DV Cleared
10 6 (0.36%) PhD
11 4 (0.24%) Azure Certification
11 4 (0.24%) Microsoft Certification
12 3 (0.18%) ITIL Foundation Certificate
12 3 (0.18%) SAP Certification
13 2 (0.12%) AWS Certified Solutions Architect
13 2 (0.12%) DBS Check
13 2 (0.12%) OCP
13 2 (0.12%) Oracle Certification
13 2 (0.12%) Sun Certification
14 1 (0.060%) AWS Certified Developer
Quality Assurance & Compliance
1 54 (3.24%) Accessibility
2 51 (3.06%) QA
3 11 (0.66%) Data Quality
4 10 (0.60%) HL7
5 7 (0.42%) Disclosure Scotland
6 6 (0.36%) ISO/IEC 27001
6 6 (0.36%) WCAG
7 5 (0.30%) GDPR
7 5 (0.30%) SLA
8 2 (0.12%) COBIT
8 2 (0.12%) NIST
8 2 (0.12%) PERC
9 1 (0.060%) Basel II
9 1 (0.060%) EMIR
9 1 (0.060%) GRC
9 1 (0.060%) GxP
9 1 (0.060%) MiFID
9 1 (0.060%) NCSC
System Software
1 200 (12.00%) Docker
2 22 (1.32%) Active Directory
3 8 (0.48%) GridGain
4 3 (0.18%) HDFS
4 3 (0.18%) Postfix
4 3 (0.18%) Virtual Machines
5 2 (0.12%) Apache ZooKeeper
6 1 (0.060%) OpenAM
6 1 (0.060%) OpenDJ
6 1 (0.060%) OpenIDM
Systems Management
1 150 (9.00%) Kubernetes
2 67 (4.02%) Terraform
3 36 (2.16%) Ansible
4 22 (1.32%) Grafana
5 20 (1.20%) Prometheus
6 12 (0.72%) Single Sign-On
7 5 (0.30%) Kibana
8 3 (0.18%) CloudHub
9 2 (0.12%) Control-M
9 2 (0.12%) Istio
9 2 (0.12%) ITRS Geneos
9 2 (0.12%) MIIS
9 2 (0.12%) Progress Chef
9 2 (0.12%) Puppet
10 1 (0.060%) Demisto
10 1 (0.060%) Fluentd
10 1 (0.060%) Opsgenie
10 1 (0.060%) Oracle Enterprise Manager
10 1 (0.060%) Podman
10 1 (0.060%) SCOM
Vendors
1 140 (8.40%) Microsoft
2 137 (8.22%) Oracle
3 59 (3.54%) SAP
4 57 (3.42%) Salesforce
5 47 (2.82%) Sybase
6 42 (2.52%) ServiceNow
7 36 (2.16%) Google
8 16 (0.96%) OutSystems
9 14 (0.84%) IBM
10 13 (0.78%) MuleSoft
10 13 (0.78%) Splunk
11 12 (0.72%) UiPath
12 10 (0.60%) Siebel
12 10 (0.60%) Virgin Media
13 8 (0.48%) Ariba
13 8 (0.48%) Atlassian
13 8 (0.48%) Autodesk
13 8 (0.48%) CA Agile Central
13 8 (0.48%) Conga
14 7 (0.42%) Solace