Law Contracts with Hybrid/Remote/WFH Options

Law
UK > Work from Home

The table below looks at the prevalence of the term Law in remote or hybrid contract work. Included is a benchmarking guide to the contractor rates offered in vacancies that cited Law over the 6 months leading up to 14 August 2025, comparing them to the same period in the previous two years.

6 months to
14 Aug 2025
Same period 2024 Same period 2023
Rank 176 231 195
Rank change year-on-year +55 -36 +96
Contract jobs citing Law 138 100 283
As % of all contract jobs with a WFH option 1.37% 0.77% 1.30%
As % of the General category 2.17% 1.30% 2.21%
Number of daily rates quoted 57 56 212
10th Percentile £354 £363 £255
25th Percentile £375 £425 £400
Median daily rate (50th Percentile) £500 £550 £538
Median % change year-on-year -9.09% +2.33% +1.42%
75th Percentile £600 £659 £638
90th Percentile £750 £738 £714
UK median daily rate £500 £550 £538
% change year-on-year -9.09% +2.33% +2.38%
Number of hourly rates quoted 17 1 6
10th Percentile £26.75 - £19.92
25th Percentile £27.28 £44.83 £23.67
Median hourly rate £55.00 £46.56 £26.25
Median % change year-on-year +18.14% +77.35% -50.00%
75th Percentile £58.75 £48.28 £54.06
90th Percentile £62.75 - £62.75
UK median hourly rate £40.46 £26.97 £18.50
% change year-on-year +50.02% +45.78% -2.63%

All General Skills
Work from Home

Law falls under the General Skills category. For comparison with the information above, the following table provides summary statistics for all contract job vacancies with remote or hybrid options requiring common skills.

Contract vacancies with a requirement for common skills 6,368 7,687 12,818
As % of all contract jobs with a WFH option 63.30% 58.99% 58.72%
Number of daily rates quoted 4,178 4,961 8,935
10th Percentile £325 £325 £350
25th Percentile £413 £425 £450
Median daily rate (50th Percentile) £513 £533 £550
Median % change year-on-year -3.85% -3.09% -
75th Percentile £638 £650 £675
90th Percentile £788 £800 £775
UK median daily rate £500 £525 £550
% change year-on-year -4.76% -4.55% -
Number of hourly rates quoted 222 315 294
10th Percentile £14.00 £17.25 £17.75
25th Percentile £17.99 £30.06 £25.18
Median hourly rate £34.24 £43.00 £45.00
Median % change year-on-year -20.37% -4.44% +19.13%
75th Percentile £63.75 £57.50 £64.59
90th Percentile £71.14 £72.50 £75.00
UK median hourly rate £25.15 £38.12 £27.50
% change year-on-year -34.02% +38.62% +13.11%

Law
Trend for Jobs with a WFH Option

Job vacancies with remote working options citing Law as a proportion of all IT jobs advertised.
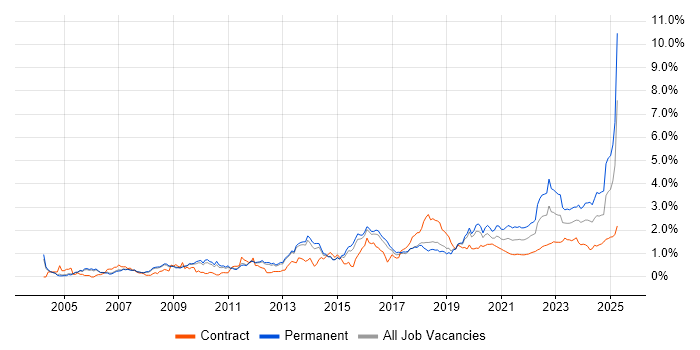
Law trend for jobs with Hybrid/Remote/WFH options

Law
Daily Rate Trend for Jobs with a WFH Option

3-month moving average daily rate quoted in job vacancies with remote working options citing Law.

Law daily rate for jobs with a WFH option

Law
Daily Rate Histogram for Jobs with a WFH Option

Daily rate distribution for jobs with remote working options citing Law over the 6 months to 14 August 2025.

Law daily rate histogram for jobs with a WFH option

Law
Hourly Rate Trend for Jobs with a WFH Option

3-month moving average hourly rate quoted in job vacancies with remote working options citing Law.

Law hourly rate for jobs with a WFH option

Law
Hourly Rate Histogram for Jobs with a WFH Option

Hourly rate distribution for jobs with remote working options citing Law over the 6 months to 14 August 2025.

Law hourly rate histogram for jobs with a WFH option

Law
Co-occurring Skills and Capabilities with WFH Options by Category

The follow tables expand on the table above by listing co-occurrences grouped by category. The same employment type, locality and period is covered with up to 20 co-occurrences shown in each of the following categories:

Application Platforms
1 3 (2.17%) JBoss
2 2 (1.45%) Apache
2 2 (1.45%) Apache Spark
2 2 (1.45%) Confluence
2 2 (1.45%) Microsoft Exchange
2 2 (1.45%) Oracle SOA Suite
3 1 (0.72%) Anypoint
Applications
1 3 (2.17%) AutoCAD
1 3 (2.17%) Revit
2 2 (1.45%) Microsoft Excel
2 2 (1.45%) Microsoft Office
3 1 (0.72%) MS Visio
3 1 (0.72%) Spreadsheet
3 1 (0.72%) Trello
Business Applications
1 2 (1.45%) Oracle Financials
1 2 (1.45%) SAP S/4HANA
2 1 (0.72%) Oracle Procure-to-Pay
2 1 (0.72%) Primavera
2 1 (0.72%) SAP CO
2 1 (0.72%) SAP EWM
2 1 (0.72%) SAP FI
2 1 (0.72%) SAP FI/CO
2 1 (0.72%) SAP PP
2 1 (0.72%) SAP PS
Cloud Services
1 24 (17.39%) Azure
2 12 (8.70%) AWS
3 5 (3.62%) Azure Logic Apps
4 4 (2.90%) Azure API Management
4 4 (2.90%) Azure DevOps
4 4 (2.90%) Azure Key Vault
4 4 (2.90%) Azure Monitor
4 4 (2.90%) Azure Service Bus
4 4 (2.90%) Azure Storage
4 4 (2.90%) Entra ID
4 4 (2.90%) Microsoft 365
5 3 (2.17%) SuccessFactors
6 2 (1.45%) Azure Stack
6 2 (1.45%) Boomi
6 2 (1.45%) Mimecast
6 2 (1.45%) OneDrive
6 2 (1.45%) Power Platform
6 2 (1.45%) SaaS
6 2 (1.45%) Tessian
7 1 (0.72%) PowerApps
Communications & Networking
1 8 (5.80%) Firewall
2 7 (5.07%) Cisco Nexus
3 6 (4.35%) LAN
3 6 (4.35%) SD-WAN
3 6 (4.35%) VPN
3 6 (4.35%) WAN
4 5 (3.62%) MPLS
4 5 (3.62%) Network Security
5 2 (1.45%) DMARC
5 2 (1.45%) Internet
5 2 (1.45%) SMTP
6 1 (0.72%) Cisco ASA
6 1 (0.72%) Cisco Firepower
6 1 (0.72%) Ethernet
6 1 (0.72%) TCP/IP
Database & Business Intelligence
1 4 (2.90%) PostgreSQL
2 3 (2.17%) Crystal Reports
3 2 (1.45%) Apache Hive
3 2 (1.45%) Big Data
3 2 (1.45%) HBase
3 2 (1.45%) Impala
3 2 (1.45%) NoSQL
3 2 (1.45%) Power BI
3 2 (1.45%) SQL Server
4 1 (0.72%) Data Lake
4 1 (0.72%) Data Warehouse
4 1 (0.72%) DB2
4 1 (0.72%) Metadata
4 1 (0.72%) MongoDB
4 1 (0.72%) Oracle BI Publisher
4 1 (0.72%) Oracle Reports
4 1 (0.72%) SQL Server Reporting Services
4 1 (0.72%) Tableau
Development Applications
1 7 (5.07%) JIRA
2 5 (3.62%) Cucumber
2 5 (3.62%) GitLab
2 5 (3.62%) Jenkins
2 5 (3.62%) REST Assured
2 5 (3.62%) Selenium
2 5 (3.62%) SonarQube
3 1 (0.72%) Eclipse
3 1 (0.72%) Oracle Forms
3 1 (0.72%) Toad
3 1 (0.72%) Visual Studio
General
1 41 (29.71%) Finance
2 36 (26.09%) Social Skills
3 26 (18.84%) Public Sector
4 25 (18.12%) Legal
5 16 (11.59%) Local Government
6 15 (10.87%) Inclusion and Diversity
7 12 (8.70%) Analytical Skills
7 12 (8.70%) Police
8 4 (2.90%) Retail
9 3 (2.17%) Organisational Skills
10 2 (1.45%) Financial Institution
10 2 (1.45%) Manufacturing
10 2 (1.45%) Pharmaceutical
10 2 (1.45%) Telecoms
11 1 (0.72%) Automotive
11 1 (0.72%) Electronics
11 1 (0.72%) French Language
11 1 (0.72%) German Language
11 1 (0.72%) Italian Language
11 1 (0.72%) Military
Job Titles
1 16 (11.59%) Senior
2 13 (9.42%) Analyst
2 13 (9.42%) Consultant
2 13 (9.42%) Developer
3 10 (7.25%) Architect
3 10 (7.25%) Lead
4 8 (5.80%) Business Analyst
5 7 (5.07%) Project Manager
6 6 (4.35%) Integration Developer
6 6 (4.35%) IT Support
6 6 (4.35%) Network Engineer
7 5 (3.62%) 1st Line Support
7 5 (3.62%) Cloud Engineer
7 5 (3.62%) Migration Engineer
7 5 (3.62%) Software Engineer
8 4 (2.90%) Azure Engineer
8 4 (2.90%) Java Engineer
8 4 (2.90%) Java Software Engineer
8 4 (2.90%) SC Cleared Software Engineer
9 3 (2.17%) UI/UX Developer
Libraries, Frameworks & Software Standards
1 9 (6.52%) ARM Templates
2 6 (4.35%) REST
3 5 (3.62%) Java EE
4 4 (2.90%) ADO
4 4 (2.90%) Middleware
4 4 (2.90%) YAML
5 3 (2.17%) Oracle Fusion
6 2 (1.45%) Apache Avro
6 2 (1.45%) JSON
6 2 (1.45%) Kafka
6 2 (1.45%) Web Services
7 1 (0.72%) BAPI
7 1 (0.72%) DCOM
7 1 (0.72%) Flash
7 1 (0.72%) React
7 1 (0.72%) React Native
7 1 (0.72%) SAP Fiori
7 1 (0.72%) SAP Smart Forms
7 1 (0.72%) SOAP
7 1 (0.72%) Web Dynpro
Miscellaneous
1 5 (3.62%) Product Ownership
1 5 (3.62%) Security Posture
2 3 (2.17%) Data Structures
2 3 (2.17%) Freedom of Information Act
2 3 (2.17%) Management Information System
2 3 (2.17%) Mobile App
3 2 (1.45%) Freedom of Information
3 2 (1.45%) Greenfield Project
3 2 (1.45%) Hybrid Cloud
3 2 (1.45%) Legacy Code
3 2 (1.45%) NHS
3 2 (1.45%) Self-Motivation
4 1 (0.72%) Blockchain
4 1 (0.72%) Cyber Kill Chain
4 1 (0.72%) Data Protection Act
4 1 (0.72%) FPGA
4 1 (0.72%) Housing Association
4 1 (0.72%) Onboarding
4 1 (0.72%) VHDL
4 1 (0.72%) Web3
Operating Systems
1 16 (11.59%) Linux
2 9 (6.52%) Windows
3 5 (3.62%) Windows Server
4 4 (2.90%) Amazon Linux
5 2 (1.45%) Unix
6 1 (0.72%) Ubuntu
Processes & Methodologies
1 20 (14.49%) Change Management
2 14 (10.14%) Mentoring
3 13 (9.42%) Problem-Solving
4 12 (8.70%) Data Protection
5 11 (7.97%) Continuous Improvement
5 11 (7.97%) DevOps
5 11 (7.97%) ITIL
5 11 (7.97%) Risk Management
5 11 (7.97%) Stakeholder Management
6 10 (7.25%) Continuous Integration
6 10 (7.25%) Problem Management
6 10 (7.25%) Project Management
6 10 (7.25%) Stakeholder Engagement
7 9 (6.52%) Infrastructure as Code
7 9 (6.52%) Process Improvement
8 8 (5.80%) Customer Service
8 8 (5.80%) Test Automation
9 7 (5.07%) API Management
9 7 (5.07%) Project Delivery
9 7 (5.07%) User Experience
Programming Languages
1 10 (7.25%) SQL
2 7 (5.07%) Java
2 7 (5.07%) PowerShell
2 7 (5.07%) Python
3 4 (2.90%) Bash
3 4 (2.90%) Bicep
4 3 (2.17%) C++
5 2 (1.45%) C
5 2 (1.45%) JavaScript
6 1 (0.72%) ABAP
6 1 (0.72%) Ada
6 1 (0.72%) Apex Code
6 1 (0.72%) C#
6 1 (0.72%) Shell Script
6 1 (0.72%) X++
Qualifications
1 25 (18.12%) Security Cleared
2 22 (15.94%) SC Cleared
3 10 (7.25%) Degree
4 4 (2.90%) DV Cleared
5 2 (1.45%) Azure Certification
5 2 (1.45%) BPSS Clearance
5 2 (1.45%) CISSP
6 1 (0.72%) (ISC)2 CCSP
6 1 (0.72%) CCSP
6 1 (0.72%) CISA
6 1 (0.72%) Cisco Certification
6 1 (0.72%) CISM
6 1 (0.72%) CISMP
6 1 (0.72%) CompTIA CySA+
6 1 (0.72%) CompTIA Security+
6 1 (0.72%) Computer Science Degree
6 1 (0.72%) GSEC
6 1 (0.72%) ISO 27001 Lead Auditor
6 1 (0.72%) Microsoft Certification
Quality Assurance & Compliance
1 6 (4.35%) HL7
2 5 (3.62%) NIST
3 4 (2.90%) GDPR
4 3 (2.17%) ISO/IEC 27001
5 2 (1.45%) HIPAA
5 2 (1.45%) JSP 440
5 2 (1.45%) NCSC
6 1 (0.72%) Actionable Recommendations
6 1 (0.72%) Data Quality
6 1 (0.72%) Sarbanes-Oxley
System Software
1 5 (3.62%) Active Directory
1 5 (3.62%) Docker
1 5 (3.62%) Virtual Machines
1 5 (3.62%) vSphere
2 2 (1.45%) HDFS
3 1 (0.72%) Firmware
Systems Management
1 5 (3.62%) Ansible
1 5 (3.62%) Cisco Prime
1 5 (3.62%) Docker Swarm
1 5 (3.62%) Kubernetes
1 5 (3.62%) Podman
1 5 (3.62%) Terraform
2 1 (0.72%) FortiGate
2 1 (0.72%) Microsoft Intune
2 1 (0.72%) SCOM
Vendors
1 12 (8.70%) Microsoft
2 9 (6.52%) Oracle
3 8 (5.80%) SAP
4 7 (5.07%) Cisco
4 7 (5.07%) Palo Alto
5 5 (3.62%) Aruba
5 5 (3.62%) Fortinet
5 5 (3.62%) Red Hat
5 5 (3.62%) SolarWinds
5 5 (3.62%) VMware
6 4 (2.90%) MuleSoft
7 3 (2.17%) Autodesk
7 3 (2.17%) Civica
8 2 (1.45%) CrowdStrike
8 2 (1.45%) Dell
8 2 (1.45%) ServiceNow
8 2 (1.45%) Veeam
8 2 (1.45%) Workday
9 1 (0.72%) Aderant
9 1 (0.72%) Sparx