Product Ownership Jobs with Hybrid/Remote/WFH Options

Product Ownership
UK > Work from Home

The table below looks at the prevalence of the term Product Ownership in remote or hybrid work. Included is a benchmarking guide to the salaries offered in vacancies that cited Product Ownership over the 6 months leading up to 14 June 2025, comparing them to the same period in the previous two years.

6 months to
14 Jun 2025
Same period 2024 Same period 2023
Rank 81 114 63
Rank change year-on-year +33 -51 +6
Permanent jobs citing Product Ownership 810 891 1,702
As % of all permanent jobs with a WFH option 4.16% 2.50% 4.56%
As % of the Miscellaneous category 10.01% 7.19% 11.74%
Number of salaries quoted 296 677 1,259
10th Percentile £47,365 £42,500 £45,000
25th Percentile £57,500 £50,000 £51,833
Median annual salary (50th Percentile) £71,500 £60,000 £64,811
Median % change year-on-year +19.17% -7.42% +3.70%
75th Percentile £90,822 £73,950 £81,875
90th Percentile £130,000 £92,500 £92,321
UK median annual salary £67,500 £62,500 £65,000
% change year-on-year +8.00% -3.85% +4.00%

All Generic Skills
Work from Home

Product Ownership falls under the General and Transferable Skills category. For comparison with the information above, the following table provides summary statistics for all permanent job vacancies with remote or hybrid options requiring generic IT skills.

Permanent vacancies with a requirement for generic IT skills 8,091 12,391 14,502
As % of all permanent jobs with a WFH option 41.56% 34.79% 38.89%
Number of salaries quoted 3,679 9,321 10,862
10th Percentile £31,500 £32,500 £40,000
25th Percentile £46,250 £42,860 £49,750
Median annual salary (50th Percentile) £65,000 £60,000 £65,000
Median % change year-on-year +8.33% -7.69% -
75th Percentile £85,000 £80,000 £85,977
90th Percentile £122,500 £105,000 £109,865
UK median annual salary £60,000 £55,000 £65,000
% change year-on-year +9.09% -15.38% +4.00%

Product Ownership
Trend for Jobs with a WFH Option

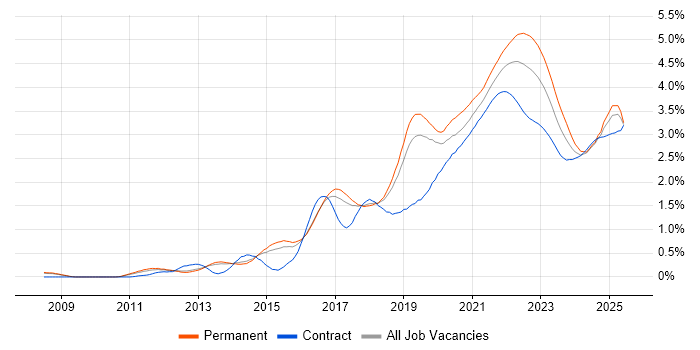
Job vacancies with remote working options citing Product Ownership as a proportion of all IT jobs advertised.

Product Ownership trend for jobs with Hybrid/Remote/WFH options

Product Ownership
Salary Trend for Jobs with a WFH Option

3-month moving average salary quoted in job vacancies with remote working options citing Product Ownership.

Product Ownership salary trend for jobs with a WFH option

Product Ownership
Salary Histogram for Jobs with a WFH Option

Salary distribution for jobs with remote working options citing Product Ownership over the 6 months to 14 June 2025.

Product Ownership salary histogram for jobs with a WFH option

Product Ownership
Co-occurring Skills and Capabilities with WFH Options by Category

The follow tables expand on the table above by listing co-occurrences grouped by category. The same employment type, locality and period is covered with up to 20 co-occurrences shown in each of the following categories:

Application Platforms
1 246 (30.37%) Confluence
2 12 (1.48%) CMS
3 10 (1.23%) SharePoint
4 6 (0.74%) Microsoft Exchange
5 4 (0.49%) Kentico
5 4 (0.49%) SAS
6 2 (0.25%) Sitecore CMS
6 2 (0.25%) Umbraco
7 1 (0.12%) Apache Spark
7 1 (0.12%) Oracle Workflow
7 1 (0.12%) ThingWorx
Applications
1 82 (10.12%) Microsoft Office
2 10 (1.23%) Adobe XD
2 10 (1.23%) Microsoft Excel
2 10 (1.23%) Trello
3 8 (0.99%) MS Visio
4 6 (0.74%) Microsoft PowerPoint
5 3 (0.37%) Chatbot
6 2 (0.25%) Microsoft Project
6 2 (0.25%) Photoshop
Business Applications
1 5 (0.62%) Dynamics CRM
2 4 (0.49%) IBM Planning Analytics
3 1 (0.12%) Dynamics GP
3 1 (0.12%) Oracle Assets
3 1 (0.12%) Oracle EBS R12
3 1 (0.12%) Oracle Financials
3 1 (0.12%) Oracle General Ledger
3 1 (0.12%) Oracle Internet Expenses
3 1 (0.12%) Oracle iProcurement
3 1 (0.12%) Oracle Payables
3 1 (0.12%) Oracle Procure-to-Pay
3 1 (0.12%) Oracle Receivables
3 1 (0.12%) Payment Gateway
3 1 (0.12%) Salesforce CRM
3 1 (0.12%) SAP ERP
3 1 (0.12%) SAP FI
Cloud Services
1 346 (42.72%) Azure
2 299 (36.91%) AWS
3 200 (24.69%) GCP
4 80 (9.88%) Miro
5 73 (9.01%) Asana
6 53 (6.54%) SaaS
7 30 (3.70%) Power Platform
8 28 (3.46%) Azure DevOps
9 22 (2.72%) Figma
10 21 (2.59%) GitHub
11 14 (1.73%) Google Analytics
12 12 (1.48%) Microsoft 365
12 12 (1.48%) Serverless
13 11 (1.36%) PaaS
14 10 (1.23%) Amazon EC2
15 9 (1.11%) Amazon S3
15 9 (1.11%) PowerApps
16 8 (0.99%) Azure Cosmos DB
16 8 (0.99%) Azure Synapse Analytics
17 7 (0.86%) Cloud Composer
Communications & Networking
1 151 (18.64%) Broadband
2 8 (0.99%) Internet
3 7 (0.86%) Modbus
3 7 (0.86%) TCP/IP
4 3 (0.37%) Intranet
5 2 (0.25%) Firewall
6 1 (0.12%) Network Security
Database & Business Intelligence
1 265 (32.72%) SQL Server
2 25 (3.09%) Power BI
3 18 (2.22%) Data Warehouse
3 18 (2.22%) NoSQL
4 13 (1.60%) Tableau
5 12 (1.48%) PostgreSQL
6 11 (1.36%) MongoDB
7 10 (1.23%) Azure SQL Database
8 9 (1.11%) Big Data
8 9 (1.11%) BigQuery
8 9 (1.11%) Relational Database
9 8 (0.99%) Data Lake
10 7 (0.86%) RDBMS
11 6 (0.74%) MySQL
11 6 (0.74%) Redis
12 5 (0.62%) Microsoft Analysis Services
13 4 (0.49%) Power Query
14 2 (0.25%) Amazon RDS
14 2 (0.25%) Amazon Redshift
14 2 (0.25%) DynamoDB
Development Applications
1 358 (44.20%) JIRA
2 258 (31.85%) Cucumber
3 256 (31.60%) Maven
4 252 (31.11%) Sonatype Nexus
5 250 (30.86%) Selenium
6 248 (30.62%) Bitbucket
7 247 (30.49%) GitLab
7 247 (30.49%) SonarQube
8 26 (3.21%) Git
9 16 (1.98%) Jenkins
10 12 (1.48%) Axure RP
11 10 (1.23%) Balsamiq
12 9 (1.11%) Oracle Forms
13 8 (0.99%) Cypress.io
13 8 (0.99%) webpack
14 7 (0.86%) Visual Studio
15 2 (0.25%) Visual Studio Code
16 1 (0.12%) ESLint
16 1 (0.12%) Storybook
16 1 (0.12%) TestRail
General
1 483 (59.63%) Finance
2 346 (42.72%) Banking
3 282 (34.81%) Inclusion and Diversity
4 254 (31.36%) Social Skills
5 97 (11.98%) Retail
6 90 (11.11%) Corporate Banking
6 90 (11.11%) Investment Banking
7 81 (10.00%) Games
8 73 (9.01%) Influencing Skills
9 72 (8.89%) Marketing
10 44 (5.43%) Analytical Skills
11 39 (4.81%) Advertising
12 21 (2.59%) Public Sector
13 17 (2.10%) Presentation Skills
14 14 (1.73%) Publishing
15 13 (1.60%) Legal
16 12 (1.48%) Law
17 10 (1.23%) Front Office
17 10 (1.23%) Organisational Skills
18 9 (1.11%) Automotive
Job Titles
1 288 (35.56%) Software Engineer
2 134 (16.54%) Senior
3 96 (11.85%) Analyst
4 85 (10.49%) Engineering Manager
5 83 (10.25%) Senior Manager
6 79 (9.75%) ServiceNow Manager
7 78 (9.63%) Senior Service Manager
8 73 (9.01%) Product Analyst
9 70 (8.64%) Lead
10 55 (6.79%) Product Owner
11 44 (5.43%) Architect
11 44 (5.43%) Developer
12 34 (4.20%) Account Manager
12 34 (4.20%) Strategic Account Manager
13 31 (3.83%) Solutions Architect
14 22 (2.72%) Lead Software Engineer
15 17 (2.10%) Business Analyst
15 17 (2.10%) Designer
16 16 (1.98%) Product Manager
16 16 (1.98%) Senior Developer
Libraries, Frameworks & Software Standards
1 299 (36.91%) React
2 267 (32.96%) CSS
3 264 (32.59%) HTML
3 264 (32.59%) Kafka
4 255 (31.48%) Spring Boot
5 253 (31.23%) Redux
6 250 (30.86%) Spring
7 247 (30.49%) JPA
8 158 (19.51%) Hibernate
9 113 (13.95%) RESTful
10 111 (13.70%) REST
11 97 (11.98%) Jest
12 90 (11.11%) CSS3
12 90 (11.11%) HTML5
12 90 (11.11%) Sass
13 46 (5.68%) .NET
14 24 (2.96%) AngularJS
15 20 (2.47%) Node.js
16 11 (1.36%) JSON
17 9 (1.11%) Web Services
Miscellaneous
1 248 (30.62%) Enterprise Software
2 151 (18.64%) Video\Live Streaming
3 93 (11.48%) Management Information System
4 78 (9.63%) Self-Motivation
5 72 (8.89%) Over-the-Top Content
6 39 (4.81%) Marketing Technology
7 34 (4.20%) Digital Media
8 28 (3.46%) Distributed Systems
9 22 (2.72%) Cloud Native
10 16 (1.98%) Mobile App
11 11 (1.36%) Public Cloud
12 9 (1.11%) Onboarding
12 9 (1.11%) Virtual Team
13 8 (0.99%) Online Banking
14 7 (0.86%) Device Driver
14 7 (0.86%) e-Learning
14 7 (0.86%) Fixed Income
14 7 (0.86%) Security Posture
15 6 (0.74%) Greenfield Project
15 6 (0.74%) Social Media
Operating Systems
1 20 (2.47%) Linux
2 19 (2.35%) Android
3 15 (1.85%) Windows
4 10 (1.23%) Apple iOS
5 8 (0.99%) Embedded Linux
6 7 (0.86%) Red Hat Enterprise Linux
7 4 (0.49%) Windows Server
8 2 (0.25%) Unix
8 2 (0.25%) Windows 10
Processes & Methodologies
1 566 (69.88%) Agile
2 415 (51.23%) Software Engineering
3 345 (42.59%) DevOps
4 324 (40.00%) CI/CD
5 320 (39.51%) Microservices
6 288 (35.56%) Containerisation
7 283 (34.94%) Test Automation
8 279 (34.44%) SDLC
9 272 (33.58%) Full-Stack Development
10 271 (33.46%) Continuous Improvement
10 271 (33.46%) Roadmaps
11 255 (31.48%) Front End Development
12 248 (30.62%) Performance Optimisation
13 201 (24.81%) Mentoring
14 180 (22.22%) TDD
15 162 (20.00%) User Experience
16 159 (19.63%) Clean Code
17 142 (17.53%) Strategic Thinking
18 116 (14.32%) Migration
19 110 (13.58%) Stakeholder Management
Programming Languages
1 320 (39.51%) JavaScript
2 314 (38.77%) SQL
3 294 (36.30%) Java
4 118 (14.57%) TypeScript
5 60 (7.41%) C#
6 42 (5.19%) Python
7 9 (1.11%) Kotlin
7 9 (1.11%) PHP
8 8 (0.99%) C
8 8 (0.99%) C++
9 7 (0.86%) PL/SQL
9 7 (0.86%) PowerShell
10 6 (0.74%) R
11 5 (0.62%) Data Analysis Expressions
12 4 (0.49%) Perl
13 3 (0.37%) Go
13 3 (0.37%) T-SQL
14 2 (0.25%) Bash
15 1 (0.12%) Apex Code
15 1 (0.12%) Objective-C
Qualifications
1 152 (18.77%) Degree
2 97 (11.98%) Computer Science Degree
3 19 (2.35%) Security Cleared
4 12 (1.48%) SC Cleared
5 11 (1.36%) CSPO
5 11 (1.36%) PMI Certification
5 11 (1.36%) PMP
6 10 (1.23%) BPSS Clearance
7 8 (0.99%) Microsoft Certification
8 7 (0.86%) Azure Certification
9 4 (0.49%) CISSP
9 4 (0.49%) DBS Check
9 4 (0.49%) ISTQB
10 3 (0.37%) Master's Degree
11 2 (0.25%) CISM
11 2 (0.25%) ISEB
12 1 (0.12%) A+ Certification
12 1 (0.12%) CSQA
12 1 (0.12%) ITIL Foundation Certificate
12 1 (0.12%) Network+ Certification
Quality Assurance & Compliance
1 283 (34.94%) QA
2 105 (12.96%) Accessibility
3 10 (1.23%) WCAG
4 8 (0.99%) Data Quality
5 7 (0.86%) GDPR
6 6 (0.74%) PMO
7 4 (0.49%) Basel II
7 4 (0.49%) Basel III
7 4 (0.49%) Dodd-Frank
7 4 (0.49%) IFRS
7 4 (0.49%) IFRS 9
7 4 (0.49%) PCI DSS
8 3 (0.37%) PMBOK
9 2 (0.25%) IEC 62304
9 2 (0.25%) ISO 13485
9 2 (0.25%) NIST
10 1 (0.12%) Cyber Essentials
10 1 (0.12%) GRC
10 1 (0.12%) ISO/IEC 27001
10 1 (0.12%) PSD2
System Software
1 288 (35.56%) Docker
2 8 (0.99%) Virtual Machines
3 7 (0.86%) Embedded Firmware
3 7 (0.86%) Firmware
4 5 (0.62%) Active Directory
5 2 (0.25%) VMware Infrastructure
6 1 (0.12%) Hyper-V
Systems Management
1 287 (35.43%) Kubernetes
2 22 (2.72%) Terraform
3 2 (0.25%) Microsoft Intune
3 2 (0.25%) SCCM
4 1 (0.12%) Ansible
4 1 (0.12%) Argo
4 1 (0.12%) Check_MK
4 1 (0.12%) FortiGate
4 1 (0.12%) Grafana
4 1 (0.12%) Istio
4 1 (0.12%) Kibana
4 1 (0.12%) Kustomize
4 1 (0.12%) logstash
4 1 (0.12%) Opsgenie
4 1 (0.12%) Prometheus
4 1 (0.12%) Single Sign-On
Vendors
1 247 (30.49%) Solace
2 137 (16.91%) Microsoft
3 87 (10.74%) Salesforce
4 85 (10.49%) ServiceNow
5 29 (3.58%) Google
6 12 (1.48%) Adobe
6 12 (1.48%) Oracle
7 11 (1.36%) Databricks
7 11 (1.36%) SAP
8 10 (1.23%) IBM
9 7 (0.86%) Cisco
10 6 (0.74%) Apple
11 3 (0.37%) VMware
12 2 (0.25%) Sitecore
12 2 (0.25%) Workday
12 2 (0.25%) Zoho
13 1 (0.12%) Adaptive Insights
13 1 (0.12%) CA Agile Central
13 1 (0.12%) MuleSoft
13 1 (0.12%) Okta