Self-Motivation Contracts with Hybrid/Remote/WFH Options

Self-Motivation
UK > Work from Home

The table below looks at the prevalence of the term Self-Motivation in remote or hybrid contract work. Included is a benchmarking guide to the contractor rates offered in vacancies that cited Self-Motivation over the 6 months leading up to 5 May 2025, comparing them to the same period in the previous two years.

6 months to
5 May 2025
Same period 2024 Same period 2023
Rank 196 176 234
Rank change year-on-year -20 +58 -55
Contract jobs citing Self-Motivation 105 179 266
As % of all contract jobs with a WFH option 1.07% 1.18% 1.04%
As % of the Miscellaneous category 3.23% 4.14% 3.31%
Number of daily rates quoted 65 95 172
10th Percentile £198 £358 £228
25th Percentile £363 £413 £374
Median daily rate (50th Percentile) £500 £538 £500
Median % change year-on-year -6.98% +7.50% -
75th Percentile £638 £608 £652
90th Percentile £675 £638 £749
UK median daily rate £479 £500 £520
% change year-on-year -4.20% -3.85% +3.17%
Number of hourly rates quoted 9 35 6
10th Percentile £19.60 - £23.15
25th Percentile £26.25 £25.50 £28.06
Median hourly rate £31.76 £70.00 £48.05
Median % change year-on-year -54.63% +45.67% +182.66%
75th Percentile £32.05 £72.50 £51.60
90th Percentile £69.50 - £54.82
UK median hourly rate £27.72 £62.50 £24.50
% change year-on-year -55.65% +155.10% -18.33%

All Generic Skills
Work from Home

Self-Motivation falls under the General and Transferable Skills category. For comparison with the information above, the following table provides summary statistics for all contract job vacancies with remote or hybrid options requiring generic IT skills.

Contract vacancies with a requirement for generic IT skills 3,252 4,327 8,034
As % of all contract jobs with a WFH option 33.16% 28.56% 31.46%
Number of daily rates quoted 2,223 2,950 5,650
10th Percentile £350 £325 £363
25th Percentile £425 £430 £452
Median daily rate (50th Percentile) £545 £550 £550
Median % change year-on-year -0.91% - +1.85%
75th Percentile £688 £675 £684
90th Percentile £825 £800 £792
UK median daily rate £525 £538 £550
% change year-on-year -2.33% -2.27% -
Number of hourly rates quoted 75 195 154
10th Percentile £18.33 £15.45 £19.00
25th Percentile £24.50 £25.50 £25.75
Median hourly rate £41.00 £48.50 £55.00
Median % change year-on-year -15.46% -11.82% +23.60%
75th Percentile £64.63 £65.02 £70.00
90th Percentile £78.25 £72.50 £85.00
UK median hourly rate £32.05 £30.16 £22.49
% change year-on-year +6.27% +34.13% -18.24%

Self-Motivation
Trend for Jobs with a WFH Option

Job vacancies with remote working options citing Self-Motivation as a proportion of all IT jobs advertised.
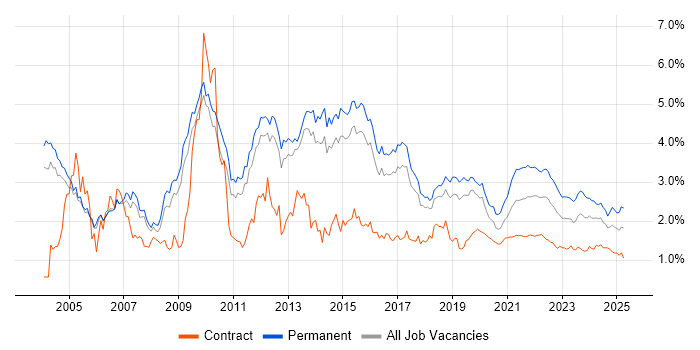
Self-Motivation trend for jobs with Hybrid/Remote/WFH options

Self-Motivation
Daily Rate Trend for Jobs with a WFH Option

3-month moving average daily rate quoted in job vacancies with remote working options citing Self-Motivation.

Self-Motivation daily rate for jobs with a WFH option

Self-Motivation
Daily Rate Histogram for Jobs with a WFH Option

Daily rate distribution for jobs with remote working options citing Self-Motivation over the 6 months to 5 May 2025.

Self-Motivation daily rate histogram for jobs with a WFH option

Self-Motivation
Hourly Rate Trend for Jobs with a WFH Option

3-month moving average hourly rate quoted in job vacancies with remote working options citing Self-Motivation.

Self-Motivation hourly rate for jobs with a WFH option

Self-Motivation
Hourly Rate Histogram for Jobs with a WFH Option

Hourly rate distribution for jobs with remote working options citing Self-Motivation over the 6 months to 5 May 2025.

Self-Motivation hourly rate histogram for jobs with a WFH option

Self-Motivation
Co-occurring Skills and Capabilities with WFH Options by Category

The follow tables expand on the table above by listing co-occurrences grouped by category. The same employment type, locality and period is covered with up to 20 co-occurrences shown in each of the following categories:

Application Platforms
1 8 (7.62%) SharePoint
2 3 (2.86%) Microsoft Exchange
3 2 (1.90%) CMS
3 2 (1.90%) NetWeaver
3 2 (1.90%) SAP EP
4 1 (0.95%) Apache
4 1 (0.95%) IIS
Applications
1 9 (8.57%) Microsoft Excel
2 7 (6.67%) Microsoft Office
3 6 (5.71%) Photoshop
4 5 (4.76%) Microsoft PowerPoint
5 4 (3.81%) Maya
6 2 (1.90%) Adobe After Effects
6 2 (1.90%) Adobe Illustrator
6 2 (1.90%) Microsoft Project
7 1 (0.95%) Trello
Business Applications
1 2 (1.90%) Maximo
1 2 (1.90%) SAP CRM
1 2 (1.90%) SAP Oil and Gas
1 2 (1.90%) SAP S/4HANA
2 1 (0.95%) Dynamics CRM
2 1 (0.95%) IBM Planning Analytics
2 1 (0.95%) Remedy ITSM
2 1 (0.95%) SAP MM
2 1 (0.95%) Sparx Enterprise Architect
Cloud Services
1 25 (23.81%) Azure
2 11 (10.48%) Power Platform
3 10 (9.52%) Entra ID
4 9 (8.57%) AWS
5 5 (4.76%) GCP
5 5 (4.76%) GitHub
6 4 (3.81%) dbt
7 3 (2.86%) Dynamics 365
8 2 (1.90%) Azure DevOps
8 2 (1.90%) Cloud Computing
8 2 (1.90%) Figma
8 2 (1.90%) Microsoft 365
8 2 (1.90%) SaaS
8 2 (1.90%) SuccessFactors
9 1 (0.95%) Azure Data Factory
9 1 (0.95%) Azure Logic Apps
9 1 (0.95%) Azure Monitor
9 1 (0.95%) Google Workspace
9 1 (0.95%) Mimecast
9 1 (0.95%) Nutanix
Communications & Networking
1 8 (7.62%) Firewall
2 6 (5.71%) DNS
3 5 (4.76%) DHCP
3 5 (4.76%) Network Security
3 5 (4.76%) VPN
4 4 (3.81%) WAN
5 3 (2.86%) 4G
5 3 (2.86%) LAN
5 3 (2.86%) Radio Access Network
5 3 (2.86%) SMTP
5 3 (2.86%) TCP/IP
5 3 (2.86%) Wireless
6 2 (1.90%) Internet
6 2 (1.90%) SSL
7 1 (0.95%) FTP
7 1 (0.95%) HTTP
7 1 (0.95%) Unified Communications
Database & Business Intelligence
1 11 (10.48%) Power BI
2 4 (3.81%) Oracle Database
2 4 (3.81%) SQL Server
3 3 (2.86%) Power Query
4 2 (1.90%) Big Data
4 2 (1.90%) Metadata
4 2 (1.90%) Qlik Sense
5 1 (0.95%) Looker
5 1 (0.95%) MySQL
5 1 (0.95%) PostgreSQL
5 1 (0.95%) Redis
5 1 (0.95%) UniData
Development Applications
1 5 (4.76%) Git
2 4 (3.81%) Team Foundation Server
3 3 (2.86%) Jenkins
3 3 (2.86%) JIRA
3 3 (2.86%) Oracle Forms
4 2 (1.90%) MSTest
4 2 (1.90%) NUnit
4 2 (1.90%) Postman
4 2 (1.90%) Visual Studio
4 2 (1.90%) Xcode
5 1 (0.95%) Android Studio
5 1 (0.95%) MagicDraw
5 1 (0.95%) Rational Rhapsody
General
1 65 (61.90%) Social Skills
2 33 (31.43%) Finance
3 29 (27.62%) Analytical Skills
4 12 (11.43%) Organisational Skills
5 11 (10.48%) Marketing
6 8 (7.62%) Influencing Skills
7 7 (6.67%) Public Sector
8 6 (5.71%) Games
8 6 (5.71%) Inclusion and Diversity
9 5 (4.76%) Banking
9 5 (4.76%) Telecoms
10 4 (3.81%) Investment Banking
10 4 (3.81%) Manufacturing
11 3 (2.86%) Legal
11 3 (2.86%) Presentation Skills
12 2 (1.90%) Aerospace
12 2 (1.90%) Billing
12 2 (1.90%) French Language
12 2 (1.90%) Military
13 1 (0.95%) Retail
Job Titles
1 20 (19.05%) Senior
2 15 (14.29%) Developer
3 11 (10.48%) Architect
4 10 (9.52%) Lead
4 10 (9.52%) Senior Developer
5 6 (5.71%) Project Manager
6 5 (4.76%) Infrastructure Engineer
7 4 (3.81%) 3D Artist
7 4 (3.81%) Azure Engineer
7 4 (3.81%) Consultant
8 3 (2.86%) .NET Developer
8 3 (2.86%) Administrator
8 3 (2.86%) Analyst
8 3 (2.86%) AWS Engineer
8 3 (2.86%) Cybersecurity Architect
8 3 (2.86%) IT Manager
8 3 (2.86%) IT Project Manager
8 3 (2.86%) Programme Manager
8 3 (2.86%) Senior Analyst
8 3 (2.86%) Solutions Architect
Libraries, Frameworks & Software Standards
1 9 (8.57%) REST
2 5 (4.76%) LDAP
3 4 (3.81%) .NET
3 4 (3.81%) Unreal Engine
4 3 (2.86%) RESTful
4 3 (2.86%) SAP PI
4 3 (2.86%) Smart Contracts
5 2 (1.90%) ADO
5 2 (1.90%) CSS
5 2 (1.90%) React
5 2 (1.90%) SAP Fiori
5 2 (1.90%) SAPUI5
5 2 (1.90%) WCF
5 2 (1.90%) Web Services
6 1 (0.95%) .NET Framework
6 1 (0.95%) ARM Templates
6 1 (0.95%) Lightning Web Components
6 1 (0.95%) MDX
6 1 (0.95%) OpenAPI
6 1 (0.95%) React Native
Miscellaneous
1 7 (6.67%) Onboarding
1 7 (6.67%) Security Posture
2 5 (4.76%) Renewable Energy
3 4 (3.81%) Data Centre
3 4 (3.81%) Data Protection Act
3 4 (3.81%) Life Science
3 4 (3.81%) Security Operations Centre
4 3 (2.86%) Blockchain
4 3 (2.86%) Enterprise Software
4 3 (2.86%) Equities
4 3 (2.86%) Management Information System
4 3 (2.86%) Virtual Team
5 2 (1.90%) Algorithms
5 2 (1.90%) Learning Management System
5 2 (1.90%) Legacy Systems
5 2 (1.90%) Mobile App
5 2 (1.90%) Online Games
5 2 (1.90%) Operational Technology
5 2 (1.90%) PMI
6 1 (0.95%) Social Media
Operating Systems
1 17 (16.19%) Windows
2 9 (8.57%) Linux
3 5 (4.76%) Windows Server
4 2 (1.90%) Android
4 2 (1.90%) Apple iOS
4 2 (1.90%) Ubuntu
4 2 (1.90%) Windows Server 2019
5 1 (0.95%) Windows 10
5 1 (0.95%) Windows Server 2016
Processes & Methodologies
1 33 (31.43%) Problem-Solving
2 22 (20.95%) Agile
3 18 (17.14%) Continuous Improvement
4 17 (16.19%) Project Management
5 16 (15.24%) Change Management
5 16 (15.24%) Collaborative Working
6 13 (12.38%) Time Management
7 12 (11.43%) Analytics
8 11 (10.48%) Business Intelligence
8 11 (10.48%) ITSM
8 11 (10.48%) Migration
9 10 (9.52%) Cybersecurity
9 10 (9.52%) Identity Access Management
9 10 (9.52%) Project Delivery
9 10 (9.52%) Stakeholder Engagement
10 9 (8.57%) High Availability
11 8 (7.62%) DevOps
11 8 (7.62%) ITIL
11 8 (7.62%) RBAC
11 8 (7.62%) Stakeholder Management
Programming Languages
1 11 (10.48%) Python
1 11 (10.48%) SQL
2 9 (8.57%) PowerShell
3 5 (4.76%) C#
3 5 (4.76%) Java
3 5 (4.76%) JavaScript
3 5 (4.76%) VBA
4 3 (2.86%) DAML
4 3 (2.86%) VB
5 2 (1.90%) ABAP
6 1 (0.95%) Apex Code
6 1 (0.95%) Bash
6 1 (0.95%) Bicep
6 1 (0.95%) Objective-C
6 1 (0.95%) Swift
6 1 (0.95%) TypeScript
6 1 (0.95%) UniBasic
6 1 (0.95%) VBScript
Qualifications
1 12 (11.43%) Degree
2 10 (9.52%) SC Cleared
2 10 (9.52%) Security Cleared
3 7 (6.67%) CISSP
4 6 (5.71%) Cisco Certification
5 5 (4.76%) CISM
6 4 (3.81%) CCNA
7 3 (2.86%) BPSS Clearance
7 3 (2.86%) CCNP
8 2 (1.90%) (ISC)2 CCSP
8 2 (1.90%) CCSP
8 2 (1.90%) Computer Science Degree
8 2 (1.90%) GCIH
8 2 (1.90%) PMI Certification
8 2 (1.90%) TOGAF Certification
9 1 (0.95%) AWS Certified Solutions Architect
9 1 (0.95%) CEH
9 1 (0.95%) GIAC
9 1 (0.95%) ITIL Certification
9 1 (0.95%) PRINCE2 Certification
Quality Assurance & Compliance
1 6 (5.71%) NIST
2 5 (4.76%) GDPR
3 4 (3.81%) ISO/IEC 27001
4 3 (2.86%) Data Quality
4 3 (2.86%) GRC
5 2 (1.90%) NCSC
5 2 (1.90%) PMO
5 2 (1.90%) QA
5 2 (1.90%) SLA
5 2 (1.90%) Software Quality Assurance
6 1 (0.95%) PCI DSS
6 1 (0.95%) Sarbanes-Oxley
System Software
1 15 (14.29%) Active Directory
2 3 (2.86%) Hyper-V
3 2 (1.90%) Docker
4 1 (0.95%) Virtual Desktop
4 1 (0.95%) Virtual Machines
Systems Management
1 8 (7.62%) Ansible
2 5 (4.76%) Single Sign-On
3 4 (3.81%) Terraform
4 3 (2.86%) FortiGate
5 2 (1.90%) SCCM
6 1 (0.95%) Active Directory Federation Services
6 1 (0.95%) Kubernetes
6 1 (0.95%) Microsoft Intune
6 1 (0.95%) PTC Integrity
6 1 (0.95%) QRadar
6 1 (0.95%) SCOM
6 1 (0.95%) WSUS
Vendors
1 18 (17.14%) Microsoft
2 7 (6.67%) SAP
3 6 (5.71%) ServiceNow
4 5 (4.76%) CyberArk
5 4 (3.81%) Google
5 4 (3.81%) Oracle
5 4 (3.81%) Workday
6 3 (2.86%) IBM
7 2 (1.90%) Alteryx
7 2 (1.90%) Ariba
7 2 (1.90%) Databricks
7 2 (1.90%) Instagram
7 2 (1.90%) Palo Alto
8 1 (0.95%) Informatica
8 1 (0.95%) PTC
8 1 (0.95%) Qualys
8 1 (0.95%) Remedy
8 1 (0.95%) Salesforce
8 1 (0.95%) SolarWinds
8 1 (0.95%) VMware