Solaris Jobs in England

Sun Microsystems Solaris
UK > England

The table below provides summary statistics for permanent job vacancies advertised in England requiring Solaris skills. It includes a benchmarking guide to the annual salaries offered in vacancies that cited Solaris over the 6 months leading up to 26 July 2024, comparing them to the same period in the previous two years.

6 months to
26 Jul 2024
Same period 2023 Same period 2022
Rank 693 714 968
Rank change year-on-year +21 +254 -98
Permanent jobs citing Solaris 107 120 222
As % of all permanent jobs advertised in England 0.14% 0.17% 0.15%
As % of the Operating Systems category 1.03% 1.00% 0.85%
Number of salaries quoted 69 72 117
10th Percentile £51,250 £40,000 £37,050
25th Percentile £55,500 £43,186 £41,000
Median annual salary (50th Percentile) £85,000 £65,351 £62,500
Median % change year-on-year +30.07% +4.56% -13.79%
75th Percentile £102,500 £81,250 £100,000
90th Percentile £108,000 £90,000 £115,000
UK median annual salary £85,000 £65,351 £63,750
% change year-on-year +30.07% +2.51% +8.51%

All Operating Systems
England

Solaris falls under the Operating Systems category. For comparison with the information above, the following table provides summary statistics for all permanent job vacancies requiring operating system skills in England.

Permanent vacancies with a requirement for operating system skills 10,370 12,046 26,146
As % of all permanent jobs advertised in England 13.23% 16.95% 17.78%
Number of salaries quoted 7,651 8,843 14,776
10th Percentile £26,250 £27,250 £26,475
25th Percentile £32,500 £35,000 £35,750
Median annual salary (50th Percentile) £47,500 £52,500 £52,500
Median % change year-on-year -9.52% - +5.00%
75th Percentile £63,750 £71,250 £71,250
90th Percentile £83,750 £91,250 £90,000
UK median annual salary £47,500 £52,500 £52,500
% change year-on-year -9.52% - +5.00%

Solaris
Job Vacancy Trend in England

Job postings citing Solaris as a proportion of all IT jobs advertised in England.
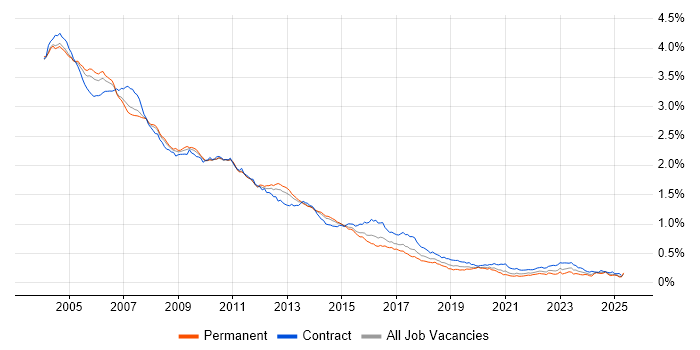
Job vacancy trend for Solaris in England

Solaris
Salary Trend in England

3-month moving average salary quoted in jobs citing Solaris in England.

Salary trend for Solaris in England

Solaris
Salary Histogram in England

Salary distribution for jobs citing Solaris in England over the 6 months to 26 July 2024.

Salary histogram for Solaris in England

Solaris
Job Locations in England

The table below looks at the demand and provides a guide to the median salaries quoted in IT jobs citing Solaris within the England region over the 6 months to 26 July 2024. The 'Rank Change' column provides an indication of the change in demand within each location based on the same 6 month period last year.

Location Rank Change
on Same Period
Last Year
Matching
Permanent
IT Job Ads
Median Salary
Past 6 Months
Median Salary
% Change
on Same Period
Last Year
Live
Jobs
London +77 46 £87,610 +34.06% 4
North of England -8 20 £52,500 +8.25% 2
North West -6 18 £52,500 -19.66%
West Midlands +9 16 £105,000 +55.56%
Midlands -10 16 £105,000 +61.54%
South West -1 9 £52,500 -19.66% 3
East of England +1 8 £52,500 +14.75%
South East -9 4 £56,000 -30.00%
Yorkshire +45 2 £72,500 +81.25% 2
Solaris
UK

Solaris
Co-occurring Skills and Capabilities in England by Category

The follow tables expand on the table above by listing co-occurrences grouped by category. The same employment type, locality and period is covered with up to 20 co-occurrences shown in each of the following categories:

Application Platforms
1 29 (27.10%) Apache
2 28 (26.17%) Tomcat
3 25 (23.36%) IIS
4 10 (9.35%) Microsoft Exchange
5 4 (3.74%) WebLogic
6 3 (2.80%) GlassFish
6 3 (2.80%) JBoss
6 3 (2.80%) Oracle Service Bus
7 1 (0.93%) Apache Pulsar
7 1 (0.93%) IBM Domino
7 1 (0.93%) Oracle SOA Suite
Applications
1 8 (7.48%) Microsoft Excel
2 7 (6.54%) Microsoft Office
3 3 (2.80%) MS Visio
Business Applications
1 24 (22.43%) NEC Housing
2 9 (8.41%) Fidessa
3 6 (5.61%) Oracle Cash Management
4 3 (2.80%) Remedy ITSM
5 1 (0.93%) Oracle Applications
Cloud Services
1 25 (23.36%) Azure
2 24 (22.43%) AWS
3 13 (12.15%) GCP
4 9 (8.41%) IaaS
4 9 (8.41%) PaaS
4 9 (8.41%) SaaS
5 4 (3.74%) Amazon S3
5 4 (3.74%) Azure Sentinel
5 4 (3.74%) OCI
6 1 (0.93%) Amazon SageMaker
6 1 (0.93%) Azure Synapse Analytics
6 1 (0.93%) npm
6 1 (0.93%) Yarn
Communications & Networking
1 13 (12.15%) DNS
2 12 (11.21%) Firewall
3 9 (8.41%) DHCP
3 9 (8.41%) FIX Connectivity
3 9 (8.41%) TCP/IP
4 4 (3.74%) SAN
5 3 (2.80%) Reverse Proxy
6 1 (0.93%) HTTP
6 1 (0.93%) PSTN
Database & Business Intelligence
1 32 (29.91%) Oracle Database
2 27 (25.23%) SQL Server
3 5 (4.67%) InfluxDB
4 4 (3.74%) Oracle Database 11g
4 4 (3.74%) Oracle Database 12c
5 3 (2.80%) MongoDB
5 3 (2.80%) Oracle Database 10g
5 3 (2.80%) Oracle Reports
5 3 (2.80%) VLDB
6 2 (1.87%) Data Warehouse
6 2 (1.87%) PostgreSQL
7 1 (0.93%) Data Lake
7 1 (0.93%) DB2
7 1 (0.93%) Dremio
7 1 (0.93%) MariaDB
7 1 (0.93%) MySQL
7 1 (0.93%) Oracle9i Database
7 1 (0.93%) OrientDB
7 1 (0.93%) Relational Database
Development Applications
1 12 (11.21%) Git
2 11 (10.28%) Jenkins
3 10 (9.35%) TeamCity
4 3 (2.80%) JIRA
5 2 (1.87%) Bitbucket
6 1 (0.93%) Ant
6 1 (0.93%) Eclipse
6 1 (0.93%) IntelliJ
6 1 (0.93%) Maven
6 1 (0.93%) Mercurial
6 1 (0.93%) SonarQube
6 1 (0.93%) Team Foundation Server
6 1 (0.93%) Visual Studio Code
General
1 58 (54.21%) Finance
2 24 (22.43%) Local Government
2 24 (22.43%) Police
2 24 (22.43%) Public Sector
3 22 (20.56%) Banking
4 10 (9.35%) Social Skills
5 8 (7.48%) Financial Institution
6 5 (4.67%) Analytical Skills
7 1 (0.93%) Back Office
7 1 (0.93%) Military
Job Titles
1 36 (33.64%) Applications Support
2 26 (24.30%) Linux Engineer
3 21 (19.63%) Unix Engineer
3 21 (19.63%) Unix Linux Engineer
4 15 (14.02%) Analyst
4 15 (14.02%) Support Analyst
5 12 (11.21%) Applications Support Analyst
6 11 (10.28%) Architect
7 9 (8.41%) Banking Analyst
7 9 (8.41%) Cloud Architect
7 9 (8.41%) Financial Analyst
8 8 (7.48%) Lead
8 8 (7.48%) Platform Engineer
8 8 (7.48%) Technical Leader
9 6 (5.61%) SQL Analyst
9 6 (5.61%) SQL Support Analyst
10 5 (4.67%) Administrator
10 5 (4.67%) Kubernetes Engineer
11 4 (3.74%) Security Engineer
11 4 (3.74%) Unix Specialist
Libraries, Frameworks & Software Standards
1 25 (23.36%) Web Services
2 18 (16.82%) Middleware
3 13 (12.15%) Kafka
4 9 (8.41%) FIX Protocol
5 3 (2.80%) LDAP
5 3 (2.80%) SAML
6 1 (0.93%) .NET
6 1 (0.93%) AngularJS
6 1 (0.93%) Express.js
6 1 (0.93%) J2EE
6 1 (0.93%) MEAN Stack
6 1 (0.93%) MERN Stack
6 1 (0.93%) Node.js
6 1 (0.93%) Oracle GoldenGate
6 1 (0.93%) React
6 1 (0.93%) RESTful
Miscellaneous
1 29 (27.10%) Public Cloud
2 18 (16.82%) Replication
3 12 (11.21%) Clustering
4 9 (8.41%) Cloud Native
4 9 (8.41%) Eurex
5 8 (7.48%) Cyber Threat
5 8 (7.48%) Cyberattack
5 8 (7.48%) Data Fabric
6 6 (5.61%) SWIFT Messaging Network
7 4 (3.74%) Cyber Kill Chain
7 4 (3.74%) Onboarding
8 3 (2.80%) Data Centre
8 3 (2.80%) Management Information System
9 1 (0.93%) Data Protection Act
9 1 (0.93%) Mainframe
9 1 (0.93%) PKI
9 1 (0.93%) Robotics
9 1 (0.93%) Virtual Team
Operating Systems
1 106 (99.07%) Linux
2 93 (86.92%) Unix
3 63 (58.88%) Windows
4 30 (28.04%) Ubuntu
5 21 (19.63%) CentOS
6 18 (16.82%) Red Hat Enterprise Linux
7 12 (11.21%) zOS
8 10 (9.35%) Oracle Linux
9 8 (7.48%) AIX
10 5 (4.67%) Windows Server
11 1 (0.93%) HPUX
11 1 (0.93%) NetWare
11 1 (0.93%) SUSE
11 1 (0.93%) VMS
11 1 (0.93%) Windows 10
11 1 (0.93%) Windows Server 2012
11 1 (0.93%) Windows Server 2016
Processes & Methodologies
1 34 (31.78%) Server Management
2 28 (26.17%) Data Security
3 27 (25.23%) Disaster Recovery
4 24 (22.43%) Network Architecture
4 24 (22.43%) Task Automation
5 17 (15.89%) Performance Tuning
6 15 (14.02%) Agile
7 14 (13.08%) ETL
7 14 (13.08%) High Availability
8 13 (12.15%) Identity Access Management
9 12 (11.21%) Key Management
10 11 (10.28%) CI/CD
10 11 (10.28%) ITIL
10 11 (10.28%) Storage Management
11 10 (9.35%) Deployment Automation
11 10 (9.35%) DevSecOps
11 10 (9.35%) Information Security
11 10 (9.35%) Infrastructure as Code
11 10 (9.35%) Scrum
11 10 (9.35%) Security Hardening
Programming Languages
1 30 (28.04%) Shell Script
2 20 (18.69%) PowerShell
3 19 (17.76%) Bash
3 19 (17.76%) Python
4 18 (16.82%) SQL
5 10 (9.35%) C#
5 10 (9.35%) JavaScript
6 9 (8.41%) Perl
6 9 (8.41%) Ruby
7 5 (4.67%) Java
8 4 (3.74%) PL/SQL
9 2 (1.87%) C++
10 1 (0.93%) ActionScript
10 1 (0.93%) ProC
10 1 (0.93%) TypeScript
10 1 (0.93%) VC++
Qualifications
1 49 (45.79%) Security Cleared
2 28 (26.17%) Degree
3 23 (21.50%) SC Cleared
4 21 (19.63%) DV Cleared
5 9 (8.41%) AWS Certification
5 9 (8.41%) AWS Certified Solutions Architect
5 9 (8.41%) Azure Certification
6 4 (3.74%) CISM
6 4 (3.74%) CISSP
7 1 (0.93%) A+ Certification
7 1 (0.93%) BPSS Clearance
7 1 (0.93%) Dell Certification
7 1 (0.93%) IBM Certification
7 1 (0.93%) Server+ Certification
Quality Assurance & Compliance
1 24 (22.43%) Accessibility
2 7 (6.54%) SLA
3 4 (3.74%) ISO/IEC 27001
3 4 (3.74%) ISO/IEC 27002 (supersedes ISO/IEC 17799)
3 4 (3.74%) NIST
System Software
1 12 (11.21%) Docker
2 5 (4.67%) Active Directory
3 4 (3.74%) LXC
3 4 (3.74%) Oracle RAC
3 4 (3.74%) Squid
3 4 (3.74%) Virtual Machines
4 3 (2.80%) Hyper-V
4 3 (2.80%) VMware Infrastructure
5 2 (1.87%) VMware ESXi
6 1 (0.93%) Ceph
6 1 (0.93%) PowerHA
6 1 (0.93%) Veritas Cluster Server
Systems Management
1 17 (15.89%) Ansible
2 13 (12.15%) Kubernetes
3 10 (9.35%) Terraform
4 9 (8.41%) Prometheus
5 5 (4.67%) Grafana
6 4 (3.74%) Istio
6 4 (3.74%) Opsview
7 3 (2.80%) Data Guard
7 3 (2.80%) Oracle RMAN
7 3 (2.80%) Oracle Statspack
7 3 (2.80%) Single Sign-On
8 2 (1.87%) Rancher
8 2 (1.87%) Red Hat Satellite
8 2 (1.87%) SCOM
8 2 (1.87%) Tivoli Identity Manager
9 1 (0.93%) Hadoop YARN
9 1 (0.93%) Kibana
9 1 (0.93%) Nagios
9 1 (0.93%) nmon
9 1 (0.93%) ZENworks
Vendors
1 61 (57.01%) Oracle
2 43 (40.19%) Red Hat
3 27 (25.23%) Microsoft
4 24 (22.43%) NEC
5 17 (15.89%) IBM
6 10 (9.35%) Serena
6 10 (9.35%) Splunk
6 10 (9.35%) VMware
7 9 (8.41%) Bloomberg
7 9 (8.41%) CQG
7 9 (8.41%) ION Trading
7 9 (8.41%) Patsystems
7 9 (8.41%) Reuters
7 9 (8.41%) Trayport
8 6 (5.61%) PeopleSoft
8 6 (5.61%) Sun
9 5 (4.67%) HP
9 5 (4.67%) Qualys
10 4 (3.74%) Dell
10 4 (3.74%) SolarWinds