Police Jobs in England

Police
UK > England

The table below looks at the prevalence of the term Police in permanent job vacancies in England. Included is a benchmarking guide to the salaries offered in vacancies that cited Police over the 6 months leading up to 26 July 2024, comparing them to the same period in the previous two years.

6 months to
26 Jul 2024
Same period 2023 Same period 2022
Rank 515 441 850
Rank change year-on-year -74 +409 -31
Permanent jobs citing Police 304 461 350
As % of all permanent jobs advertised in England 0.39% 0.65% 0.24%
As % of the General category 0.68% 0.98% 0.35%
Number of salaries quoted 157 172 241
10th Percentile £30,000 £33,563 £30,914
25th Percentile £37,289 £42,443 £34,500
Median annual salary (50th Percentile) £45,500 £49,280 £40,455
Median % change year-on-year -7.67% +21.81% -13.00%
75th Percentile £59,000 £56,549 £51,579
90th Percentile £72,500 £69,649 £71,265
UK median annual salary £45,000 £49,280 £40,606
% change year-on-year -8.69% +21.36% -9.76%

All General Skills
England

Police falls under the General Skills category. For comparison with the information above, the following table provides summary statistics for all permanent job vacancies requiring common skills in England.

Permanent vacancies with a requirement for common skills 44,799 46,891 99,241
As % of all permanent jobs advertised in England 57.17% 65.97% 67.50%
Number of salaries quoted 28,228 29,742 48,838
10th Percentile £28,500 £32,000 £32,500
25th Percentile £37,500 £43,250 £43,500
Median annual salary (50th Percentile) £55,000 £60,000 £60,000
Median % change year-on-year -8.33% - +4.35%
75th Percentile £73,886 £82,500 £80,000
90th Percentile £95,000 £105,000 £100,000
UK median annual salary £54,000 £60,000 £60,000
% change year-on-year -10.00% - +6.19%

Police
Job Vacancy Trend in England

Job postings citing Police as a proportion of all IT jobs advertised in England.
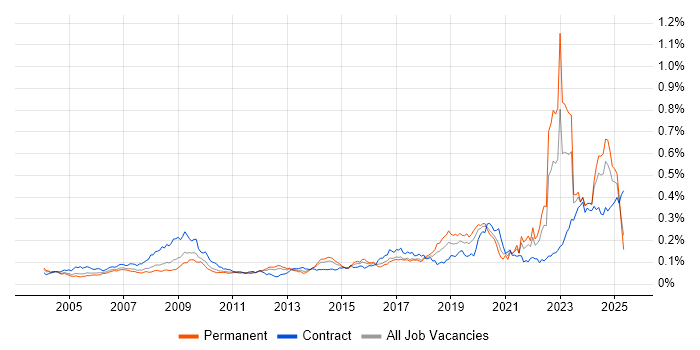
Job vacancy trend for Police in England

Police
Salary Trend in England

3-month moving average salary quoted in jobs citing Police in England.

Salary trend for Police in England

Police
Salary Histogram in England

Salary distribution for jobs citing Police in England over the 6 months to 26 July 2024.

Salary histogram for Police in England

Police
Job Locations in England

The table below looks at the demand and provides a guide to the median salaries quoted in IT jobs citing Police within the England region over the 6 months to 26 July 2024. The 'Rank Change' column provides an indication of the change in demand within each location based on the same 6 month period last year.

Location Rank Change
on Same Period
Last Year
Matching
Permanent
IT Job Ads
Median Salary
Past 6 Months
Median Salary
% Change
on Same Period
Last Year
Live
Jobs
London -24 78 £51,196 -5.53% 6
North of England -48 77 £44,125 -8.63% 21
Midlands -15 58 £43,227 -8.49% 7
West Midlands +32 57 £43,227 -8.49% 5
South East +21 47 £49,881 +17.37% 12
North West -34 35 £59,500 +38.94% 12
North East -23 28 £35,000 -27.52% 3
South West -26 16 £45,000 +63.07% 9
Yorkshire +32 14 £50,000 -25.38% 6
East of England +6 13 £30,000 - 3
East Midlands -57 1 £43,430 - 2
Police
UK

Police
Co-occurring Skills and Capabilities in England by Category

The follow tables expand on the table above by listing co-occurrences grouped by category. The same employment type, locality and period is covered with up to 20 co-occurrences shown in each of the following categories:

Application Platforms
1 24 (7.89%) Apache
1 24 (7.89%) IIS
1 24 (7.89%) Tomcat
2 17 (5.59%) SharePoint
3 12 (3.95%) WebLogic
Applications
1 18 (5.92%) Microsoft Office
2 13 (4.28%) Microsoft Excel
3 3 (0.99%) Adobe After Effects
3 3 (0.99%) Adobe Premiere
3 3 (0.99%) Photoshop
4 2 (0.66%) Microsoft PowerPoint
4 2 (0.66%) Microsoft Project
5 1 (0.33%) Adobe Creative Suite
5 1 (0.33%) Adobe Illustrator
5 1 (0.33%) MS Visio
Business Applications
1 100 (32.89%) NEC Housing
2 2 (0.66%) Oracle EBS
3 1 (0.33%) Unit4 Business World
Cloud Services
1 25 (8.22%) Azure
2 20 (6.58%) Figma
2 20 (6.58%) Microsoft 365
3 13 (4.28%) Power Platform
3 13 (4.28%) SaaS
4 10 (3.29%) PowerApps
5 9 (2.96%) Power Automate
6 8 (2.63%) Azure DevOps
7 5 (1.64%) AWS
8 4 (1.32%) Azure Sentinel
8 4 (1.32%) Entra ID
9 1 (0.33%) Azure Event Grid
9 1 (0.33%) Azure ExpressRoute
9 1 (0.33%) PaaS
Communications & Networking
1 13 (4.28%) Firewall
2 10 (3.29%) WAN
3 9 (2.96%) Intranet
4 6 (1.97%) LAN
4 6 (1.97%) TCP/IP
5 5 (1.64%) Network Security
6 4 (1.32%) CTI
6 4 (1.32%) SD-WAN
6 4 (1.32%) VLAN
6 4 (1.32%) VSAN
7 2 (0.66%) Wireless
8 1 (0.33%) BGP
8 1 (0.33%) Cisco ASA
8 1 (0.33%) Cisco IOS
8 1 (0.33%) Cisco Nexus
8 1 (0.33%) DNS
8 1 (0.33%) OSPF
8 1 (0.33%) Spanning Tree
8 1 (0.33%) VoIP
8 1 (0.33%) VPN
Database & Business Intelligence
1 55 (18.09%) Oracle Database
2 26 (8.55%) SQL Server
3 22 (7.24%) PostgreSQL
4 21 (6.91%) Oracle Database 12c
5 16 (5.26%) Elasticsearch
6 4 (1.32%) NoSQL
7 2 (0.66%) BusinessObjects
7 2 (0.66%) MySQL
7 2 (0.66%) Power BI
8 1 (0.33%) Data Hub
Development Applications
1 23 (7.57%) JIRA
2 10 (3.29%) Oracle APEX
3 8 (2.63%) Team Foundation Server
4 7 (2.30%) Visual Studio
5 6 (1.97%) Git
6 1 (0.33%) Selenium
General
1 127 (41.78%) Public Sector
2 111 (36.51%) Finance
3 105 (34.54%) Social Skills
4 104 (34.21%) Local Government
5 62 (20.39%) Analytical Skills
6 26 (8.55%) Back Office
7 23 (7.57%) Inclusion and Diversity
8 22 (7.24%) Presentation Skills
9 20 (6.58%) Social Housing
10 19 (6.25%) Organisational Skills
11 18 (5.92%) Law
12 12 (3.95%) Retail
13 11 (3.62%) Electronics
14 10 (3.29%) Fire and Rescue
14 10 (3.29%) Telecoms
15 6 (1.97%) Influencing Skills
16 5 (1.64%) Military
16 5 (1.64%) Social Science
17 4 (1.32%) Legal
18 3 (0.99%) Welsh Language
Job Titles
1 47 (15.46%) Analyst
2 36 (11.84%) Applications Support
3 32 (10.53%) Lead
4 30 (9.87%) Developer
5 28 (9.21%) Senior
6 23 (7.57%) Administrator
7 22 (7.24%) DBA
8 21 (6.91%) Oracle DBA
8 21 (6.91%) PostgreSQL DBA
9 20 (6.58%) Product Manager
10 16 (5.26%) Software Developer
11 14 (4.61%) Senior Analyst
12 12 (3.95%) Applications Support Analyst
12 12 (3.95%) Senior Applications Support
12 12 (3.95%) Senior Applications Support Analyst
12 12 (3.95%) Senior Support Analyst
12 12 (3.95%) Support Analyst
13 10 (3.29%) Network Engineer
13 10 (3.29%) PL/SQL Developer
13 10 (3.29%) SQL Developer
Libraries, Frameworks & Software Standards
1 41 (13.49%) .NET
2 30 (9.87%) Web Services
3 15 (4.93%) CSS
4 12 (3.95%) J2EE
4 12 (3.95%) Java EE
4 12 (3.95%) Spring
5 11 (3.62%) SOAP
5 11 (3.62%) XML
6 10 (3.29%) HTML
6 10 (3.29%) JSON
6 10 (3.29%) REST
6 10 (3.29%) Ruby on Rails
7 5 (1.64%) .NET Core
7 5 (1.64%) React
8 4 (1.32%) ASP.NET
8 4 (1.32%) Node.js
8 4 (1.32%) Twitter Bootstrap
8 4 (1.32%) YAML
9 2 (0.66%) Oracle Fusion
10 1 (0.33%) Entity Framework
Miscellaneous
1 25 (8.22%) Self-Motivation
2 24 (7.89%) Public Cloud
3 22 (7.24%) Driving Licence
4 21 (6.91%) Mobile App
5 15 (4.93%) NHS
6 11 (3.62%) Management Information System
7 9 (2.96%) Product Ownership
8 7 (2.30%) CCTV
9 6 (1.97%) PKI
10 4 (1.32%) Data Protection Act
11 2 (0.66%) Cybercrime
11 2 (0.66%) IoT
11 2 (0.66%) Legacy Systems
11 2 (0.66%) Operational Technology
11 2 (0.66%) Social Media
11 2 (0.66%) Video Editing
12 1 (0.33%) Data Centre
12 1 (0.33%) Digital Media
12 1 (0.33%) Low-Code
12 1 (0.33%) Security Operations Centre
Operating Systems
1 57 (18.75%) Unix
2 50 (16.45%) Windows
3 29 (9.54%) Linux
4 24 (7.89%) Solaris
5 12 (3.95%) Windows 10
6 6 (1.97%) Windows Server
7 1 (0.33%) Android
7 1 (0.33%) Apple iOS
7 1 (0.33%) Red Hat Enterprise Linux
7 1 (0.33%) SUSE
7 1 (0.33%) Windows Server 2012
7 1 (0.33%) Windows Server 2016
Processes & Methodologies
1 64 (21.05%) ITIL
2 58 (19.08%) Customer Service
3 56 (18.42%) Agile
4 55 (18.09%) Decision-Making
5 40 (13.16%) Problem-Solving
6 36 (11.84%) Data Security
7 32 (10.53%) Risk Management
8 31 (10.20%) Performance Tuning
8 31 (10.20%) Service Management
9 29 (9.54%) Task Automation
10 28 (9.21%) Business Case
10 28 (9.21%) Impact Assessments
11 27 (8.88%) Performance Management
12 24 (7.89%) Network Architecture
12 24 (7.89%) Server Management
13 22 (7.24%) Customer Requirements
13 22 (7.24%) Resource Allocation
14 21 (6.91%) Programme Delivery
14 21 (6.91%) Roadmaps
14 21 (6.91%) User Experience
Programming Languages
1 36 (11.84%) Shell Script
2 23 (7.57%) Java
2 23 (7.57%) PL/1
3 20 (6.58%) SQL
4 18 (5.92%) C#
5 10 (3.29%) C
5 10 (3.29%) PL/SQL
5 10 (3.29%) Ruby
6 5 (1.64%) JavaScript
6 5 (1.64%) VB
7 4 (1.32%) Python
8 3 (0.99%) PowerShell
9 2 (0.66%) C++
10 1 (0.33%) TypeScript
10 1 (0.33%) VBScript
Qualifications
1 146 (48.03%) Security Cleared
2 58 (19.08%) DBS Check
3 53 (17.43%) SC Cleared
4 52 (17.11%) Degree
5 37 (12.17%) DV Cleared
6 21 (6.91%) Oracle Certification
7 10 (3.29%) Computer Science Degree
7 10 (3.29%) Microsoft Certification
8 6 (1.97%) CTC Cleared
9 5 (1.64%) APMP
9 5 (1.64%) HNC
9 5 (1.64%) HND
9 5 (1.64%) Postgraduate
10 4 (1.32%) CISSP
10 4 (1.32%) MCSA
11 3 (0.99%) CESG Certified Professional
12 2 (0.66%) Azure Certification
12 2 (0.66%) CISMP
12 2 (0.66%) CREST Certified
12 2 (0.66%) Master's Degree
Quality Assurance & Compliance
1 101 (33.22%) Accessibility
2 39 (12.83%) QA
3 17 (5.59%) SLA
4 4 (1.32%) ISO/IEC 20000
4 4 (1.32%) ISO/IEC 27001
5 3 (0.99%) Data Quality
6 2 (0.66%) GDPR
6 2 (0.66%) HMG Security Policy Framework
6 2 (0.66%) ISO/IEC 17025
6 2 (0.66%) PCI DSS
6 2 (0.66%) PMO
7 1 (0.33%) NCSC
7 1 (0.33%) NIST
System Software
1 11 (3.62%) Active Directory
2 4 (1.32%) Docker
2 4 (1.32%) Firmware
2 4 (1.32%) VMware Infrastructure
2 4 (1.32%) vSphere
3 3 (0.99%) Virtual Desktop
4 2 (0.66%) Embedded Firmware
5 1 (0.33%) VMware ESXi
Systems Management
1 12 (3.95%) OpenSSO
1 12 (3.95%) Single Sign-On
2 9 (2.96%) SCCM
3 4 (1.32%) Kubernetes
3 4 (1.32%) Microsoft Intune
4 3 (0.99%) Nessus
5 1 (0.33%) SCOM
5 1 (0.33%) Terraform
5 1 (0.33%) vCenter Server
Vendors
1 100 (32.89%) NEC
2 83 (27.30%) Microsoft
3 70 (23.03%) Oracle
4 12 (3.95%) Remedy
5 10 (3.29%) Cisco
6 5 (1.64%) VMware
7 4 (1.32%) Avaya
7 4 (1.32%) Dell
7 4 (1.32%) HP
7 4 (1.32%) SolarWinds
7 4 (1.32%) Zscaler
8 3 (0.99%) Adobe
8 3 (0.99%) ServiceNow
9 2 (0.66%) webMethods
10 1 (0.33%) Blue Prism
10 1 (0.33%) Google
10 1 (0.33%) Salesforce