Unix Job Trends in England

Unix
UK > England

The table below provides summary statistics and salary benchmarking for jobs advertised in England requiring Unix skills. It covers permanent job vacancies from the 6 months leading up to 8 November 2025, with comparisons to the same periods in the previous two years.

6 months to
8 Nov 2025
Same period 2024 Same period 2023
Rank 309 245 209
Rank change year-on-year -64 -36 -21
Permanent jobs citing Unix 352 657 756
As % of all permanent jobs in England 0.80% 1.08% 1.58%
As % of the Operating Systems category 6.66% 8.09% 8.96%
Number of salaries quoted 211 261 583
10th Percentile £39,750 £38,750 £42,000
25th Percentile £43,890 £50,000 £48,445
Median annual salary (50th Percentile) £60,000 £59,125 £64,500
Median % change year-on-year +1.48% -8.33% -0.77%
75th Percentile £80,000 £77,500 £84,056
90th Percentile £90,000 £90,000 £95,000
UK median annual salary £61,250 £60,000 £65,000
% change year-on-year +2.08% -7.69% -

All Operating Systems
England

Unix falls under the Operating Systems category. For comparison with the information above, the following table provides summary statistics for all permanent job vacancies requiring operating system skills in England.

Permanent vacancies with a requirement for operating system skills 5,282 8,120 8,438
As % of all permanent jobs advertised in England 11.93% 13.39% 17.66%
Number of salaries quoted 3,790 4,768 6,892
10th Percentile £26,875 £28,500 £27,500
25th Percentile £31,250 £36,250 £35,000
Median annual salary (50th Percentile) £42,005 £50,000 £50,000
Median % change year-on-year -15.99% - -4.76%
75th Percentile £65,000 £71,375 £68,750
90th Percentile £83,250 £86,250 £88,750
UK median annual salary £42,500 £50,000 £50,000
% change year-on-year -15.00% - -4.76%

Unix
Job Vacancy Trend in England

Historical trend showing the proportion of permanent IT job postings citing Unix relative to all permanent IT jobs advertised in England.
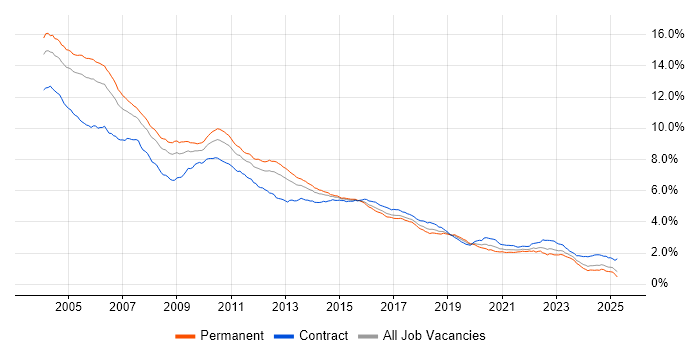
Unix job vacancy trend in England

Unix
Salary Trend in England

Salary distribution trend for jobs in England citing Unix.

Salary distribution trend for jobs in England citing Unix

Unix
Salary Histogram in England

Salary distribution for jobs citing Unix in England over the 6 months to 8 November 2025.

Salary histogram for Unix in England

Unix
Job Locations in England

The table below looks at the demand and provides a guide to the median salaries quoted in IT jobs citing Unix within the England region over the 6 months to 8 November 2025. The 'Rank Change' column provides an indication of the change in demand within each location based on the same 6 month period last year.

Location Rank Change
on Same Period
Last Year
Matching
Permanent
IT Job Ads
Median Salary
Past 6 Months
Median Salary
% Change
on Same Period
Last Year
Live
Jobs
London +19 165 £75,000 +6.76% 223
South East +22 65 £55,000 - 197
South West +31 39 £57,500 -28.13% 12
Midlands +6 29 £73,801 +31.79% 18
East of England -2 29 £43,085 -21.66% 6
North of England -93 23 £51,250 +2.50% 43
West Midlands -4 21 £75,000 +15.38% 12
North West -66 9 £50,000 - 30
East Midlands +11 8 £49,000 -10.91% 4
North East +9 7 £60,651 +10.27% 1
Yorkshire -21 7 £47,500 +18.75% 12
Unix
UK

Unix
Co-Occurring Skills & Capabilities in England by Category

The following tables expand on the one above by listing co-occurrences grouped by category. They cover the same employment type, locality and period, with up to 20 co-occurrences shown in each category:

Application Platforms
1 42 (11.93%) Microsoft Exchange
2 28 (7.95%) Apache Spark
3 26 (7.39%) Exchange Server 2003
4 25 (7.10%) Tomcat
5 22 (6.25%) WebSphere
6 16 (4.55%) WebSphere Application Server
7 8 (2.27%) SharePoint
8 6 (1.70%) Apache
8 6 (1.70%) Confluence
8 6 (1.70%) IIS
9 5 (1.42%) Anypoint
9 5 (1.42%) nginx
9 5 (1.42%) WebLogic
10 4 (1.14%) Oracle Workflow
11 3 (0.85%) Apache Airflow
11 3 (0.85%) SAS
11 3 (0.85%) WebLogic Portal
12 2 (0.57%) JBoss
13 1 (0.28%) NetWeaver
13 1 (0.28%) Oracle SOA Suite
Applications
1 24 (6.82%) Microsoft Office
2 21 (5.97%) Microsoft Excel
Business Applications
1 5 (1.42%) Shopify
2 4 (1.14%) NEC Housing
3 3 (0.85%) Oracle EBS
3 3 (0.85%) Primavera
4 2 (0.57%) Fidessa
4 2 (0.57%) SAP S/4HANA
5 1 (0.28%) ION MarketView
5 1 (0.28%) Oracle BPM
5 1 (0.28%) SAP IBP
Cloud Services
1 117 (33.24%) AWS
2 73 (20.74%) Azure
3 33 (9.38%) GCP
4 30 (8.52%) Amazon S3
5 29 (8.24%) Amazon EKS
6 28 (7.95%) AWS CloudFormation
7 23 (6.53%) Microsoft 365
8 18 (5.11%) Amazon ELB
9 17 (4.83%) Amazon ECR
10 16 (4.55%) Amazon EC2
11 14 (3.98%) Serverless
12 13 (3.69%) OpenShift
12 13 (3.69%) Pulumi
13 12 (3.41%) AWS Lambda
13 12 (3.41%) Entra ID
13 12 (3.41%) SaaS
14 11 (3.13%) Amazon ECS
14 11 (3.13%) dbt
14 11 (3.13%) GitHub
15 10 (2.84%) Power Platform
Communications & Networking
1 30 (8.52%) DNS
2 29 (8.24%) DHCP
2 29 (8.24%) SSL
3 28 (7.95%) Firewall
4 27 (7.67%) TCP/IP
5 13 (3.69%) SAN
6 12 (3.41%) VPN
7 8 (2.27%) VLAN
8 7 (1.99%) HTTPS
9 6 (1.70%) MPLS
9 6 (1.70%) VoIP
9 6 (1.70%) WAN
9 6 (1.70%) Wi-Fi
9 6 (1.70%) Wireshark
10 5 (1.42%) Broadband
10 5 (1.42%) HTTP
10 5 (1.42%) LAN
10 5 (1.42%) Reverse Proxy
11 4 (1.14%) Kerberos
11 4 (1.14%) SMTP
Database & Business Intelligence
1 41 (11.65%) PostgreSQL
2 38 (10.80%) Oracle Database
3 32 (9.09%) Relational Database
4 30 (8.52%) SQL Server
5 27 (7.67%) Oracle Database 10g
6 23 (6.53%) Metadata
7 21 (5.97%) Spark SQL
8 20 (5.68%) DynamoDB
9 19 (5.40%) Amazon RDS
9 19 (5.40%) MySQL
10 18 (5.11%) DB2
10 18 (5.11%) Delta Lake
11 12 (3.41%) Big Data
11 12 (3.41%) NoSQL
11 12 (3.41%) Redis
12 11 (3.13%) Elasticsearch
13 10 (2.84%) Power BI
13 10 (2.84%) Tableau
14 9 (2.56%) Hadoop
15 8 (2.27%) Apache Hive
Development Applications
1 28 (7.95%) Git
2 18 (5.11%) MLflow
3 15 (4.26%) Jenkins
4 14 (3.98%) JIRA
5 5 (1.42%) GitLab
6 4 (1.14%) Cypress.io
6 4 (1.14%) JUnit
6 4 (1.14%) LabVIEW
6 4 (1.14%) Toad
7 3 (0.85%) Bitbucket
7 3 (0.85%) CircleCI
7 3 (0.85%) Maven
7 3 (0.85%) Mocha
7 3 (0.85%) Oracle APEX
7 3 (0.85%) Oracle Forms
7 3 (0.85%) webpack
8 2 (0.57%) Browser DevTools
8 2 (0.57%) Gradle
8 2 (0.57%) Postman
8 2 (0.57%) Sonatype Nexus
General
1 114 (32.39%) Finance
2 99 (28.13%) Social Skills
3 43 (12.22%) Banking
4 29 (8.24%) Analytical Skills
5 26 (7.39%) Law
6 24 (6.82%) Inclusion and Diversity
7 20 (5.68%) Public Sector
8 14 (3.98%) Front Office
9 13 (3.69%) Investment Banking
9 13 (3.69%) Telecoms
10 12 (3.41%) Marketing
11 6 (1.70%) Electronics
12 5 (1.42%) Documentation Skills
12 5 (1.42%) Legal
12 5 (1.42%) Manufacturing
12 5 (1.42%) Organisational Skills
13 4 (1.14%) Advertising
13 4 (1.14%) Back Office
13 4 (1.14%) Financial Institution
13 4 (1.14%) Local Government
Job Titles
1 67 (19.03%) Senior
2 42 (11.93%) Administrator
3 37 (10.51%) Applications Support
4 33 (9.38%) Support Engineer
5 30 (8.52%) Analyst
6 27 (7.67%) Developer
6 27 (7.67%) Systems Administrator
7 26 (7.39%) Linux Support
8 25 (7.10%) 3rd Line Support
9 23 (6.53%) Systems Support
10 21 (5.97%) Support Analyst
11 20 (5.68%) Lead
11 20 (5.68%) Machine Learning Engineer
12 19 (5.40%) Infrastructure Support
13 18 (5.11%) Linux Engineer
13 18 (5.11%) Operations Engineer
14 17 (4.83%) Software Engineer
15 14 (3.98%) Consultant
15 14 (3.98%) Infrastructure Engineer
16 13 (3.69%) Linux Support Engineer
Libraries, Frameworks & Software Standards
1 22 (6.25%) LDAP
2 21 (5.97%) PySpark
2 21 (5.97%) REST
3 20 (5.68%) JSON
3 20 (5.68%) NumPy
3 20 (5.68%) Pandas
3 20 (5.68%) PyTorch
3 20 (5.68%) TensorFlow
4 18 (5.11%) Keras
4 18 (5.11%) Lambda Expressions
4 18 (5.11%) Metaflow
4 18 (5.11%) OAuth
4 18 (5.11%) scikit-learn
4 18 (5.11%) WebSphere MQ
4 18 (5.11%) XML
4 18 (5.11%) YAML
5 17 (4.83%) FIX Protocol
5 17 (4.83%) LAPP Stack
6 16 (4.55%) HTML
7 13 (3.69%) Regular Expression
Miscellaneous
1 60 (17.05%) Linux Command Line
2 25 (7.10%) e-Learning
3 21 (5.97%) Onboarding
4 16 (4.55%) Management Information System
5 13 (3.69%) Distributed Systems
5 13 (3.69%) Product Ownership
6 12 (3.41%) Algorithms
7 10 (2.84%) PKI
8 9 (2.56%) Data Structures
8 9 (2.56%) Public Cloud
9 8 (2.27%) Private Cloud
10 7 (1.99%) Replication
11 6 (1.70%) Cyber Kill Chain
11 6 (1.70%) Data Centre
11 6 (1.70%) Driving Licence
11 6 (1.70%) Equities
11 6 (1.70%) Hybrid Cloud
11 6 (1.70%) Low-Code
12 5 (1.42%) Foreign Exchange (FX)
12 5 (1.42%) Self-Motivation
Operating Systems
1 223 (63.35%) Linux
2 112 (31.82%) Windows
3 52 (14.77%) Solaris
4 34 (9.66%) Red Hat Enterprise Linux
5 31 (8.81%) HPUX
6 26 (7.39%) Windows Server 2003
7 23 (6.53%) Windows Server
8 22 (6.25%) Windows 7
8 22 (6.25%) Windows Server 2008
9 12 (3.41%) Mac OS
10 11 (3.13%) CentOS
11 9 (2.56%) Debian
12 5 (1.42%) AIX
13 4 (1.14%) Apple iOS
13 4 (1.14%) Oracle Linux
14 3 (0.85%) Ubuntu
15 1 (0.28%) Android
15 1 (0.28%) CoreOS
15 1 (0.28%) SUSE
15 1 (0.28%) Windows Server 2016
Processes & Methodologies
1 89 (25.28%) Problem-Solving
2 64 (18.18%) Agile
3 59 (16.76%) CI/CD
4 53 (15.06%) DevOps
5 51 (14.49%) ITIL
6 47 (13.35%) High Availability
7 45 (12.78%) AI
8 43 (12.22%) SDLC
9 37 (10.51%) Machine Learning
10 36 (10.23%) Incident Management
11 35 (9.94%) Containerisation
12 34 (9.66%) Infrastructure as Code
13 33 (9.38%) Software Engineering
14 30 (8.52%) Visualisation
15 29 (8.24%) Computer Science
16 28 (7.95%) Change Management
16 28 (7.95%) Data Science
16 28 (7.95%) Time Management
17 27 (7.67%) Incident Response
18 26 (7.39%) Innovative Thinking
Programming Languages
1 179 (50.85%) Python
2 110 (31.25%) SQL
3 51 (14.49%) PowerShell
4 49 (13.92%) Bash
5 36 (10.23%) Java
6 35 (9.94%) Shell Script
7 33 (9.38%) JavaScript
8 26 (7.39%) Perl
9 15 (4.26%) C#
9 15 (4.26%) R
10 10 (2.84%) PL/SQL
10 10 (2.84%) TypeScript
11 9 (2.56%) C++
12 8 (2.27%) C
12 8 (2.27%) Korn
13 6 (1.70%) Go
13 6 (1.70%) MATLAB
14 4 (1.14%) Fortran
14 4 (1.14%) VB
15 3 (0.85%) VBA
Qualifications
1 99 (28.13%) Security Cleared
2 86 (24.43%) SC Cleared
3 85 (24.15%) Degree
4 59 (16.76%) DV Cleared
5 31 (8.81%) CCNA
5 31 (8.81%) Cisco Certification
6 27 (7.67%) AWS Certification
7 25 (7.10%) CCNP
8 19 (5.40%) Computer Science Degree
8 19 (5.40%) ITIL Certification
9 13 (3.69%) CISA
9 13 (3.69%) CISSP
10 11 (3.13%) Network+ Certification
11 8 (2.27%) Master's Degree
11 8 (2.27%) PhD
12 7 (1.99%) ACCA
12 7 (1.99%) CIMA
13 6 (1.70%) GCFA
13 6 (1.70%) GCIA
13 6 (1.70%) GCIH
Quality Assurance & Compliance
1 50 (14.20%) SLA
2 14 (3.98%) ISO/IEC 27001
3 11 (3.13%) GDPR
4 8 (2.27%) NIST
4 8 (2.27%) QA
5 5 (1.42%) Cyber Essentials
5 5 (1.42%) ITGC
6 4 (1.14%) Cyber Essentials PLUS
7 3 (0.85%) COBIT
7 3 (0.85%) Data Quality
8 1 (0.28%) Sarbanes-Oxley
System Software
1 63 (17.90%) Docker
2 55 (15.63%) Active Directory
3 22 (6.25%) VMware Infrastructure
4 5 (1.42%) Hyper-V
4 5 (1.42%) Virtual Desktop
4 5 (1.42%) XenApp
4 5 (1.42%) XenDesktop
5 3 (0.85%) Apache Flume
5 3 (0.85%) HDFS
6 1 (0.28%) KVM
6 1 (0.28%) Oracle RAC
6 1 (0.28%) Virtual Machines
6 1 (0.28%) Xen
Systems Management
1 53 (15.06%) Terraform
2 44 (12.50%) Kubernetes
3 42 (11.93%) Ansible
4 26 (7.39%) Grafana
5 18 (5.11%) Kubeflow
5 18 (5.11%) Microsoft Intune
6 10 (2.84%) SCCM
7 9 (2.56%) Prometheus
8 8 (2.27%) Single Sign-On
9 7 (1.99%) Progress Chef
10 6 (1.70%) AWS Copilot
10 6 (1.70%) Jamf Pro
11 5 (1.42%) FortiGate
12 4 (1.14%) Puppet
13 3 (0.85%) Argo
13 3 (0.85%) Kibana
13 3 (0.85%) logstash
13 3 (0.85%) Netcool
13 3 (0.85%) Oozie
13 3 (0.85%) Oracle Enterprise Manager
Vendors
1 87 (24.72%) Oracle
2 81 (23.01%) Microsoft
3 53 (15.06%) VMware
4 39 (11.08%) Cisco
5 37 (10.51%) Google
5 37 (10.51%) Red Hat
6 31 (8.81%) IBM
7 23 (6.53%) Databricks
7 23 (6.53%) SAP
8 15 (4.26%) ServiceNow
9 14 (3.98%) Splunk
10 12 (3.41%) Fortinet
11 11 (3.13%) Dell
12 10 (2.84%) Apple
12 10 (2.84%) Atlassian
13 8 (2.27%) IFS
13 8 (2.27%) Informatica
13 8 (2.27%) NetApp
14 7 (1.99%) Dynatrace
14 7 (1.99%) Palo Alto