Oracle Database Jobs in England

Oracle Database (Oracle RDBMS)
UK > England

The table below provides summary statistics for permanent job vacancies advertised in England requiring Oracle Database skills. It includes a benchmarking guide to the annual salaries offered in vacancies that cited Oracle Database over the 6 months leading up to 26 July 2024, comparing them to the same period in the previous two years.

6 months to
26 Jul 2024
Same period 2023 Same period 2022
Rank 524 448 563
Rank change year-on-year -76 +115 -115
Permanent jobs citing Oracle Database 295 450 822
As % of all permanent jobs advertised in England 0.38% 0.63% 0.56%
As % of the Database & Business Intelligence category 2.36% 3.01% 2.06%
Number of salaries quoted 99 305 376
10th Percentile £40,626 £37,875 £38,068
25th Percentile £44,875 £40,000 £42,500
Median annual salary (50th Percentile) £59,125 £55,000 £56,500
Median % change year-on-year +7.50% -2.65% +4.63%
75th Percentile £72,500 £72,433 £70,000
90th Percentile £83,750 £82,548 £85,000
UK median annual salary £57,500 £55,000 £55,000
% change year-on-year +4.55% - +1.85%

All Database and Business Intelligence Skills
England

Oracle Database falls under the Databases and Business Intelligence category. For comparison with the information above, the following table provides summary statistics for all permanent job vacancies requiring database or business intelligence skills in England.

Permanent vacancies with a requirement for database or business intelligence skills 12,495 14,926 39,989
As % of all permanent jobs advertised in England 15.95% 21.00% 27.20%
Number of salaries quoted 8,650 10,674 19,065
10th Percentile £36,250 £37,500 £36,250
25th Percentile £45,000 £47,500 £45,491
Median annual salary (50th Percentile) £60,000 £65,000 £60,000
Median % change year-on-year -7.69% +8.33% +9.09%
75th Percentile £84,188 £82,500 £81,250
90th Percentile £112,500 £100,000 £97,500
UK median annual salary £60,000 £62,500 £60,000
% change year-on-year -4.00% +4.17% +9.09%

Oracle Database
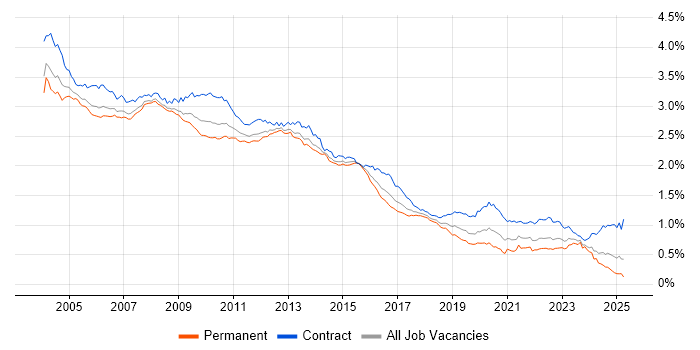
Job Vacancy Trend in England

Job postings citing Oracle Database as a proportion of all IT jobs advertised in England.

Job vacancy trend for Oracle Database in England

Oracle Database
Salary Trend in England

3-month moving average salary quoted in jobs citing Oracle Database in England.

Salary trend for Oracle Database in England

Oracle Database
Salary Histogram in England

Salary distribution for jobs citing Oracle Database in England over the 6 months to 26 July 2024.

Salary histogram for Oracle Database in England

Oracle Database
Job Locations in England

The table below looks at the demand and provides a guide to the median salaries quoted in IT jobs citing Oracle Database within the England region over the 6 months to 26 July 2024. The 'Rank Change' column provides an indication of the change in demand within each location based on the same 6 month period last year.

Location Rank Change
on Same Period
Last Year
Matching
Permanent
IT Job Ads
Median Salary
Past 6 Months
Median Salary
% Change
on Same Period
Last Year
Live
Jobs
South East +24 82 £60,000 +14.29% 8
London +32 69 £72,500 +12.84% 14
North of England -36 53 £45,445 -9.11% 8
Midlands -13 46 £45,856 +3.63% 2
North West -19 41 £44,322 -11.36% 2
South West -26 31 £57,500 -14.46% 3
West Midlands +10 30 £46,500 +17.30% 1
East Midlands -33 16 £37,500 -33.33% 1
Yorkshire +29 10 £48,973 -6.72% 6
East of England -50 10 £42,500 -19.05% 1
North East -18 2 £52,500 +10.13%
Oracle Database
UK

Oracle Database
Co-occurring Skills and Capabilities in England by Category

The follow tables expand on the table above by listing co-occurrences grouped by category. The same employment type, locality and period is covered with up to 20 co-occurrences shown in each of the following categories:

Application Platforms
1 36 (12.20%) Camunda
1 36 (12.20%) nginx
2 33 (11.19%) WebLogic
3 32 (10.85%) IIS
4 28 (9.49%) Apache
5 27 (9.15%) Tomcat
6 8 (2.71%) JBoss
7 6 (2.03%) SharePoint
8 5 (1.69%) WebSphere
9 4 (1.36%) SAS
10 3 (1.02%) GlassFish
10 3 (1.02%) Oracle Service Bus
11 2 (0.68%) Mule
11 2 (0.68%) Oracle Workflow
12 1 (0.34%) Confluence
12 1 (0.34%) Oracle SOA Suite
Applications
1 16 (5.42%) Microsoft Excel
2 10 (3.39%) Microsoft Office
3 5 (1.69%) MS Visio
4 2 (0.68%) SPSS
5 1 (0.34%) Microsoft Project
Business Applications
1 56 (18.98%) NEC Housing
2 28 (9.49%) Sparx Enterprise Architect
3 3 (1.02%) Remedy ITSM
4 1 (0.34%) FLEXCUBE
4 1 (0.34%) Misys Opics
4 1 (0.34%) Oracle Applications
4 1 (0.34%) SAP ERP
4 1 (0.34%) Teamcenter
Cloud Services
1 68 (23.05%) AWS
2 63 (21.36%) Azure
3 36 (12.20%) OpenShift
4 35 (11.86%) IBM Cloud
5 32 (10.85%) Power Platform
6 28 (9.49%) Amazon EKS
6 28 (9.49%) Amazon SQS
7 26 (8.81%) SaaS
8 8 (2.71%) Azure Synapse Analytics
8 8 (2.71%) Nutanix
9 6 (2.03%) Microsoft 365
10 5 (1.69%) OCI
11 3 (1.02%) Snowflake
12 2 (0.68%) Azure Data Factory
12 2 (0.68%) Azure Logic Apps
13 1 (0.34%) Cloud Computing
13 1 (0.34%) Entra ID
13 1 (0.34%) GCP
13 1 (0.34%) IaaS
13 1 (0.34%) PaaS
Communications & Networking
1 32 (10.85%) DNS
2 28 (9.49%) BGP
2 28 (9.49%) SSL
2 28 (9.49%) TCP/IP
3 5 (1.69%) Firewall
4 4 (1.36%) DHCP
5 3 (1.02%) Reverse Proxy
6 1 (0.34%) FTP
6 1 (0.34%) PSTN
6 1 (0.34%) SAN
6 1 (0.34%) VPN
Database & Business Intelligence
1 111 (37.63%) SQL Server
2 50 (16.95%) Relational Database
3 41 (13.90%) PostgreSQL
4 38 (12.88%) MongoDB
4 38 (12.88%) RDBMS
5 33 (11.19%) Oracle Database 12c
6 30 (10.17%) Amazon RDS
6 30 (10.17%) Power BI
7 29 (9.83%) Data Warehouse
8 22 (7.46%) SQL Server Reporting Services
9 21 (7.12%) Oracle Database 11g
10 20 (6.78%) SQL Server Integration Services
11 10 (3.39%) SQL Server Analysis Services
12 9 (3.05%) MySQL
13 5 (1.69%) BusinessObjects
13 5 (1.69%) PowerCenter
14 4 (1.36%) Data Mining
14 4 (1.36%) DB2
14 4 (1.36%) SAP HANA
14 4 (1.36%) Tableau
Development Applications
1 22 (7.46%) Oracle APEX
2 15 (5.08%) Oracle Forms
3 9 (3.05%) Toad
4 6 (2.03%) Team Foundation Server
4 6 (2.03%) Visual Studio
5 3 (1.02%) JIRA
6 1 (0.34%) Git
6 1 (0.34%) GitLab
6 1 (0.34%) NUnit
General
1 106 (35.93%) Social Skills
2 96 (32.54%) Finance
3 90 (30.51%) Public Sector
4 56 (18.98%) Local Government
5 55 (18.64%) Police
6 51 (17.29%) Analytical Skills
7 36 (12.20%) Inclusion and Diversity
8 27 (9.15%) Back Office
9 20 (6.78%) Banking
10 8 (2.71%) Legal
11 5 (1.69%) Front Office
11 5 (1.69%) Retail
12 4 (1.36%) Aerospace
12 4 (1.36%) Law
13 3 (1.02%) Pharmaceutical
14 2 (0.68%) Manufacturing
14 2 (0.68%) Presentation Skills
15 1 (0.34%) Games
15 1 (0.34%) Organisational Skills
15 1 (0.34%) Telecoms
Job Titles
1 63 (21.36%) Developer
2 58 (19.66%) DBA
3 42 (14.24%) Oracle DBA
4 37 (12.54%) Administrator
4 37 (12.54%) Senior
5 36 (12.20%) Full Stack Engineer
5 36 (12.20%) Lead
6 35 (11.86%) Applications Support
6 35 (11.86%) Architect
7 30 (10.17%) Solutions Architect
8 28 (9.49%) Analyst
8 28 (9.49%) Lead Architect
8 28 (9.49%) Lead Solutions Architect
9 23 (7.80%) Database Developer
10 21 (7.12%) PostgreSQL DBA
11 19 (6.44%) Senior Developer
12 18 (6.10%) Oracle Developer
13 15 (5.08%) SQL Developer
14 14 (4.75%) Infrastructure Engineer
14 14 (4.75%) Support Analyst
Libraries, Frameworks & Software Standards
1 36 (12.20%) KeystoneJS
1 36 (12.20%) Node.js
1 36 (12.20%) React
1 36 (12.20%) Swagger
2 30 (10.17%) Web Services
3 29 (9.83%) Spring Boot
4 28 (9.49%) RabbitMQ
5 27 (9.15%) HTML
6 25 (8.47%) JSON
7 21 (7.12%) CSS
7 21 (7.12%) REST
8 17 (5.76%) .NET
9 12 (4.07%) XML
10 11 (3.73%) jQuery
11 10 (3.39%) Ruby on Rails
11 10 (3.39%) SOAP
12 6 (2.03%) ASP.NET
12 6 (2.03%) LINQ
12 6 (2.03%) WinForms
13 5 (1.69%) FIX Protocol
Miscellaneous
1 52 (17.63%) Public Cloud
2 36 (12.20%) e-Learning
3 35 (11.86%) Blockchain
3 35 (11.86%) Hybrid Cloud
4 31 (10.51%) Enterprise Software
5 24 (8.14%) Driving Licence
6 23 (7.80%) Management Information System
6 23 (7.80%) Self-Motivation
7 14 (4.75%) Data Centre
8 11 (3.73%) IoT
9 10 (3.39%) NHS
10 6 (2.03%) Blog
10 6 (2.03%) Chip and PIN
10 6 (2.03%) Legacy Systems
11 5 (1.69%) Clustering
11 5 (1.69%) Distributed Denial-of-Service
11 5 (1.69%) Onboarding
11 5 (1.69%) Operational Technology
11 5 (1.69%) Smart Energy
11 5 (1.69%) Smart Meter
Operating Systems
1 96 (32.54%) Linux
2 74 (25.08%) Unix
3 68 (23.05%) Windows
4 32 (10.85%) Solaris
5 29 (9.83%) Red Hat Enterprise Linux
6 22 (7.46%) Windows Server
7 8 (2.71%) AIX
8 6 (2.03%) VMS
9 2 (0.68%) Windows Server 2016
9 2 (0.68%) Windows Server 2019
10 1 (0.34%) Windows 10
Processes & Methodologies
1 72 (24.41%) Performance Tuning
2 70 (23.73%) Customer Service
3 69 (23.39%) SDLC
4 58 (19.66%) Mentoring
5 56 (18.98%) Artificial Intelligence
5 56 (18.98%) Migration
6 50 (16.95%) Data Migration
6 50 (16.95%) ITIL
7 48 (16.27%) Actionable Insight
8 42 (14.24%) Full Stack Development
9 41 (13.90%) Agile
9 41 (13.90%) Coaching
10 38 (12.88%) Business Intelligence
10 38 (12.88%) Collaborative Working
11 37 (12.54%) Data Security
12 34 (11.53%) Problem-Solving
13 33 (11.19%) Project Management
13 33 (11.19%) Technology Transformation
14 31 (10.51%) Scrum
15 30 (10.17%) Re-Platforming
Programming Languages
1 164 (55.59%) SQL
2 87 (29.49%) PL/SQL
3 64 (21.69%) Java
4 59 (20.00%) JavaScript
5 36 (12.20%) Lua
6 35 (11.86%) Shell Script
7 24 (8.14%) PowerShell
8 21 (7.12%) T-SQL
9 19 (6.44%) Python
10 11 (3.73%) C#
11 10 (3.39%) C
11 10 (3.39%) Ruby
12 7 (2.37%) VB
13 6 (2.03%) Delphi
14 5 (1.69%) R
15 3 (1.02%) VB.NET
16 1 (0.34%) Bash
16 1 (0.34%) C++
16 1 (0.34%) ProC
Qualifications
1 100 (33.90%) Security Cleared
2 75 (25.42%) Degree
3 36 (12.20%) SC Cleared
4 31 (10.51%) Azure Certification
4 31 (10.51%) Oracle Certification
5 28 (9.49%) AWS Certification
5 28 (9.49%) AWS Certified Solutions Architect
6 12 (4.07%) Computer Science Degree
7 10 (3.39%) DBS Check
8 8 (2.71%) OCP
9 3 (1.02%) DV Cleared
9 3 (1.02%) Microsoft Certification
10 2 (0.68%) ITIL Foundation Certificate
10 2 (0.68%) SAS Certification
11 1 (0.34%) HNC
11 1 (0.34%) HND
11 1 (0.34%) ITIL Certification
11 1 (0.34%) MCSA
11 1 (0.34%) MCSE
11 1 (0.34%) VMware Certified Professional (VCP)
Quality Assurance & Compliance
1 55 (18.64%) Accessibility
2 19 (6.44%) SLA
3 14 (4.75%) ISO/IEC 27001
4 8 (2.71%) QA
5 7 (2.37%) GDPR
6 1 (0.34%) Data Quality
6 1 (0.34%) ISO/IEC 27002 (supersedes ISO/IEC 17799)
6 1 (0.34%) ITGC
6 1 (0.34%) NIST
6 1 (0.34%) Software Quality Assurance
System Software
1 36 (12.20%) Docker
2 15 (5.08%) VMware Infrastructure
3 11 (3.73%) Active Directory
4 8 (2.71%) Oracle RAC
5 2 (0.68%) Virtual Machines
6 1 (0.34%) Firmware
6 1 (0.34%) PowerHA
6 1 (0.34%) Veritas Cluster Server
6 1 (0.34%) VMware ESXi
6 1 (0.34%) vSphere
Systems Management
1 12 (4.07%) Oracle RMAN
2 9 (3.05%) Data Guard
3 6 (2.03%) Oracle Enterprise Manager
4 5 (1.69%) Single Sign-On
5 3 (1.02%) NetBackup
5 3 (1.02%) Oracle Statspack
6 1 (0.34%) Ansible
6 1 (0.34%) Microsoft Intune
6 1 (0.34%) Nagios
6 1 (0.34%) Nessus
6 1 (0.34%) nmon
6 1 (0.34%) SCOM
6 1 (0.34%) SCOrch
6 1 (0.34%) vCenter Server
Vendors
1 295 (100.00%) Oracle
2 85 (28.81%) Microsoft
3 56 (18.98%) NEC
4 50 (16.95%) Red Hat
5 40 (13.56%) IBM
6 28 (9.49%) Sparx
7 18 (6.10%) VMware
8 15 (5.08%) Cisco
9 14 (4.75%) HP
10 9 (3.05%) Dell
11 8 (2.71%) Veeam
12 7 (2.37%) SAP
13 6 (2.03%) Informatica
13 6 (2.03%) ServiceNow
14 4 (1.36%) Alteryx
14 4 (1.36%) SolarWinds
15 3 (1.02%) Anaplan
15 3 (1.02%) ION Trading
15 3 (1.02%) Jedox
15 3 (1.02%) New Relic