Red Hat Jobs in England

Red Hat
UK > England

The table below provides summary statistics for permanent job vacancies advertised in England requiring knowledge or experience of Red Hat products and/or services. It includes a benchmarking guide to the annual salaries offered in vacancies that cited Red Hat over the 6 months leading up to 1 May 2025, comparing them to the same period in the previous two years.

The figures below represent the IT labour market in general and are not representative of salaries within Red Hat, Inc.

6 months to
1 May 2025
Same period 2024 Same period 2023
Rank 403 274 394
Rank change year-on-year -129 +120 +71
Permanent jobs citing Red Hat 272 853 754
As % of all permanent jobs advertised in England 0.59% 1.00% 0.81%
As % of the Vendors category 1.61% 2.69% 1.95%
Number of salaries quoted 143 290 373
10th Percentile £39,000 £41,500 £41,931
25th Percentile £53,125 £46,250 £50,000
Median annual salary (50th Percentile) £65,000 £60,000 £62,500
Median % change year-on-year +8.33% -4.00% +4.17%
75th Percentile £78,750 £81,500 £77,715
90th Percentile £88,500 £102,500 £110,000
UK median annual salary £65,000 £55,000 £62,500
% change year-on-year +18.18% -12.00% +4.17%

All Vendors
England

Red Hat falls under the Vendor Products and Services category. For comparison with the information above, the following table provides summary statistics for all permanent job vacancies requiring knowledge or experience of all vendor products and services in England.

Permanent vacancies with a requirement for knowledge or experience of vendor products and services 16,930 31,717 38,620
As % of all permanent jobs advertised in England 36.76% 37.23% 41.74%
Number of salaries quoted 10,620 22,896 22,126
10th Percentile £28,500 £26,500 £30,932
25th Percentile £38,806 £35,924 £41,125
Median annual salary (50th Percentile) £55,000 £50,000 £56,500
Median % change year-on-year +10.00% -11.50% +2.73%
75th Percentile £71,250 £68,750 £75,294
90th Percentile £90,000 £87,500 £93,750
UK median annual salary £55,000 £50,000 £57,500
% change year-on-year +10.00% -13.04% +4.55%

Red Hat
Job Vacancy Trend in England

Job postings citing Red Hat as a proportion of all IT jobs advertised in England.
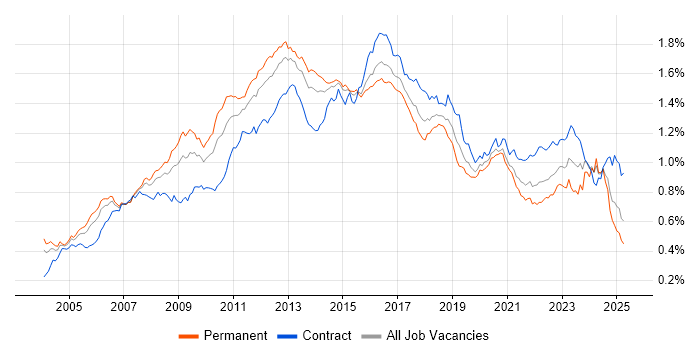
Job vacancy trend for Red Hat in England

Red Hat
Salary Trend in England

3-month moving average salary quoted in jobs citing Red Hat in England.

Salary trend for Red Hat in England

Red Hat
Salary Histogram in England

Salary distribution for jobs citing Red Hat in England over the 6 months to 1 May 2025.

Salary histogram for Red Hat in England

Red Hat
Job Locations in England

The table below looks at the demand and provides a guide to the median salaries quoted in IT jobs citing Red Hat within the England region over the 6 months to 1 May 2025. The 'Rank Change' column provides an indication of the change in demand within each location based on the same 6 month period last year.

Location Rank Change
on Same Period
Last Year
Matching
Permanent
IT Job Ads
Median Salary
Past 6 Months
Median Salary
% Change
on Same Period
Last Year
Live
Jobs
London +34 97 £72,500 -14.71% 69
South East -17 70 £65,000 +30.00% 42
North of England -35 47 £62,205 +24.41% 35
North West -76 33 £55,000 -21.43% 23
Midlands +21 27 £31,250 -37.50% 44
East Midlands -17 16 - - 22
Yorkshire +64 13 £70,000 +48.94% 10
South West -27 13 £69,000 +31.43% 28
East of England +41 12 £57,500 -4.17% 13
West Midlands +57 11 £31,250 -47.92% 21
North East +49 1 £55,000 +10.00% 2
Red Hat
UK

Red Hat
Co-occurring Skills and Capabilities in England by Category

The follow tables expand on the table above by listing co-occurrences grouped by category. The same employment type, locality and period is covered with up to 20 co-occurrences shown in each of the following categories:

Application Platforms
1 17 (6.25%) nginx
2 16 (5.88%) Apache
3 12 (4.41%) Apache Airflow
3 12 (4.41%) Microsoft Exchange
4 10 (3.68%) Apache Spark
5 8 (2.94%) Camunda
6 7 (2.57%) Oracle SOA Suite
6 7 (2.57%) Tomcat
7 6 (2.21%) Confluence
7 6 (2.21%) SharePoint
8 4 (1.47%) IIS
9 3 (1.10%) WinCC
10 1 (0.37%) ColdFusion
10 1 (0.37%) Drupal
10 1 (0.37%) JBoss
Applications
1 3 (1.10%) Microsoft Excel
2 1 (0.37%) Trello
Business Applications
1 12 (4.41%) PeopleSoft HCM
2 8 (2.94%) Fidessa
3 7 (2.57%) Oracle EBS
4 6 (2.21%) Oracle Procure-to-Pay
5 3 (1.10%) Remedy ITSM
6 2 (0.74%) SAP Oil and Gas
7 1 (0.37%) iTrent
Cloud Services
1 68 (25.00%) AWS
2 59 (21.69%) Azure
3 48 (17.65%) IBM Cloud
4 28 (10.29%) OpenShift
5 19 (6.99%) Azure DevOps
6 17 (6.25%) OCI
6 17 (6.25%) PaaS
7 14 (5.15%) GitHub
7 14 (5.15%) SaaS
8 11 (4.04%) Microsoft 365
9 10 (3.68%) Amazon ECR
9 10 (3.68%) Cloud Computing
10 8 (2.94%) GCP
11 6 (2.21%) Amazon CloudWatch
11 6 (2.21%) Amazon S3
12 5 (1.84%) Amazon ECS
12 5 (1.84%) Amazon EKS
12 5 (1.84%) Azure ExpressRoute
12 5 (1.84%) Nutanix
12 5 (1.84%) Route 53
Communications & Networking
1 26 (9.56%) DNS
2 25 (9.19%) TCP/IP
3 21 (7.72%) Firewall
4 17 (6.25%) DHCP
5 12 (4.41%) Ethernet
6 11 (4.04%) Cisco ISE
6 11 (4.04%) MPLS
7 9 (3.31%) SAN
8 8 (2.94%) FIX Connectivity
9 7 (2.57%) NAS
9 7 (2.57%) Wireshark
10 6 (2.21%) SSL
11 5 (1.84%) VPN
12 4 (1.47%) Intrusion Detection
12 4 (1.47%) LAN
12 4 (1.47%) VLAN
13 3 (1.10%) Multicast
13 3 (1.10%) Unified Communications
13 3 (1.10%) VSAN
13 3 (1.10%) WAN
Database & Business Intelligence
1 18 (6.62%) SQL Server
2 15 (5.51%) PostgreSQL
3 12 (4.41%) Data Warehouse
3 12 (4.41%) MySQL
3 12 (4.41%) NoSQL
4 10 (3.68%) Amazon RDS
4 10 (3.68%) Hadoop
5 9 (3.31%) Apache Hudi
5 9 (3.31%) Apache Iceberg
5 9 (3.31%) Delta Lake
5 9 (3.31%) MongoDB
6 8 (2.94%) Oracle Database
6 8 (2.94%) Oracle Reports
7 7 (2.57%) Elasticsearch
7 7 (2.57%) Oracle ODI
8 4 (1.47%) Amazon Aurora
8 4 (1.47%) Relational Database
9 3 (1.10%) Airbyte
9 3 (1.10%) Metadata
9 3 (1.10%) Qlik Sense
Development Applications
1 42 (15.44%) Git
2 18 (6.62%) Maven
3 16 (5.88%) Jenkins
4 14 (5.15%) Bitbucket
4 14 (5.15%) GitLab
5 9 (3.31%) Robot Framework
6 6 (2.21%) JDeveloper
6 6 (2.21%) Oracle Forms
7 5 (1.84%) JUnit
8 4 (1.47%) JIRA
8 4 (1.47%) SonarQube
9 3 (1.10%) Cucumber
9 3 (1.10%) Mockito
9 3 (1.10%) Postman
9 3 (1.10%) Selenium
9 3 (1.10%) TestNG
10 1 (0.37%) Eclipse
10 1 (0.37%) NetBeans
10 1 (0.37%) Octopus Deploy
10 1 (0.37%) Subversion
General
1 69 (25.37%) Public Sector
2 60 (22.06%) Inclusion and Diversity
3 51 (18.75%) Finance
4 33 (12.13%) Social Skills
5 26 (9.56%) Banking
6 23 (8.46%) Analytical Skills
7 16 (5.88%) Law
8 7 (2.57%) Spanish Language
9 6 (2.21%) Dutch Language
9 6 (2.21%) Manufacturing
10 5 (1.84%) Aerospace
10 5 (1.84%) Police
10 5 (1.84%) Telecoms
11 4 (1.47%) Back Office
12 3 (1.10%) Military
12 3 (1.10%) Presentation Skills
13 2 (0.74%) German Language
14 1 (0.37%) Financial Institution
14 1 (0.37%) Investment Banking
14 1 (0.37%) Retail
Job Titles
1 40 (14.71%) Senior
2 26 (9.56%) DevOps Engineer
3 25 (9.19%) Administrator
4 22 (8.09%) Systems Administrator
5 20 (7.35%) Linux Administrator
5 20 (7.35%) Linux Systems Administrator
6 19 (6.99%) Java Engineer
7 18 (6.62%) Architect
8 16 (5.88%) Infrastructure Engineer
9 15 (5.51%) Analyst
9 15 (5.51%) AWS Engineer
10 14 (5.15%) Azure Engineer
10 14 (5.15%) Senior Java Engineer
11 13 (4.78%) Software Engineer
12 12 (4.41%) Data Engineer
12 12 (4.41%) Developer
12 12 (4.41%) Lead
12 12 (4.41%) Linux Engineer
12 12 (4.41%) Oracle Specialist
13 11 (4.04%) Linux Support
Libraries, Frameworks & Software Standards
1 19 (6.99%) React
2 15 (5.51%) Kafka
3 11 (4.04%) FIX Protocol
3 11 (4.04%) Node.js
3 11 (4.04%) Swagger
4 10 (3.68%) Middleware
5 9 (3.31%) Django
5 9 (3.31%) PyArrow
5 9 (3.31%) PySpark
6 8 (2.94%) KeystoneJS
6 8 (2.94%) REST
6 8 (2.94%) XML
7 6 (2.21%) Elastic Stack
8 5 (1.84%) GWT
8 5 (1.84%) J2EE
8 5 (1.84%) JPA
8 5 (1.84%) Vaadin
9 4 (1.47%) RESTful
9 4 (1.47%) Spring
9 4 (1.47%) Spring Boot
Miscellaneous
1 79 (29.04%) Hybrid Cloud
2 53 (19.49%) e-Learning
3 48 (17.65%) Blockchain
4 20 (7.35%) Data Centre
5 17 (6.25%) Management Information System
6 16 (5.88%) Clustering
7 9 (3.31%) Public Cloud
8 8 (2.94%) Eurex
9 7 (2.57%) Equities
9 7 (2.57%) Fixed Income
10 6 (2.21%) Derivative
10 6 (2.21%) Replication
11 5 (1.84%) Life Science
11 5 (1.84%) Linux Command Line
11 5 (1.84%) Mobile App
12 4 (1.47%) Bitcoin
12 4 (1.47%) SCADA
13 3 (1.10%) Enterprise Storage
13 3 (1.10%) NHS
13 3 (1.10%) Reference Data
Operating Systems
1 162 (59.56%) Linux
2 90 (33.09%) Red Hat Enterprise Linux
3 45 (16.54%) Windows
4 37 (13.60%) Unix
5 35 (12.87%) CentOS
6 25 (9.19%) Rocky
7 24 (8.82%) Ubuntu
8 22 (8.09%) Windows Server
9 12 (4.41%) Solaris
10 8 (2.94%) Debian
11 6 (2.21%) Oracle Linux
12 5 (1.84%) Windows Server 2019
13 4 (1.47%) AIX
13 4 (1.47%) Windows Server 2016
13 4 (1.47%) zOS
14 3 (1.10%) SUSE
14 3 (1.10%) VMS
14 3 (1.10%) Windows Server 2012
15 1 (0.37%) Amazon Linux
15 1 (0.37%) Windows 7
Processes & Methodologies
1 94 (34.56%) DevOps
2 77 (28.31%) Artificial Intelligence
3 67 (24.63%) Mentoring
4 54 (19.85%) Agile
5 53 (19.49%) Coaching
6 46 (16.91%) CI/CD
7 45 (16.54%) Customer Service
8 39 (14.34%) Configuration Management
9 38 (13.97%) Problem-Solving
10 35 (12.87%) SDLC
11 33 (12.13%) Containerisation
12 31 (11.40%) ITIL
13 30 (11.03%) Software Engineering
14 22 (8.09%) Continuous Improvement
14 22 (8.09%) Disaster Recovery
14 22 (8.09%) OO
15 21 (7.72%) Infrastructure as Code
15 21 (7.72%) Test Automation
16 20 (7.35%) Performance Monitoring
17 19 (6.99%) Infrastructure Engineering
Programming Languages
1 75 (27.57%) Python
2 56 (20.59%) SQL
3 44 (16.18%) Bash
4 39 (14.34%) Java
5 36 (13.24%) PowerShell
6 24 (8.82%) JavaScript
7 19 (6.99%) Perl
8 17 (6.25%) C++
9 8 (2.94%) Lua
10 6 (2.21%) C#
10 6 (2.21%) Shell Script
11 3 (1.10%) C
11 3 (1.10%) PHP
11 3 (1.10%) R
11 3 (1.10%) T-SQL
11 3 (1.10%) VB
12 2 (0.74%) AWK
12 2 (0.74%) Go
12 2 (0.74%) Kusto Query Language
12 2 (0.74%) Ruby
Qualifications
1 71 (26.10%) Security Cleared
2 29 (10.66%) Degree
3 27 (9.93%) DV Cleared
4 19 (6.99%) Cisco Certification
4 19 (6.99%) SC Cleared
5 18 (6.62%) CCNA
6 15 (5.51%) Network+ Certification
7 12 (4.41%) AWS Certification
8 11 (4.04%) CCNP
8 11 (4.04%) VMware Certified Professional (VCP)
9 10 (3.68%) MCSA
9 10 (3.68%) Microsoft Certification
10 8 (2.94%) A+ Certification
10 8 (2.94%) RHCE
11 7 (2.57%) MCSE
12 6 (2.21%) Computer Science Degree
13 5 (1.84%) Azure Certification
13 5 (1.84%) RHCSA
14 4 (1.47%) ITIL Certification
15 3 (1.10%) Linux+ Certification
Quality Assurance & Compliance
1 9 (3.31%) Accessibility
1 9 (3.31%) Data Quality
1 9 (3.31%) GDPR
1 9 (3.31%) Sarbanes-Oxley
2 8 (2.94%) QA
3 7 (2.57%) SLA
4 4 (1.47%) ISO/IEC 27001
5 3 (1.10%) HIPAA
6 1 (0.37%) ISO 15022
6 1 (0.37%) ISO 20022
6 1 (0.37%) PMO
System Software
1 57 (20.96%) VMware Infrastructure
2 31 (11.40%) Docker
3 15 (5.51%) Hyper-V
4 13 (4.78%) Active Directory
5 9 (3.31%) HDFS
5 9 (3.31%) vSphere
6 7 (2.57%) Veritas Cluster Server
7 6 (2.21%) Virtual Machines
8 5 (1.84%) Postfix
8 5 (1.84%) Virtual Desktop
9 3 (1.10%) Dovecot
9 3 (1.10%) KVM
9 3 (1.10%) VMware NSX
10 2 (0.74%) EMC RecoverPoint
10 2 (0.74%) Firmware
10 2 (0.74%) Sendmail
11 1 (0.37%) VMware ESXi
Systems Management
1 60 (22.06%) Ansible
2 49 (18.01%) Kubernetes
3 43 (15.81%) Terraform
4 15 (5.51%) Grafana
5 14 (5.15%) Nagios
5 14 (5.15%) Puppet
6 8 (2.94%) Red Hat Satellite
7 7 (2.57%) Prometheus
8 5 (1.84%) Progress Chef
8 5 (1.84%) SCCM
8 5 (1.84%) WSUS
9 4 (1.47%) SCOM
9 4 (1.47%) vCenter Server
10 3 (1.10%) Active Directory Federation Services
10 3 (1.10%) Functional Safety
10 3 (1.10%) Kustomize
10 3 (1.10%) Microsoft Intune
10 3 (1.10%) NetBackup
10 3 (1.10%) Packer
10 3 (1.10%) VxRail
Vendors
1 81 (29.78%) IBM
2 70 (25.74%) Oracle
3 67 (24.63%) VMware
4 48 (17.65%) Microsoft
5 44 (16.18%) Cisco
6 12 (4.41%) Juniper
6 12 (4.41%) PeopleSoft
6 12 (4.41%) SolarWinds
7 11 (4.04%) SevOne
8 10 (3.68%) Atlassian
9 9 (3.31%) Splunk
10 8 (2.94%) Bloomberg
10 8 (2.94%) CQG
10 8 (2.94%) ION Trading
10 8 (2.94%) Palo Alto
10 8 (2.94%) Reuters
10 8 (2.94%) Trayport
11 7 (2.57%) Dell
11 7 (2.57%) Patsystems
11 7 (2.57%) Symantec