Order Management Jobs in the UK excluding London

Order Management
UK > UK excluding London

The following table provides summary statistics for permanent job vacancies advertised in the UK excluding London with a requirement for Order Management skills. Included is a benchmarking guide to the salaries offered in vacancies that have cited Order Management over the 6 months to 2 May 2024 with a comparison to the same period in the previous 2 years.

6 months to
2 May 2024
Same period 2023 Same period 2022
Rank 609 613 754
Rank change year-on-year +4 +141 -129
Permanent jobs citing Order Management 147 142 92
As % of all permanent jobs advertised in the UK excluding London 0.21% 0.23% 0.13%
As % of the Processes & Methodologies category 0.25% 0.24% 0.14%
Number of salaries quoted 66 64 54
10th Percentile £23,000 £25,085 £24,625
25th Percentile £26,000 £43,000 £37,813
Median annual salary (50th Percentile) £32,500 £53,750 £45,000
Median % change year-on-year -39.53% +19.44% -16.28%
75th Percentile £50,000 £61,250 £58,438
90th Percentile £56,875 £74,625 £72,500
UK median annual salary £55,500 £75,000 £82,500
% change year-on-year -26.00% -9.09% +17.86%

All Process and Methodology Skills
UK excluding London

Order Management is in the Processes and Methodologies category. The following table is for comparison with the above and provides summary statistics for all permanent job vacancies advertised in the UK excluding London with a requirement for process or methodology skills.

Permanent vacancies with a requirement for process or methodology skills 59,389 58,729 66,677
As % of all permanent jobs advertised in the UK excluding London 84.39% 95.61% 94.03%
Number of salaries quoted 41,140 30,147 41,505
10th Percentile £27,247 £30,500 £30,000
25th Percentile £36,250 £40,000 £38,750
Median annual salary (50th Percentile) £50,000 £55,000 £52,500
Median % change year-on-year -9.09% +4.76% +9.38%
75th Percentile £65,000 £70,000 £67,500
90th Percentile £77,500 £82,500 £80,000
UK median annual salary £55,000 £61,500 £60,000
% change year-on-year -10.57% +2.50% +9.09%

Order Management
Job Vacancy Trend in the UK excluding London

Job postings citing Order Management as a proportion of all IT jobs advertised in the UK excluding London.
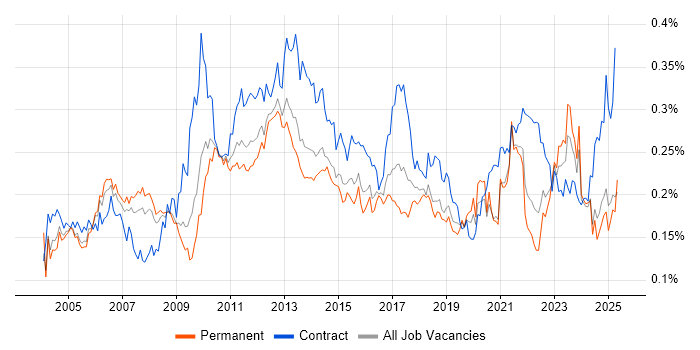
Job vacancy trend for Order Management in the UK excluding London

Order Management
Salary Trend in the UK excluding London

3-month moving average salary quoted in jobs citing Order Management in the UK excluding London.

Salary trend for Order Management in the UK excluding London

Order Management
Salary Histogram in the UK excluding London

Salary distribution for jobs citing Order Management in the UK excluding London over the 6 months to 2 May 2024.

Salary histogram for Order Management in the UK excluding London

Order Management
Job Locations in the UK excluding London

The table below looks at the demand and provides a guide to the median salaries quoted in IT jobs citing Order Management within the UK excluding London region over the 6 months to 2 May 2024. The 'Rank Change' column provides an indication of the change in demand within each location based on the same 6 month period last year.

Location Rank Change
on Same Period
Last Year
Matching
Permanent
IT Job Ads
Median Salary
Past 6 Months
Median Salary
% Change
on Same Period
Last Year
Live
Jobs
Wales +72 68 - - 1
South East +30 35 £32,500 -31.58% 24
North of England +19 16 £43,750 -23.91% 12
East of England -3 12 £29,000 +28.89% 10
Yorkshire +86 8 £45,000 -40.00% 1
Midlands +4 8 £35,000 -12.50% 17
West Midlands +22 5 £35,000 -12.50% 12
North West -18 4 £49,500 -13.91% 11
Scotland -63 4 £40,000 -44.83% 9
North East - 4 £42,500 -
East Midlands -16 3 £46,250 -7.50% 5
South West -35 3 £21,500 -59.05% 10
Northern Ireland +31 1 - -
Order Management
UK

Order Management
Co-occurring Skills and Capabilities in the UK excluding London by Category

The follow tables expand on the table above by listing co-occurrences grouped by category. The same employment type, locality and period is covered with up to 20 co-occurrences shown in each of the following categories:

Application Platforms
1 7 (4.76%) SharePoint
2 6 (4.08%) Oracle Workflow
3 1 (0.68%) IIS
Applications
1 10 (6.80%) Microsoft Excel
2 6 (4.08%) Spreadsheet
3 5 (3.40%) Microsoft Office
4 2 (1.36%) Microsoft Project
4 2 (1.36%) Trello
5 1 (0.68%) Microsoft PowerPoint
Business Applications
1 9 (6.12%) Shopify
2 6 (4.08%) Oracle Applications
3 3 (2.04%) Primavera
4 2 (1.36%) SAP PLM
4 2 (1.36%) SAP PM
4 2 (1.36%) SAP S/4HANA
5 1 (0.68%) Demantra
5 1 (0.68%) Oracle ASCP
5 1 (0.68%) Oracle EBS
5 1 (0.68%) Oracle EBS R12
5 1 (0.68%) Oracle ERP
Cloud Services
1 6 (4.08%) Azure
2 4 (2.72%) Microsoft 365
2 4 (2.72%) SaaS
3 3 (2.04%) Google Sheets
3 3 (2.04%) Power Automate
3 3 (2.04%) Power Platform
4 2 (1.36%) Azure DevOps
4 2 (1.36%) Salesforce Commerce Cloud
4 2 (1.36%) SAP Commerce Cloud
5 1 (0.68%) Cloud Computing
5 1 (0.68%) OCI
5 1 (0.68%) SAP Fieldglass
Communications & Networking
1 2 (1.36%) Broadband
1 2 (1.36%) Internet
2 1 (0.68%) DECT
2 1 (0.68%) Firewall
2 1 (0.68%) LAN
2 1 (0.68%) RFID
2 1 (0.68%) Unified Communications
2 1 (0.68%) VPN
2 1 (0.68%) WAN
2 1 (0.68%) Wireless
Database & Business Intelligence
1 15 (10.20%) MS Access
2 10 (6.80%) SQL Server
3 7 (4.76%) Oracle Reports
4 4 (2.72%) MySQL
5 3 (2.04%) Metadata
5 3 (2.04%) Power BI
5 3 (2.04%) RDBMS
5 3 (2.04%) Relational Database
Development Applications
1 10 (6.80%) Visual Studio
2 6 (4.08%) Oracle Forms
3 3 (2.04%) JIRA
4 1 (0.68%) Git
General
1 102 (69.39%) Social Skills
2 73 (49.66%) Manufacturing
3 69 (46.94%) Presentation Skills
4 68 (46.26%) Influencing Skills
4 68 (46.26%) Law
5 21 (14.29%) Finance
6 20 (13.61%) Retail
7 17 (11.56%) Analytical Skills
8 7 (4.76%) Legal
8 7 (4.76%) Organisational Skills
9 5 (3.40%) Telecoms
10 3 (2.04%) Marketing
11 2 (1.36%) Aerospace
11 2 (1.36%) Billing
11 2 (1.36%) Pharmaceutical
12 1 (0.68%) Electronics
12 1 (0.68%) Fire and Rescue
12 1 (0.68%) Inclusion and Diversity
12 1 (0.68%) Police
Job Titles
1 68 (46.26%) Automation Engineer
1 68 (46.26%) Graduate
1 68 (46.26%) Graduate IT Engineer
1 68 (46.26%) IT Engineer
1 68 (46.26%) IT Graduate
2 16 (10.88%) Analyst
2 16 (10.88%) Developer
3 13 (8.84%) Systems Analyst
4 10 (6.80%) Administrator
4 10 (6.80%) Coordinator
5 9 (6.12%) Applications Developer
6 7 (4.76%) Business Systems Analyst
6 7 (4.76%) Help Desk Administrator
7 6 (4.08%) Finance Systems Analyst
7 6 (4.08%) Financial Analyst
7 6 (4.08%) Senior
7 6 (4.08%) Senior Analyst
7 6 (4.08%) Senior Financial Analyst
7 6 (4.08%) Senior Systems Analyst
8 5 (3.40%) Lead
Libraries, Frameworks & Software Standards
1 14 (9.52%) HTML
2 12 (8.16%) JSON
3 9 (6.12%) .NET
3 9 (6.12%) ASP.NET
3 9 (6.12%) Web Services
3 9 (6.12%) XML
4 5 (3.40%) EDI
5 4 (2.72%) Laravel
5 4 (2.72%) Node.js
5 4 (2.72%) REST
5 4 (2.72%) Vue
6 1 (0.68%) CSS
6 1 (0.68%) jQuery
6 1 (0.68%) Oracle Fusion
6 1 (0.68%) React
6 1 (0.68%) Smart Contracts
6 1 (0.68%) Twitter Bootstrap
Miscellaneous
1 69 (46.94%) FMCG
2 13 (8.84%) Self-Motivation
3 9 (6.12%) EPoS
3 9 (6.12%) Management Information System
4 6 (4.08%) Pricing Data
5 4 (2.72%) Client/Server
5 4 (2.72%) Data Structures
5 4 (2.72%) Private Cloud
5 4 (2.72%) Renewable Energy
6 3 (2.04%) Low-Code
7 2 (1.36%) Educational Technology
8 1 (0.68%) Algorithms
8 1 (0.68%) Augmented Reality
8 1 (0.68%) CMDB
8 1 (0.68%) Driving Licence
8 1 (0.68%) IoT
8 1 (0.68%) Mobile App
8 1 (0.68%) NHS
8 1 (0.68%) Product Ownership
8 1 (0.68%) Virtual Reality
Operating Systems
1 4 (2.72%) Linux
2 3 (2.04%) Unix
2 3 (2.04%) Windows
2 3 (2.04%) Windows 10
Processes & Methodologies
1 83 (56.46%) Problem-Solving
2 73 (49.66%) Continuous Improvement
3 69 (46.94%) Lean Manufacturing
4 68 (46.26%) Benchmarking
4 68 (46.26%) Lean Six Sigma
4 68 (46.26%) Six Sigma
5 21 (14.29%) E-Commerce
6 16 (10.88%) Project Management
7 15 (10.20%) ERP
8 10 (6.80%) Workflow
9 9 (6.12%) API Integration
9 9 (6.12%) B2B
9 9 (6.12%) CRM
10 8 (5.44%) Business Analysis
10 8 (5.44%) Customer Service
11 7 (4.76%) Data Analysis
11 7 (4.76%) Decision-Making
11 7 (4.76%) Inventory Management
11 7 (4.76%) Stakeholder Management
11 7 (4.76%) Systems Analysis
Programming Languages
1 15 (10.20%) SQL
2 10 (6.80%) T-SQL
3 9 (6.12%) VB
3 9 (6.12%) VB.NET
3 9 (6.12%) VBA
4 8 (5.44%) JavaScript
5 4 (2.72%) PHP
5 4 (2.72%) TypeScript
6 3 (2.04%) PL/SQL
6 3 (2.04%) Python
7 2 (1.36%) Shell Script
8 1 (0.68%) C#
Qualifications
1 86 (58.50%) Degree
2 68 (46.26%) Six Sigma Yellow Belt
3 4 (2.72%) Security Cleared
4 1 (0.68%) Computer Science Degree
4 1 (0.68%) Master's Degree
4 1 (0.68%) MBA
4 1 (0.68%) Project+ Certification
4 1 (0.68%) SC Cleared
Quality Assurance & Compliance
1 4 (2.72%) NEBOSH
2 3 (2.04%) ISO/IEC 27001
3 2 (1.36%) QA
3 2 (1.36%) SLA
4 1 (0.68%) PMO
System Software
1 4 (2.72%) Docker
1 4 (2.72%) VMware ESXi
Systems Management
1 4 (2.72%) Rancher
Vendors
1 18 (12.24%) Microsoft
2 10 (6.80%) Oracle
3 8 (5.44%) Google
4 7 (4.76%) SAP
5 4 (2.72%) VMware
6 3 (2.04%) Salesforce
7 2 (1.36%) RedPrairie
8 1 (0.68%) Ariba
8 1 (0.68%) Xero