Azure DevOps Job Trends in the UK excluding London

Microsoft Azure DevOps
UK > UK excluding London

The table below provides summary statistics and salary benchmarking for jobs advertised in the UK excluding London requiring Azure DevOps skills. It covers vacancies from the 6 months leading up to 18 September 2025, with comparisons to the same periods in the previous two years.

6 months to
18 Sep 2025
Same period 2024 Same period 2023
Rank 187 121 94
Rank change year-on-year -66 -27 -1
Permanent jobs citing Azure DevOps 530 1,097 1,098
As % of all permanent jobs advertised in the UK excluding London 1.54% 1.98% 3.19%
As % of the Cloud Services category 5.76% 7.18% 8.32%
Number of salaries quoted 363 655 904
10th Percentile £42,500 £41,255 £41,250
25th Percentile £50,750 £49,750 £48,750
Median annual salary (50th Percentile) £60,000 £61,500 £60,000
Median % change year-on-year -2.44% +2.50% -
75th Percentile £72,500 £72,500 £75,000
90th Percentile £83,750 £83,750 £80,000
UK median annual salary £65,000 £65,000 £65,000

All Cloud Skills
UK excluding London

Azure DevOps falls under the Cloud Services category. For comparison with the information above, the following table provides summary statistics for all permanent job vacancies requiring cloud computing skills in the UK excluding London.

Permanent vacancies with a requirement for cloud computing skills 9,203 15,281 13,198
As % of all permanent jobs advertised in the UK excluding London 26.74% 27.57% 38.33%
Number of salaries quoted 6,232 9,245 10,902
10th Percentile £27,750 £31,250 £30,126
25th Percentile £32,750 £41,000 £40,000
Median annual salary (50th Percentile) £50,000 £55,000 £55,000
Median % change year-on-year -9.09% - -
75th Percentile £67,500 £70,000 £70,000
90th Percentile £82,500 £82,500 £82,548
UK median annual salary £60,000 £62,500 £62,500
% change year-on-year -4.00% - -

Azure DevOps
Job Vacancy Trend in the UK excluding London

Job postings citing Azure DevOps as a proportion of all IT jobs advertised in the UK excluding London.
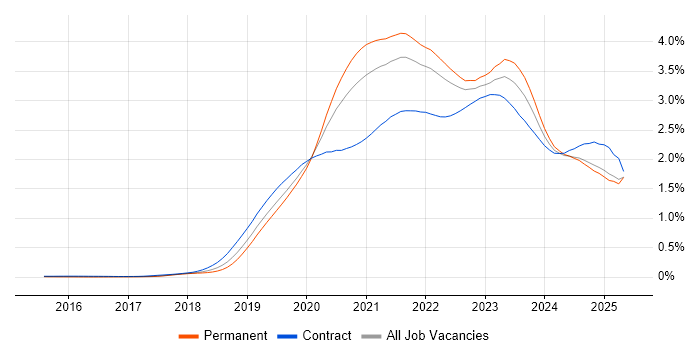
Job vacancy trend for Azure DevOps in the UK excluding London

Azure DevOps
Salary Trend in the UK excluding London

Salary distribution trend for jobs in the UK excluding London citing Azure DevOps.

Salary distribution trend for jobs in the UK excluding London citing Azure DevOps

Azure DevOps
Salary Histogram in the UK excluding London

Salary distribution for jobs citing Azure DevOps in the UK excluding London over the 6 months to 18 September 2025.

Salary histogram for Azure DevOps in the UK excluding London

Azure DevOps
Job Locations in the UK excluding London

The table below looks at the demand and provides a guide to the median salaries quoted in IT jobs citing Azure DevOps within the UK excluding London region over the 6 months to 18 September 2025. The 'Rank Change' column provides an indication of the change in demand within each location based on the same 6 month period last year.

Location Rank Change
on Same Period
Last Year
Matching
Permanent
IT Job Ads
Median Salary
Past 6 Months
Median Salary
% Change
on Same Period
Last Year
Live
Jobs
South East -46 176 £62,500 -3.85% 129
North of England -114 94 £62,750 +4.58% 95
Midlands -46 80 £59,500 -0.83% 62
Scotland +65 74 £64,500 -0.77% 39
West Midlands -28 61 £60,000 - 37
North West -90 51 £65,000 +8.33% 43
East of England -18 42 £62,500 +25.00% 37
South West -12 34 £55,000 -14.73% 44
Yorkshire -29 33 £60,000 -11.11% 33
Wales +25 31 £55,000 +4.76% 30
East Midlands -1 19 £54,500 -9.17% 21
North East -5 10 £50,000 -9.09% 22
Isle of Man +10 1 £52,500 -
Azure DevOps
UK

Azure DevOps
Co-occurring Skills and Capabilities in the UK excluding London by Category

The follow tables expand on the table above by listing co-occurrences grouped by category. The same employment type, locality and period is covered with up to 20 co-occurrences shown in each of the following categories:

Application Platforms
1 22 (4.15%) Confluence
2 11 (2.08%) IIS
3 10 (1.89%) Apache Airflow
4 9 (1.70%) Appian
5 7 (1.32%) Oracle SOA Suite
6 6 (1.13%) SharePoint
7 5 (0.94%) Apache
7 5 (0.94%) Apache Spark
7 5 (0.94%) BizTalk Server
7 5 (0.94%) nginx
8 3 (0.57%) Tomcat
9 1 (0.19%) ColdFusion
9 1 (0.19%) Mendix
9 1 (0.19%) Microsoft Exchange
Applications
1 15 (2.83%) Microsoft Excel
1 15 (2.83%) Microsoft Office
2 8 (1.51%) Microsoft Project
3 4 (0.75%) Microsoft PowerPoint
4 3 (0.57%) Trello
5 1 (0.19%) MS Visio
5 1 (0.19%) Photoshop
Business Applications
1 39 (7.36%) Dynamics CRM
2 15 (2.83%) Oracle ERP
3 2 (0.38%) Shopify
Cloud Services
1 530 (100.00%) Azure
2 116 (21.89%) Power Platform
3 107 (20.19%) GitHub
4 75 (14.15%) AWS
5 58 (10.94%) Dynamics 365
5 58 (10.94%) Power Automate
6 54 (10.19%) GitHub Actions
7 53 (10.00%) SaaS
8 52 (9.81%) Azure Service Bus
9 50 (9.43%) PaaS
10 43 (8.11%) Azure Monitor
11 42 (7.92%) Azure Logic Apps
11 42 (7.92%) Entra ID
12 35 (6.60%) Azure Key Vault
12 35 (6.60%) IaaS
13 30 (5.66%) Microsoft 365
14 27 (5.09%) Azure Cosmos DB
15 24 (4.53%) Serverless
16 23 (4.34%) Azure AKS
16 23 (4.34%) Snowflake
Communications & Networking
1 31 (5.85%) Firewall
2 25 (4.72%) VPN
3 23 (4.34%) DNS
4 18 (3.40%) WAN
5 16 (3.02%) SD-WAN
6 6 (1.13%) Network Security
7 3 (0.57%) DHCP
7 3 (0.57%) VLAN
8 2 (0.38%) ADSL2
8 2 (0.38%) BGP
8 2 (0.38%) IPsec
8 2 (0.38%) OSPF
8 2 (0.38%) Wi-Fi
8 2 (0.38%) Wireshark
Database & Business Intelligence
1 87 (16.42%) SQL Server
2 58 (10.94%) Power BI
3 28 (5.28%) Data Warehouse
4 25 (4.72%) SQL Server Integration Services
5 24 (4.53%) Tableau
6 22 (4.15%) Relational Database
7 20 (3.77%) MySQL
8 18 (3.40%) Data Lake
9 16 (3.02%) Elasticsearch
10 14 (2.64%) Azure SQL Database
11 7 (1.32%) SQL Server Reporting Services
12 6 (1.13%) RDBMS
12 6 (1.13%) Snowflake Schema
13 5 (0.94%) Metadata
14 4 (0.75%) Airbyte
14 4 (0.75%) Amazon Redshift
14 4 (0.75%) BigQuery
14 4 (0.75%) Looker
14 4 (0.75%) PostgreSQL
14 4 (0.75%) SQL Server Analysis Services
Development Applications
1 102 (19.25%) Git
2 57 (10.75%) JIRA
3 45 (8.49%) Jenkins
4 39 (7.36%) Octopus Deploy
5 23 (4.34%) Selenium
6 22 (4.15%) Visual Studio
7 18 (3.40%) Team Foundation Server
8 17 (3.21%) MSBuild
9 15 (2.83%) Oracle Forms
9 15 (2.83%) TeamCity
10 10 (1.89%) Snyk
11 9 (1.70%) Cucumber
11 9 (1.70%) GitLab
11 9 (1.70%) Postman
11 9 (1.70%) Robot Framework
12 8 (1.51%) JMeter
12 8 (1.51%) REST Assured
13 7 (1.32%) NUnit
14 6 (1.13%) JUnit
14 6 (1.13%) Katalon Studio
General
1 141 (26.60%) Finance
2 106 (20.00%) Social Skills
3 43 (8.11%) Law
4 40 (7.55%) Analytical Skills
5 32 (6.04%) Retail
6 29 (5.47%) Inclusion and Diversity
7 16 (3.02%) Marketing
8 12 (2.26%) Public Sector
9 10 (1.89%) Manufacturing
10 9 (1.70%) Legal
11 7 (1.32%) Organisational Skills
12 5 (0.94%) Back Office
13 4 (0.75%) Automotive
13 4 (0.75%) Banking
13 4 (0.75%) Documentation Skills
14 3 (0.57%) Health Technology
14 3 (0.57%) Influencing Skills
14 3 (0.57%) Military
15 2 (0.38%) Aerospace
15 2 (0.38%) Front Office
Job Titles
1 100 (18.87%) DevOps Engineer
2 95 (17.92%) Developer
3 86 (16.23%) Senior
4 69 (13.02%) Azure Engineer
5 66 (12.45%) Lead
6 52 (9.81%) Azure DevOps Engineer
7 50 (9.43%) Architect
8 45 (8.49%) Analyst
9 40 (7.55%) Cloud Engineer
10 27 (5.09%) Software Engineer
11 24 (4.53%) Dynamics 365 Developer
12 22 (4.15%) Senior Cloud Engineer
13 19 (3.58%) Platform Engineer
14 18 (3.40%) .NET Developer
14 18 (3.40%) Technical Architect
15 16 (3.02%) Software Developer
16 15 (2.83%) .NET Software Engineer
16 15 (2.83%) Applications Engineer
16 15 (2.83%) Business Analyst
16 15 (2.83%) Senior Developer
Libraries, Frameworks & Software Standards
1 192 (36.23%) .NET
2 55 (10.38%) React
3 48 (9.06%) REST
4 46 (8.68%) .NET Framework
5 38 (7.17%) RESTful
6 33 (6.23%) ASP.NET
7 31 (5.85%) JSON
8 29 (5.47%) AngularJS
8 29 (5.47%) ARM Templates
9 27 (5.09%) XML
10 24 (4.53%) .NET Core
10 24 (4.53%) Blazor
11 23 (4.34%) HTML
11 23 (4.34%) SOAP
12 22 (4.15%) CSS
12 22 (4.15%) YAML
13 17 (3.21%) Bootstrap
13 17 (3.21%) Entity Framework
14 16 (3.02%) gRPC
15 13 (2.45%) OAuth
Miscellaneous
1 80 (15.09%) Cloud Native
2 63 (11.89%) Product Ownership
3 48 (9.06%) Hybrid Cloud
4 30 (5.66%) Onboarding
5 27 (5.09%) Enterprise Software
6 23 (4.34%) Data Centre
6 23 (4.34%) e-Learning
7 18 (3.40%) Analytical Mindset
8 16 (3.02%) Virtual Team
9 15 (2.83%) Distributed Systems
10 14 (2.64%) Legacy Systems
10 14 (2.64%) NHS
11 12 (2.26%) Low-Code
12 9 (1.70%) Security Posture
13 8 (1.51%) Greenfield Project
13 8 (1.51%) Management Information System
14 7 (1.32%) Life Science
14 7 (1.32%) Operational Technology
14 7 (1.32%) SCADA
15 6 (1.13%) Mobile App
Operating Systems
1 39 (7.36%) Windows
2 12 (2.26%) VMS
3 11 (2.08%) Linux
4 7 (1.32%) Windows Server
5 5 (0.94%) Android
5 5 (0.94%) Apple iOS
6 2 (0.38%) AIX
6 2 (0.38%) Red Hat Enterprise Linux
6 2 (0.38%) SUSE Linux Enterprise Server
7 1 (0.19%) CentOS
7 1 (0.19%) Debian
Processes & Methodologies
1 530 (100.00%) DevOps
2 277 (52.26%) CI/CD
3 274 (51.70%) Agile
4 123 (23.21%) Mentoring
5 117 (22.08%) Infrastructure as Code
6 115 (21.70%) Test Automation
7 106 (20.00%) Artificial Intelligence
8 99 (18.68%) Coaching
9 90 (16.98%) Problem-Solving
10 87 (16.42%) Microservices
11 82 (15.47%) Continuous Improvement
12 68 (12.83%) Containerisation
13 67 (12.64%) Analytics
14 66 (12.45%) Migration
15 57 (10.75%) Software Engineering
16 55 (10.38%) CRM
17 54 (10.19%) Scrum
18 53 (10.00%) Asset Management
19 52 (9.81%) SDLC
20 49 (9.25%) Technical Leadership
Programming Languages
1 201 (37.92%) SQL
2 180 (33.96%) C#
3 114 (21.51%) Python
4 110 (20.75%) PowerShell
5 77 (14.53%) JavaScript
6 55 (10.38%) Bicep
7 37 (6.98%) Bash
8 35 (6.60%) TypeScript
9 31 (5.85%) Java
10 17 (3.21%) Shell Script
11 15 (2.83%) PL/SQL
12 11 (2.08%) T-SQL
12 11 (2.08%) X++
13 8 (1.51%) Go
14 7 (1.32%) Data Analysis Expressions
15 6 (1.13%) Apex Code
16 5 (0.94%) C++
16 5 (0.94%) Groovy
17 4 (0.75%) VB
18 3 (0.57%) Perl
Qualifications
1 54 (10.19%) Azure Certification
2 45 (8.49%) Degree
3 25 (4.72%) Security Cleared
4 22 (4.15%) Microsoft Certification
5 19 (3.58%) SC Cleared
6 18 (3.40%) Computer Science Degree
6 18 (3.40%) ISTQB
7 16 (3.02%) DBS Check
8 13 (2.45%) ISEB
9 9 (1.70%) Master's Degree
10 6 (1.13%) DV Cleared
11 5 (0.94%) Cisco Certification
12 4 (0.75%) PMI Certification
12 4 (0.75%) PMP
12 4 (0.75%) PRINCE2 Practitioner
13 3 (0.57%) CCNA
14 2 (0.38%) AWS Certification
14 2 (0.38%) ISTQB Foundation Certification
14 2 (0.38%) ITIL Foundation Certificate
14 2 (0.38%) TOGAF Certification
Quality Assurance & Compliance
1 44 (8.30%) QA
2 26 (4.91%) GDPR
3 18 (3.40%) Accessibility
4 10 (1.89%) Software Quality Assurance
5 8 (1.51%) ISO/IEC 27001
5 8 (1.51%) PMO
6 7 (1.32%) NCSC
6 7 (1.32%) NIST
7 6 (1.13%) Data Quality
8 1 (0.19%) COBIT
8 1 (0.19%) HIPAA
8 1 (0.19%) PCI DSS
System Software
1 84 (15.85%) Docker
2 36 (6.79%) Virtual Machines
3 21 (3.96%) Active Directory
4 16 (3.02%) VMware Infrastructure
5 10 (1.89%) Virtual Desktop
6 2 (0.38%) Firmware
6 2 (0.38%) VMware ESXi
6 2 (0.38%) vSphere
7 1 (0.19%) Hyper-V
7 1 (0.19%) Virtual Servers
Systems Management
1 151 (28.49%) Terraform
2 87 (16.42%) Kubernetes
3 30 (5.66%) Ansible
4 29 (5.47%) Single Sign-On
5 14 (2.64%) Grafana
6 10 (1.89%) Microsoft Intune
6 10 (1.89%) Prometheus
7 6 (1.13%) Puppet
8 2 (0.38%) Argo
8 2 (0.38%) Dell DRAC
8 2 (0.38%) Progress Chef
8 2 (0.38%) Red Hat Satellite
8 2 (0.38%) ZABBIX
9 1 (0.19%) Marathon
Vendors
1 175 (33.02%) Microsoft
2 32 (6.04%) IBM
3 31 (5.85%) Databricks
4 27 (5.09%) Red Hat
5 21 (3.96%) Oracle
6 20 (3.77%) VMware
7 19 (3.58%) Salesforce
8 16 (3.02%) Meraki
9 12 (2.26%) Rackspace
10 10 (1.89%) Google
10 10 (1.89%) UiPath
11 9 (1.70%) BiZZdesign
11 9 (1.70%) Black Duck
12 8 (1.51%) Okta
13 7 (1.32%) OpenAI
13 7 (1.32%) Rockwell
13 7 (1.32%) Siemens
14 5 (0.94%) Blue Prism
15 4 (0.75%) Pega
15 4 (0.75%) Talend