Service Delivery Jobs in the UK excluding London

Service Delivery
UK > UK excluding London

The table below provides summary statistics for permanent job vacancies advertised in the UK excluding London requiring Service Delivery skills. It includes a benchmarking guide to the annual salaries offered in vacancies that cited Service Delivery over the 6 months leading up to 26 July 2024, comparing them to the same period in the previous two years.

6 months to
26 Jul 2024
Same period 2023 Same period 2022
Rank 94 124 77
Rank change year-on-year +30 -47 +24
Permanent jobs citing Service Delivery 1,669 1,317 3,051
As % of all permanent jobs advertised in the UK excluding London 2.56% 2.74% 3.90%
As % of the Processes & Methodologies category 3.21% 2.86% 4.08%
Number of salaries quoted 1,091 903 2,004
10th Percentile £26,500 £24,500 £27,500
25th Percentile £35,000 £31,250 £35,000
Median annual salary (50th Percentile) £45,000 £47,500 £47,500
Median % change year-on-year -5.26% - +5.56%
75th Percentile £60,000 £62,500 £60,000
90th Percentile £70,000 £75,000 £72,933
UK median annual salary £49,000 £52,500 £50,250
% change year-on-year -6.67% +4.48% -4.29%

All Process and Methodology Skills
UK excluding London

Service Delivery falls under the Processes and Methodologies category. For comparison with the information above, the following table provides summary statistics for all permanent job vacancies requiring process or methodology skills in the UK excluding London.

Permanent vacancies with a requirement for process or methodology skills 51,975 45,995 74,754
As % of all permanent jobs advertised in the UK excluding London 79.63% 95.53% 95.46%
Number of salaries quoted 33,355 26,900 43,045
10th Percentile £28,371 £30,500 £30,076
25th Percentile £37,500 £40,000 £39,000
Median annual salary (50th Percentile) £50,000 £55,000 £52,500
Median % change year-on-year -9.09% +4.76% +6.06%
75th Percentile £65,000 £69,500 £67,500
90th Percentile £80,000 £82,050 £81,250
UK median annual salary £55,000 £60,000 £60,000
% change year-on-year -8.33% - +9.09%

Service Delivery
Job Vacancy Trend in the UK excluding London

Job postings citing Service Delivery as a proportion of all IT jobs advertised in the UK excluding London.
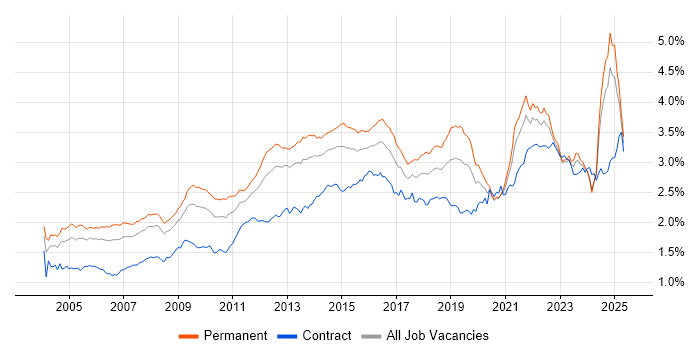
Job vacancy trend for Service Delivery in the UK excluding London

Service Delivery
Salary Trend in the UK excluding London

3-month moving average salary quoted in jobs citing Service Delivery in the UK excluding London.

Salary trend for Service Delivery in the UK excluding London

Service Delivery
Salary Histogram in the UK excluding London

Salary distribution for jobs citing Service Delivery in the UK excluding London over the 6 months to 26 July 2024.

Salary histogram for Service Delivery in the UK excluding London

Service Delivery
Job Locations in the UK excluding London

The table below looks at the demand and provides a guide to the median salaries quoted in IT jobs citing Service Delivery within the UK excluding London region over the 6 months to 26 July 2024. The 'Rank Change' column provides an indication of the change in demand within each location based on the same 6 month period last year.

Location Rank Change
on Same Period
Last Year
Matching
Permanent
IT Job Ads
Median Salary
Past 6 Months
Median Salary
% Change
on Same Period
Last Year
Live
Jobs
North of England +57 423 £41,711 -16.16% 108
South East +28 396 £45,000 -1.32% 94
South West +33 294 £49,000 -2.49% 56
North West +40 226 £51,674 +8.79% 53
Midlands -19 215 £50,000 -10.31% 75
West Midlands -9 138 £52,000 -7.96% 49
Scotland -30 137 £49,990 +43.86% 22
East of England -9 136 £38,000 +8.57% 43
Yorkshire +47 134 £40,000 -28.57% 36
East Midlands -9 73 £37,000 -24.10% 26
North East +33 66 £24,960 -45.74% 19
Wales +54 55 £40,000 +8.72% 15
Northern Ireland +19 18 £50,000 +40.85% 25
Service Delivery
UK

Service Delivery
Co-occurring Skills and Capabilities in the UK excluding London by Category

The follow tables expand on the table above by listing co-occurrences grouped by category. The same employment type, locality and period is covered with up to 20 co-occurrences shown in each of the following categories:

Application Platforms
1 80 (4.79%) Microsoft Exchange
2 77 (4.61%) SharePoint
3 27 (1.62%) Confluence
4 19 (1.14%) Jupyter
5 18 (1.08%) Apache
5 18 (1.08%) CMS
6 17 (1.02%) nginx
7 16 (0.96%) Apache Spark
8 6 (0.36%) Appian
9 5 (0.30%) WebLogic
10 4 (0.24%) Exchange Server 2000
11 3 (0.18%) SAS
11 3 (0.18%) SharePoint 2010
11 3 (0.18%) SharePoint 2013
12 2 (0.12%) ArcGIS
12 2 (0.12%) Exchange Server 2013
12 2 (0.12%) IIS
12 2 (0.12%) Oracle Application Server
13 1 (0.060%) IBM Domino
13 1 (0.060%) Skype for Business
Applications
1 95 (5.69%) Microsoft Office
2 82 (4.91%) Microsoft Excel
3 39 (2.34%) Microsoft PowerPoint
4 14 (0.84%) Microsoft Project
5 9 (0.54%) MS Visio
6 5 (0.30%) AutoCAD
7 3 (0.18%) Chatbot
7 3 (0.18%) SOLIDWORKS
8 2 (0.12%) Trello
9 1 (0.060%) Solid Edge
Business Applications
1 7 (0.42%) NEC Housing
1 7 (0.42%) SAP HCM
2 5 (0.30%) iTrent
2 5 (0.30%) SAP ERP
2 5 (0.30%) SAP WM
2 5 (0.30%) Workday HCM
3 4 (0.24%) Dynamics CRM
3 4 (0.24%) Dynamics GP
3 4 (0.24%) ResourceLink
3 4 (0.24%) SAP HR
3 4 (0.24%) Unit4 Business World
4 3 (0.18%) Dynamics AX
4 3 (0.18%) Primavera
5 2 (0.12%) BambooHR
5 2 (0.12%) Maximo
5 2 (0.12%) Salesforce CRM
6 1 (0.060%) HFM
6 1 (0.060%) Oracle Applications
6 1 (0.060%) Oracle ERP
6 1 (0.060%) SAP S/4HANA
Cloud Services
1 264 (15.82%) Microsoft 365
2 219 (13.12%) Azure
3 70 (4.19%) AWS
4 66 (3.95%) Entra ID
5 57 (3.42%) SaaS
6 37 (2.22%) Power Platform
7 25 (1.50%) Dynamics 365
8 23 (1.38%) Cloud Computing
9 22 (1.32%) OneDrive
10 19 (1.14%) Amazon S3
11 18 (1.08%) Azure Sentinel
12 16 (0.96%) MinIO
12 16 (0.96%) OpenShift
13 13 (0.78%) IaaS
14 12 (0.72%) Microsoft Copilot
15 11 (0.66%) Amazon EC2
16 9 (0.54%) Azure DevOps
16 9 (0.54%) PaaS
17 8 (0.48%) PowerApps
18 7 (0.42%) SuccessFactors
Communications & Networking
1 132 (7.91%) Firewall
2 93 (5.57%) WAN
3 85 (5.09%) LAN
4 57 (3.42%) VPN
5 49 (2.94%) DNS
5 49 (2.94%) Network Security
6 46 (2.76%) Wireless
7 43 (2.58%) VoIP
8 40 (2.40%) Wi-Fi
9 38 (2.28%) DHCP
10 31 (1.86%) SAN
11 30 (1.80%) WLAN
12 25 (1.50%) Internet
13 24 (1.44%) VLAN
14 23 (1.38%) SD-WAN
14 23 (1.38%) TCP/IP
15 15 (0.90%) NAS
16 13 (0.78%) iSCSI
17 11 (0.66%) Remote Desktop
18 9 (0.54%) Structured Cabling
Database & Business Intelligence
1 53 (3.18%) SQL Server
2 33 (1.98%) Relational Database
3 30 (1.80%) Power BI
4 29 (1.74%) Big Data
5 26 (1.56%) Amazon RDS
6 21 (1.26%) MySQL
6 21 (1.26%) RDBMS
7 18 (1.08%) Oracle Database
8 16 (0.96%) Hadoop
8 16 (0.96%) Presto
9 10 (0.60%) DB2
10 7 (0.42%) Azure SQL Database
10 7 (0.42%) Crystal Reports
11 5 (0.30%) CorVu
12 4 (0.24%) Oracle Reports
12 4 (0.24%) Tableau
13 3 (0.18%) BusinessObjects
13 3 (0.18%) DTS
13 3 (0.18%) GIS
13 3 (0.18%) PostgreSQL
Development Applications
1 42 (2.52%) JIRA
2 30 (1.80%) Jenkins
3 18 (1.08%) Atlassian Bamboo
4 13 (0.78%) Oracle Forms
4 13 (0.78%) Robot Framework
5 4 (0.24%) Git
6 3 (0.18%) Appium
6 3 (0.18%) Cypress.io
6 3 (0.18%) JMeter
6 3 (0.18%) Postman
6 3 (0.18%) REST Assured
6 3 (0.18%) Selenium
6 3 (0.18%) Serenity BDD
6 3 (0.18%) SpecFlow
7 2 (0.12%) Visual Studio
8 1 (0.060%) Bitbucket
8 1 (0.060%) GitLab
8 1 (0.060%) Visual Studio Team System
General
1 599 (35.89%) Social Skills
2 344 (20.61%) Finance
3 162 (9.71%) Analytical Skills
4 124 (7.43%) Public Sector
5 98 (5.87%) Inclusion and Diversity
5 98 (5.87%) Retail
6 78 (4.67%) Legal
7 75 (4.49%) Marketing
8 60 (3.59%) Organisational Skills
9 56 (3.36%) Telecoms
10 40 (2.40%) Manufacturing
11 37 (2.22%) Aerospace
12 34 (2.04%) Law
13 28 (1.68%) Influencing Skills
14 27 (1.62%) Banking
14 27 (1.62%) Presentation Skills
15 21 (1.26%) Local Government
16 20 (1.20%) Police
17 14 (0.84%) Electronics
18 13 (0.78%) Military
Job Titles
1 256 (15.34%) Service Manager
2 202 (12.10%) Delivery Manager
2 202 (12.10%) Service Delivery Manager
3 180 (10.78%) Analyst
4 167 (10.01%) Lead
5 149 (8.93%) IT Manager
6 112 (6.71%) Consultant
7 104 (6.23%) Senior
8 102 (6.11%) IT Support
9 88 (5.27%) Infrastructure Engineer
10 65 (3.89%) IT Engineer
11 63 (3.77%) Support Engineer
12 55 (3.30%) Support Analyst
12 55 (3.30%) Team Leader
13 52 (3.12%) Architect
13 52 (3.12%) IT Services Manager
14 51 (3.06%) IT Analyst
15 40 (2.40%) IT Support Engineer
16 39 (2.34%) Coordinator
17 38 (2.28%) IT Support Analyst
Libraries, Frameworks & Software Standards
1 27 (1.62%) EDI
2 16 (0.96%) ActiveMQ
2 16 (0.96%) Apache NiFi
2 16 (0.96%) Elastic Stack
2 16 (0.96%) HTML
2 16 (0.96%) RabbitMQ
2 16 (0.96%) YAML
3 15 (0.90%) .NET
4 13 (0.78%) XML
5 10 (0.60%) Middleware
6 6 (0.36%) Oracle Fusion
7 4 (0.24%) .NET Framework
7 4 (0.24%) ADO
7 4 (0.24%) Web Services
8 3 (0.18%) Playwright
9 2 (0.12%) .NET Core
9 2 (0.12%) AngularJS
9 2 (0.12%) cXML
9 2 (0.12%) EDIFACT
9 2 (0.12%) OpenMP
Miscellaneous
1 90 (5.39%) Management Information System
2 85 (5.09%) Data Centre
3 69 (4.13%) Self-Motivation
4 63 (3.77%) Driving Licence
5 28 (1.68%) Fat Client
5 28 (1.68%) Onboarding
5 28 (1.68%) Thin Client
6 23 (1.38%) Product Ownership
7 22 (1.32%) Hybrid Cloud
8 17 (1.02%) PMI
9 16 (0.96%) Analytical Mindset
10 15 (0.90%) Replication
10 15 (0.90%) Security Operations Centre
11 14 (0.84%) Enterprise Software
11 14 (0.84%) Linux Command Line
12 13 (0.78%) Cyber Defence
13 12 (0.72%) Smartphone
14 11 (0.66%) CMDB
14 11 (0.66%) Mobile App
15 10 (0.60%) Virtual Team
Operating Systems
1 265 (15.88%) Windows
2 140 (8.39%) Linux
3 109 (6.53%) Windows Server
4 78 (4.67%) Windows 10
5 33 (1.98%) Unix
6 25 (1.50%) Android
7 23 (1.38%) Apple iOS
8 16 (0.96%) Windows Server 2016
8 16 (0.96%) Windows Server 2019
9 11 (0.66%) Red Hat Enterprise Linux
10 10 (0.60%) Windows Server 2012
11 9 (0.54%) Mac OS
11 9 (0.54%) Mac OS X
12 5 (0.30%) VMS
12 5 (0.30%) Windows 7
13 2 (0.12%) Windows 8
14 1 (0.060%) CentOS
14 1 (0.060%) NetWare
14 1 (0.060%) Solaris
14 1 (0.060%) Windows Server 2008
Processes & Methodologies
1 526 (31.52%) ITIL
2 325 (19.47%) Problem-Solving
3 286 (17.14%) Service Management
4 285 (17.08%) Customer Service
5 238 (14.26%) Continuous Improvement
6 221 (13.24%) Change Management
7 204 (12.22%) ITSM
8 203 (12.16%) Project Management
9 182 (10.90%) Agile
10 160 (9.59%) Actionable Insight
11 149 (8.93%) Stakeholder Management
12 114 (6.83%) Incident Management
13 113 (6.77%) Cybersecurity
14 110 (6.59%) Infrastructure Engineering
15 108 (6.47%) Project Delivery
16 106 (6.35%) Coaching
16 106 (6.35%) Roadmaps
17 105 (6.29%) Mentoring
18 102 (6.11%) Problem Management
19 90 (5.39%) Service Design
Programming Languages
1 78 (4.67%) SQL
2 47 (2.82%) Python
3 41 (2.46%) PowerShell
4 38 (2.28%) Bash
5 16 (0.96%) Shell Script
6 10 (0.60%) C#
7 8 (0.48%) COBOL
7 8 (0.48%) Java
8 6 (0.36%) JavaScript
9 5 (0.30%) ActionScript
9 5 (0.30%) PL/SQL
10 4 (0.24%) C++
10 4 (0.24%) Kotlin
10 4 (0.24%) T-SQL
11 3 (0.18%) C
11 3 (0.18%) Perl
12 2 (0.12%) ActionScript 2.0
12 2 (0.12%) Bicep
12 2 (0.12%) C-shell
12 2 (0.12%) Kusto Query Language
Qualifications
1 257 (15.40%) Degree
2 174 (10.43%) Security Cleared
3 95 (5.69%) SC Cleared
4 41 (2.46%) Cisco Certification
5 40 (2.40%) ITIL Certification
6 37 (2.22%) Microsoft Certification
6 37 (2.22%) PMI Certification
7 34 (2.04%) Computer Science Degree
8 32 (1.92%) ITIL Foundation Certificate
9 30 (1.80%) DV Cleared
10 28 (1.68%) CISSP
11 27 (1.62%) CCNA
12 23 (1.38%) PMP
13 21 (1.26%) CCNP
14 18 (1.08%) MCP
15 17 (1.02%) Azure Certification
15 17 (1.02%) DBS Check
16 12 (0.72%) APMG
16 12 (0.72%) Network+ Certification
17 10 (0.60%) MCSE
Quality Assurance & Compliance
1 206 (12.34%) SLA
2 55 (3.30%) QA
3 43 (2.58%) GDPR
4 40 (2.40%) ISO/IEC 27001
5 28 (1.68%) Accessibility
6 27 (1.62%) Data Quality
7 23 (1.38%) Cyber Essentials
8 15 (0.90%) PMO
9 9 (0.54%) ISO 22301
10 7 (0.42%) PCI DSS
11 6 (0.36%) ISO/IEC 20000
12 5 (0.30%) Cyber Essentials PLUS
13 3 (0.18%) ISO/IEC 27002 (supersedes ISO/IEC 17799)
13 3 (0.18%) ISO/IEC 27005
14 2 (0.12%) COSHH
14 2 (0.12%) HIPAA
14 2 (0.12%) NEBOSH
14 2 (0.12%) Sarbanes-Oxley
15 1 (0.060%) Disclosure Scotland
15 1 (0.060%) GRC
System Software
1 220 (13.18%) Active Directory
2 86 (5.15%) VMware Infrastructure
3 45 (2.70%) Hyper-V
4 20 (1.20%) vSphere
5 18 (1.08%) Docker
6 15 (0.90%) Virtual Machines
7 14 (0.84%) Virtual Desktop
8 7 (0.42%) Virtual Servers
9 6 (0.36%) VMware ESXi
10 2 (0.12%) Firmware
10 2 (0.12%) Microsoft Virtual Server
11 1 (0.060%) BitLocker
11 1 (0.060%) DFS Replication
11 1 (0.060%) XenDesktop
Systems Management
1 62 (3.71%) Microsoft Intune
2 55 (3.30%) SCCM
3 43 (2.58%) Kubernetes
4 32 (1.92%) Ansible
5 24 (1.44%) Terraform
6 19 (1.14%) WSUS
7 17 (1.02%) Grafana
8 16 (0.96%) HAProxy
8 16 (0.96%) Prometheus
9 10 (0.60%) Puppet
10 8 (0.48%) ZABBIX
11 6 (0.36%) Microsoft Data Protection Manager
11 6 (0.36%) SCDPM
12 5 (0.30%) Jamf Pro
13 4 (0.24%) Autotask
13 4 (0.24%) SmoothWall
14 3 (0.18%) Enterprise Manager Cloud Control
14 3 (0.18%) Nessus
14 3 (0.18%) Oracle RMAN
14 3 (0.18%) Progress Chef
Vendors
1 426 (25.52%) Microsoft
2 133 (7.97%) VMware
3 95 (5.69%) ServiceNow
4 77 (4.61%) Cisco
5 53 (3.18%) Oracle
6 36 (2.16%) SAP
7 33 (1.98%) Salesforce
8 29 (1.74%) Veeam
9 28 (1.68%) Citrix
10 19 (1.14%) HP
10 19 (1.14%) Meraki
11 17 (1.02%) Red Hat
12 16 (0.96%) Dell
13 13 (0.78%) Apple
14 11 (0.66%) Google
14 11 (0.66%) Mitel
15 10 (0.60%) Avaya
15 10 (0.60%) Palo Alto
15 10 (0.60%) Workday
16 9 (0.54%) IBM