Analytical Mindset Jobs in the UK excluding London

Analytical Mindset
UK > UK excluding London

The table below looks at the prevalence of the term Analytical Mindset in permanent job vacancies in the UK excluding London. Included is a benchmarking guide to the salaries offered in vacancies that cited Analytical Mindset over the 6 months leading up to 26 July 2024, comparing them to the same period in the previous two years.

6 months to
26 Jul 2024
Same period 2023 Same period 2022
Rank 450 502 638
Rank change year-on-year +52 +136 -73
Permanent jobs citing Analytical Mindset 270 179 246
As % of all permanent jobs advertised in the UK excluding London 0.41% 0.37% 0.31%
As % of the Miscellaneous category 1.34% 0.93% 0.72%
Number of salaries quoted 166 108 125
10th Percentile £28,500 £26,975 £23,750
25th Percentile £32,500 £33,000 £30,000
Median annual salary (50th Percentile) £45,000 £47,250 £45,000
Median % change year-on-year -4.76% +5.00% +4.05%
75th Percentile £60,938 £58,750 £53,750
90th Percentile £68,750 £70,000 £62,100
UK median annual salary £48,449 £50,000 £50,000
% change year-on-year -3.10% - +11.11%

All Generic Skills
UK excluding London

Analytical Mindset falls under the General and Transferable Skills category. For comparison with the information above, the following table provides summary statistics for all permanent job vacancies requiring generic IT skills in the UK excluding London.

Permanent vacancies with a requirement for generic IT skills 20,220 19,230 34,139
As % of all permanent jobs advertised in the UK excluding London 30.98% 39.94% 43.59%
Number of salaries quoted 11,541 10,409 17,070
10th Percentile £27,500 £31,250 £30,000
25th Percentile £36,250 £40,625 £40,000
Median annual salary (50th Percentile) £50,000 £55,000 £52,500
Median % change year-on-year -9.09% +4.76% +5.00%
75th Percentile £65,000 £70,000 £69,375
90th Percentile £80,000 £85,000 £82,970
UK median annual salary £55,000 £64,000 £62,500
% change year-on-year -14.06% +2.40% +4.17%

Analytical Mindset
Job Vacancy Trend in the UK excluding London

Job postings citing Analytical Mindset as a proportion of all IT jobs advertised in the UK excluding London.
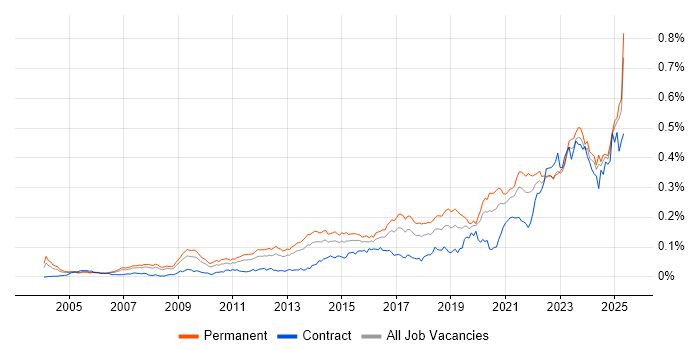
Job vacancy trend for Analytical Mindset in the UK excluding London

Analytical Mindset
Salary Trend in the UK excluding London

3-month moving average salary quoted in jobs citing Analytical Mindset in the UK excluding London.

Salary trend for Analytical Mindset in the UK excluding London

Analytical Mindset
Salary Histogram in the UK excluding London

Salary distribution for jobs citing Analytical Mindset in the UK excluding London over the 6 months to 26 July 2024.

Salary histogram for Analytical Mindset in the UK excluding London

Analytical Mindset
Job Locations in the UK excluding London

The table below looks at the demand and provides a guide to the median salaries quoted in IT jobs citing Analytical Mindset within the UK excluding London region over the 6 months to 26 July 2024. The 'Rank Change' column provides an indication of the change in demand within each location based on the same 6 month period last year.

Location Rank Change
on Same Period
Last Year
Matching
Permanent
IT Job Ads
Median Salary
Past 6 Months
Median Salary
% Change
on Same Period
Last Year
Live
Jobs
South East +49 96 £44,544 +4.81% 10
North of England +15 52 £50,000 - 14
South West +22 40 £40,000 -25.58% 12
North West +1 38 £55,000 +22.22% 10
Midlands -12 35 £35,000 -22.22% 12
Scotland -27 22 £63,500 +33.68% 4
West Midlands -11 18 £35,000 -22.22% 7
East Midlands -11 17 £29,000 -47.27% 5
East of England +9 16 £42,500 -26.09% 7
Yorkshire +60 13 £43,000 -28.33% 2
Wales +4 5 £50,000 -15.28% 1
Isle of Man - 4 - -
North East -16 1 £29,500 -47.53% 2
Analytical Mindset
UK

Analytical Mindset
Co-occurring Skills and Capabilities in the UK excluding London by Category

The follow tables expand on the table above by listing co-occurrences grouped by category. The same employment type, locality and period is covered with up to 20 co-occurrences shown in each of the following categories:

Application Platforms
1 12 (4.44%) SharePoint
2 5 (1.85%) Microsoft Exchange
3 3 (1.11%) Apache Spark
4 1 (0.37%) Apache
4 1 (0.37%) CMS
4 1 (0.37%) Confluence
Applications
1 28 (10.37%) Microsoft Excel
2 9 (3.33%) Microsoft Office
3 4 (1.48%) Microsoft PowerPoint
3 4 (1.48%) OrCAD
3 4 (1.48%) SOLIDWORKS
4 1 (0.37%) Chatbot
4 1 (0.37%) Microsoft Project
Business Applications
1 4 (1.48%) NetSuite
2 3 (1.11%) CA PPM
3 2 (0.74%) Dynamics NAV
4 1 (0.37%) Dynamics CRM
4 1 (0.37%) Infor M3
4 1 (0.37%) JDE OneWorld
4 1 (0.37%) JDE World
4 1 (0.37%) SAP Payroll
4 1 (0.37%) Visualfiles
Cloud Services
1 43 (15.93%) Power Platform
2 31 (11.48%) Azure
3 22 (8.15%) AWS
4 21 (7.78%) Microsoft 365
5 9 (3.33%) GCP
6 7 (2.59%) Power Automate
7 5 (1.85%) Azure Sentinel
8 4 (1.48%) Dynamics 365
8 4 (1.48%) IaaS
8 4 (1.48%) PowerApps
9 3 (1.11%) SaaS
9 3 (1.11%) Snowflake
10 2 (0.74%) Alation
10 2 (0.74%) Amazon S3
10 2 (0.74%) Amazon SageMaker
10 2 (0.74%) AWS Step Functions
10 2 (0.74%) Cloud Computing
10 2 (0.74%) Collibra
10 2 (0.74%) Serverless
10 2 (0.74%) WhatsApp
Communications & Networking
1 12 (4.44%) Ethernet
2 7 (2.59%) Cisco Nexus
2 7 (2.59%) DNS
2 7 (2.59%) RS-232
3 6 (2.22%) Firewall
3 6 (2.22%) LAN
3 6 (2.22%) WAN
4 5 (1.85%) Intranet
4 5 (1.85%) Network Security
5 4 (1.48%) Profibus
6 3 (1.11%) SAN
6 3 (1.11%) VLAN
6 3 (1.11%) VPN
6 3 (1.11%) Wireless
7 1 (0.37%) NAS
7 1 (0.37%) SSL
7 1 (0.37%) Wi-Fi
Database & Business Intelligence
1 32 (11.85%) Power BI
2 12 (4.44%) SQL Server
3 8 (2.96%) Tableau
4 6 (2.22%) Data Warehouse
5 5 (1.85%) SQL Server Reporting Services
6 4 (1.48%) Data Lake
6 4 (1.48%) PowerPivot
6 4 (1.48%) Relational Database
7 3 (1.11%) Big Data
7 3 (1.11%) Hadoop
7 3 (1.11%) SQL Server Integration Services
8 2 (0.74%) Amazon QuickSight
8 2 (0.74%) Data Mining
8 2 (0.74%) PostgreSQL
8 2 (0.74%) QlikView
9 1 (0.37%) Crystal Reports
9 1 (0.37%) DB2
9 1 (0.37%) MongoDB
9 1 (0.37%) MS Access
9 1 (0.37%) RDBMS
Development Applications
1 5 (1.85%) Git
2 4 (1.48%) JIRA
2 4 (1.48%) LabVIEW
3 2 (0.74%) Maven
4 1 (0.37%) Bugzilla
4 1 (0.37%) CircleCI
4 1 (0.37%) GitLab
4 1 (0.37%) GoogleTest
4 1 (0.37%) Jenkins
4 1 (0.37%) Visual Studio
General
1 269 (99.63%) Analytical Skills
2 136 (50.37%) Social Skills
3 47 (17.41%) Finance
4 43 (15.93%) Marketing
5 34 (12.59%) Manufacturing
6 24 (8.89%) Retail
7 22 (8.15%) Electronics
8 21 (7.78%) Advertising
9 18 (6.67%) Influencing Skills
10 17 (6.30%) German Language
11 16 (5.93%) Organisational Skills
11 16 (5.93%) Public Sector
12 14 (5.19%) Law
13 11 (4.07%) Legal
14 10 (3.70%) Inclusion and Diversity
14 10 (3.70%) Pharmaceutical
15 7 (2.59%) Aerospace
16 6 (2.22%) Banking
16 6 (2.22%) Telecoms
17 5 (1.85%) Presentation Skills
Job Titles
1 52 (19.26%) Analyst
2 26 (9.63%) Senior
3 25 (9.26%) Graduate
4 24 (8.89%) Lead
5 17 (6.30%) Data Steward
6 15 (5.56%) Software Engineer
7 11 (4.07%) Administrator
7 11 (4.07%) Product Manager
8 10 (3.70%) Architect
8 10 (3.70%) Business Analyst
8 10 (3.70%) Consultant
8 10 (3.70%) Team Leader
9 9 (3.33%) Graduate Software Engineer
9 9 (3.33%) Solutions Architect
10 8 (2.96%) IT Manager
11 7 (2.59%) Data Analyst
11 7 (2.59%) Developer
11 7 (2.59%) IT Analyst
11 7 (2.59%) Senior Analyst
12 6 (2.22%) IT Support
Libraries, Frameworks & Software Standards
1 5 (1.85%) EDI
2 4 (1.48%) ARM Templates
3 3 (1.11%) .NET
3 3 (1.11%) Spring
4 2 (0.74%) .NET Framework
4 2 (0.74%) ActiveMQ
4 2 (0.74%) Hibernate
4 2 (0.74%) HTML
4 2 (0.74%) JSON
4 2 (0.74%) RESTful
4 2 (0.74%) XML
5 1 (0.37%) AngularJS
5 1 (0.37%) ASP.NET
5 1 (0.37%) ASP.NET MVC
5 1 (0.37%) CSS
5 1 (0.37%) Entity Framework
5 1 (0.37%) HTML5
5 1 (0.37%) Middleware
5 1 (0.37%) OLE
5 1 (0.37%) WinForms
Miscellaneous
1 19 (7.04%) Self-Motivation
2 17 (6.30%) Algorithms
2 17 (6.30%) Analogue Electronics
2 17 (6.30%) Social Media
3 16 (5.93%) Photography
3 16 (5.93%) Product Ownership
4 14 (5.19%) FPGA
5 10 (3.70%) Greenfield Project
5 10 (3.70%) VHDL
6 9 (3.33%) Fibre Optics
6 9 (3.33%) Management Information System
7 8 (2.96%) Cyber Threat
7 8 (2.96%) Data Structures
8 7 (2.59%) Driving Licence
8 7 (2.59%) Onboarding
8 7 (2.59%) Robotics
9 4 (1.48%) Biopharmaceutical
9 4 (1.48%) Distributed Computing
10 3 (1.11%) Blockchain
10 3 (1.11%) Enterprise Software
Operating Systems
1 16 (5.93%) Linux
2 12 (4.44%) Windows
3 6 (2.22%) Unix
4 4 (1.48%) Windows Server
5 2 (0.74%) Android
5 2 (0.74%) Apple iOS
Processes & Methodologies
1 116 (42.96%) Problem-Solving
2 61 (22.59%) Project Management
3 49 (18.15%) Analytics
4 44 (16.30%) Continuous Improvement
5 34 (12.59%) Decision-Making
6 33 (12.22%) Business Intelligence
7 32 (11.85%) Customer Service
8 31 (11.48%) Computer Science
9 30 (11.11%) Agile
9 30 (11.11%) Stakeholder Management
10 27 (10.00%) Data Governance
10 27 (10.00%) Mathematics
10 27 (10.00%) Roadmaps
11 26 (9.63%) ERP
12 25 (9.26%) Physics
13 21 (7.78%) Collaborative Working
13 21 (7.78%) Mentoring
14 20 (7.41%) Coaching
15 19 (7.04%) Cybersecurity
15 19 (7.04%) Data Architecture
Programming Languages
1 42 (15.56%) SQL
2 25 (9.26%) Python
3 18 (6.67%) C
3 18 (6.67%) C++
3 18 (6.67%) Java
4 7 (2.59%) C#
5 6 (2.22%) Perl
5 6 (2.22%) R
6 5 (1.85%) Kusto Query Language
7 4 (1.48%) Bicep
7 4 (1.48%) Embedded C++
7 4 (1.48%) PowerShell
8 3 (1.11%) Bash
8 3 (1.11%) Fortran
8 3 (1.11%) JavaScript
8 3 (1.11%) Scala
8 3 (1.11%) T-SQL
9 2 (0.74%) PL/SQL
9 2 (0.74%) RPG
9 2 (0.74%) VB
Qualifications
1 96 (35.56%) Degree
2 27 (10.00%) Security Cleared
3 21 (7.78%) SC Cleared
4 19 (7.04%) DBS Check
5 18 (6.67%) Microsoft Certification
6 16 (5.93%) Cisco Certification
7 14 (5.19%) DV Cleared
7 14 (5.19%) PhD
8 11 (4.07%) Computer Science Degree
9 10 (3.70%) Azure Certification
10 8 (2.96%) CCNA
10 8 (2.96%) Master's Degree
11 7 (2.59%) CCNP
11 7 (2.59%) Network+ Certification
12 5 (1.85%) CISSP
13 4 (1.48%) A+ Certification
14 3 (1.11%) BPSS Clearance
14 3 (1.11%) CompTIA Security+
15 2 (0.74%) CEH
15 2 (0.74%) MCSE
Quality Assurance & Compliance
1 28 (10.37%) Data Quality
2 21 (7.78%) QA
3 12 (4.44%) ISO/IEC 27001
4 6 (2.22%) PMO
5 5 (1.85%) GDPR
5 5 (1.85%) GMP
6 4 (1.48%) 21 CFR Part 11
6 4 (1.48%) ISO 13485
7 3 (1.11%) Actionable Recommendations
7 3 (1.11%) NEBOSH
8 2 (0.74%) NIST
9 1 (0.37%) Accessibility
9 1 (0.37%) Cyber Essentials
9 1 (0.37%) ISO 9001
9 1 (0.37%) ISO/IEC 27002 (supersedes ISO/IEC 17799)
9 1 (0.37%) PCI DSS
9 1 (0.37%) Sarbanes-Oxley
9 1 (0.37%) SLA
9 1 (0.37%) SOC 2
System Software
1 8 (2.96%) Firmware
2 6 (2.22%) Active Directory
3 4 (1.48%) Lustre
3 4 (1.48%) Slurm Workload Manager
4 3 (1.11%) Docker
5 2 (0.74%) VMware Infrastructure
6 1 (0.37%) Hyper-V
6 1 (0.37%) vSphere
Systems Management
1 4 (1.48%) Terraform
2 3 (1.11%) Kubernetes
3 1 (0.37%) NetBackup
3 1 (0.37%) TeamSite
Vendors
1 57 (21.11%) Microsoft
2 9 (3.33%) Meraki
3 7 (2.59%) ForeScout
4 6 (2.22%) Oracle
4 6 (2.22%) VMware
5 5 (1.85%) Cisco
5 5 (1.85%) McAfee
5 5 (1.85%) Rapid7
5 5 (1.85%) Splunk
6 4 (1.48%) Google
6 4 (1.48%) IFS
6 4 (1.48%) SAP
7 3 (1.11%) Apple
7 3 (1.11%) Cadence
8 2 (0.74%) Dell
8 2 (0.74%) Epicor
8 2 (0.74%) Facebook
8 2 (0.74%) Informatica
8 2 (0.74%) JD Edwards
8 2 (0.74%) Sun