Oracle Jobs in the UK excluding London

Oracle
UK > UK excluding London

The table below provides summary statistics for permanent job vacancies advertised in the UK excluding London requiring knowledge or experience of Oracle products and/or services. It includes a benchmarking guide to the annual salaries offered in vacancies that cited Oracle over the 6 months leading up to 27 April 2025, comparing them to the same period in the previous two years.

The figures below represent the IT labour market in general and are not representative of salaries within the Oracle Corporation.

6 months to
27 Apr 2025
Same period 2024 Same period 2023
Rank 129 85 93
Rank change year-on-year -44 +8 -28
Permanent jobs citing Oracle 811 2,123 2,191
As % of all permanent jobs advertised in the UK excluding London 2.22% 3.03% 3.54%
As % of the Vendors category 6.43% 8.46% 8.33%
Number of salaries quoted 494 923 1,177
10th Percentile £40,750 £36,250 £36,250
25th Percentile £47,500 £43,500 £42,500
Median annual salary (50th Percentile) £60,000 £55,000 £55,000
Median % change year-on-year +9.09% - +4.76%
75th Percentile £71,250 £75,772 £71,250
90th Percentile £82,500 £90,000 £85,000
UK median annual salary £62,500 £60,500 £62,500
% change year-on-year +3.31% -3.20% +8.70%

All Vendors
UK excluding London

Oracle falls under the Vendor Products and Services category. For comparison with the information above, the following table provides summary statistics for all permanent job vacancies requiring knowledge or experience of all vendor products and services in the UK excluding London.

Permanent vacancies with a requirement for knowledge or experience of vendor products and services 12,609 25,096 26,293
As % of all permanent jobs advertised in the UK excluding London 34.47% 35.79% 42.51%
Number of salaries quoted 7,928 17,452 13,453
10th Percentile £25,500 £25,750 £27,500
25th Percentile £33,000 £31,750 £36,250
Median annual salary (50th Percentile) £50,000 £45,000 £50,000
Median % change year-on-year +11.11% -10.00% +5.26%
75th Percentile £63,750 £60,000 £65,000
90th Percentile £76,250 £73,750 £77,715
UK median annual salary £55,000 £50,000 £57,500
% change year-on-year +10.00% -13.04% +4.55%

Oracle
Job Vacancy Trend in the UK excluding London

Job postings citing Oracle as a proportion of all IT jobs advertised in the UK excluding London.
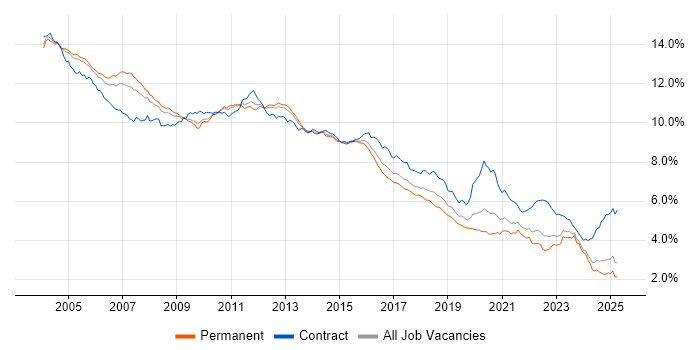
Job vacancy trend for Oracle in the UK excluding London

Oracle
Salary Trend in the UK excluding London

3-month moving average salary quoted in jobs citing Oracle in the UK excluding London.

Salary trend for Oracle in the UK excluding London

Oracle
Salary Histogram in the UK excluding London

Salary distribution for jobs citing Oracle in the UK excluding London over the 6 months to 27 April 2025.

Salary histogram for Oracle in the UK excluding London

Oracle
Job Locations in the UK excluding London

The table below looks at the demand and provides a guide to the median salaries quoted in IT jobs citing Oracle within the UK excluding London region over the 6 months to 27 April 2025. The 'Rank Change' column provides an indication of the change in demand within each location based on the same 6 month period last year.

Location Rank Change
on Same Period
Last Year
Matching
Permanent
IT Job Ads
Median Salary
Past 6 Months
Median Salary
% Change
on Same Period
Last Year
Live
Jobs
North of England -29 259 £57,500 -22.09% 180
North West -9 190 £55,000 -25.48% 107
South East -15 190 £60,000 +11.63% 192
Midlands +57 145 £60,000 +19.40% 109
West Midlands +79 115 £60,000 +2.56% 87
South West -4 86 £70,000 +16.67% 61
Scotland -37 69 £60,000 +11.11% 85
Yorkshire -20 50 £60,000 -18.70% 41
East of England +6 47 £49,250 -1.50% 39
East Midlands +7 30 £60,000 +33.33% 22
North East +10 17 £65,000 +23.81% 32
Northern Ireland +15 13 £55,000 -24.14% 47
Wales -48 7 £60,000 +26.32% 11
Isle of Man - 1 £34,500 -
Oracle
UK

Oracle
Co-occurring Skills and Capabilities in the UK excluding London by Category

The follow tables expand on the table above by listing co-occurrences grouped by category. The same employment type, locality and period is covered with up to 20 co-occurrences shown in each of the following categories:

Application Platforms
1 76 (9.37%) Oracle Application Server
2 28 (3.45%) IIS
3 21 (2.59%) Apache
4 18 (2.22%) Oracle SOA Suite
5 15 (1.85%) Tomcat
6 14 (1.73%) Apache Spark
6 14 (1.73%) SharePoint
7 9 (1.11%) Confluence
8 7 (0.86%) Camunda
8 7 (0.86%) nginx
9 6 (0.74%) WebSphere
10 5 (0.62%) JBoss
10 5 (0.62%) NetWeaver
10 5 (0.62%) Oracle Workflow
11 4 (0.49%) GemFire
11 4 (0.49%) SAS
11 4 (0.49%) WebSphere Application Server
12 2 (0.25%) ColdFusion
12 2 (0.25%) WebLogic
13 1 (0.12%) Oracle HTTP Server
Applications
1 30 (3.70%) Microsoft Office
2 11 (1.36%) Microsoft Excel
3 5 (0.62%) Microsoft PowerPoint
3 5 (0.62%) Spreadsheet
4 3 (0.37%) Oracle Smart View
5 2 (0.25%) MS Visio
Business Applications
1 71 (8.75%) Oracle EBS
2 38 (4.69%) Infor LN
2 38 (4.69%) SAP BPC
3 35 (4.32%) Oracle ERP
4 29 (3.58%) Oracle Applications
5 24 (2.96%) Dynamics AX
6 16 (1.97%) PeopleSoft HCM
7 14 (1.73%) Oracle Financials
8 13 (1.60%) Oracle Payables
9 12 (1.48%) Oracle Receivables
10 10 (1.23%) Oracle SCM
11 8 (0.99%) NEC Housing
11 8 (0.99%) NetSuite
11 8 (0.99%) Oracle Assets
12 7 (0.86%) Oracle Subledger Accounting
13 6 (0.74%) Oracle BPM
13 6 (0.74%) Oracle Procure-to-Pay
14 5 (0.62%) Oracle Cash Management
15 4 (0.49%) Oracle EBS R12
15 4 (0.49%) Salesforce CRM
Cloud Services
1 112 (13.81%) OCI
2 107 (13.19%) Azure
3 101 (12.45%) AWS
4 53 (6.54%) SaaS
5 34 (4.19%) Microsoft 365
6 33 (4.07%) GCP
7 29 (3.58%) PaaS
8 26 (3.21%) IBM Cloud
9 18 (2.22%) Power Platform
10 13 (1.60%) GitHub
11 12 (1.48%) Snowflake
12 10 (1.23%) Azure DevOps
12 10 (1.23%) IaaS
13 8 (0.99%) Amazon S3
13 8 (0.99%) OpenShift
14 7 (0.86%) Cloud Computing
15 6 (0.74%) Azure Data Factory
16 5 (0.62%) Entra ID
17 4 (0.49%) Power Automate
18 3 (0.37%) Azure Logic Apps
Communications & Networking
1 15 (1.85%) DNS
2 14 (1.73%) Firewall
3 10 (1.23%) SAN
4 9 (1.11%) HTTP
5 8 (0.99%) DHCP
5 8 (0.99%) NAS
6 7 (0.86%) VPN
7 6 (0.74%) LAN
7 6 (0.74%) TCP/IP
8 5 (0.62%) SSL
8 5 (0.62%) VSAN
9 4 (0.49%) FTP
9 4 (0.49%) Wireless
10 3 (0.37%) DMARC
10 3 (0.37%) HTTPS
10 3 (0.37%) IPsec
10 3 (0.37%) SSH
10 3 (0.37%) WAN
11 2 (0.25%) iSCSI
11 2 (0.25%) Network Security
Database & Business Intelligence
1 138 (17.02%) SQL Server
2 125 (15.41%) Oracle Reports
3 104 (12.82%) Data Warehouse
4 75 (9.25%) Enterprise Data Warehouse
5 67 (8.26%) Oracle Database
6 49 (6.04%) Tableau
7 41 (5.06%) PostgreSQL
8 34 (4.19%) MongoDB
8 34 (4.19%) MySQL
9 30 (3.70%) Relational Database
10 27 (3.33%) Oracle ODI
11 24 (2.96%) OLTP
12 17 (2.10%) Power BI
13 15 (1.85%) Big Data
13 15 (1.85%) NoSQL
14 13 (1.60%) Oracle BI Publisher
15 11 (1.36%) DB2
15 11 (1.36%) Metadata
16 10 (1.23%) RDBMS
17 9 (1.11%) BusinessObjects
Development Applications
1 85 (10.48%) Oracle Forms
2 43 (5.30%) Git
3 27 (3.33%) JIRA
4 16 (1.97%) Jenkins
5 9 (1.11%) JUnit
6 8 (0.99%) JDeveloper
7 7 (0.86%) GitLab
7 7 (0.86%) Oracle APEX
8 6 (0.74%) Eclipse
8 6 (0.74%) Selenium
9 5 (0.62%) ClearCase
9 5 (0.62%) Postman
9 5 (0.62%) Rational DOORS
10 4 (0.49%) Appium
10 4 (0.49%) Fiddler
10 4 (0.49%) JMeter
10 4 (0.49%) LoadRunner
10 4 (0.49%) NUnit
10 4 (0.49%) Visual Studio
11 3 (0.37%) Maven
General
1 324 (39.95%) Finance
2 237 (29.22%) Social Skills
3 203 (25.03%) Analytical Skills
4 86 (10.60%) Organisational Skills
5 78 (9.62%) Military
6 64 (7.89%) Public Sector
7 59 (7.27%) Retail
8 53 (6.54%) Manufacturing
8 53 (6.54%) Police
9 50 (6.17%) Banking
9 50 (6.17%) Inclusion and Diversity
10 41 (5.06%) Law
11 37 (4.56%) Aerospace
12 26 (3.21%) Telecoms
13 25 (3.08%) Games
14 19 (2.34%) Local Government
15 18 (2.22%) Legal
16 16 (1.97%) Marketing
17 14 (1.73%) General Ledger
18 11 (1.36%) Presentation Skills
Job Titles
1 146 (18.00%) Senior
2 133 (16.40%) Developer
3 122 (15.04%) Lead
4 78 (9.62%) Analyst
4 78 (9.62%) Consultant
5 61 (7.52%) Oracle Consultant
6 52 (6.41%) Oracle Developer
7 45 (5.55%) Architect
8 42 (5.18%) Team Leader
9 39 (4.81%) Accountant
9 39 (4.81%) Applications Support
10 38 (4.69%) Project Accountant
10 38 (4.69%) Senior Accountant
11 35 (4.32%) Senior Developer
12 32 (3.95%) Database Engineer
12 32 (3.95%) Software Developer
13 29 (3.58%) Senior Oracle Developer
14 28 (3.45%) Technical Consultant
15 27 (3.33%) Support Analyst
16 26 (3.21%) Software Engineer
Libraries, Frameworks & Software Standards
1 89 (10.97%) Oracle Fusion
2 52 (6.41%) XML
3 46 (5.67%) .NET
4 44 (5.43%) Middleware
4 44 (5.43%) React
5 39 (4.81%) SOAP
6 36 (4.44%) HTML
7 31 (3.82%) REST
8 29 (3.58%) JSON
9 20 (2.47%) Kafka
9 20 (2.47%) Node.js
10 19 (2.34%) Web Services
11 14 (1.73%) Spring
12 10 (1.23%) AngularJS
13 9 (1.11%) RESTful
14 8 (0.99%) CSS
15 7 (0.86%) J2EE
15 7 (0.86%) JSF
15 7 (0.86%) Oracle GoldenGate
15 7 (0.86%) Swagger
Miscellaneous
1 124 (15.29%) Management Information System
2 48 (5.92%) Blockchain
3 43 (5.30%) Hybrid Cloud
4 26 (3.21%) Data Structures
4 26 (3.21%) Legacy Systems
5 24 (2.96%) Onboarding
6 23 (2.84%) Robotics
7 22 (2.71%) Client/Server
8 20 (2.47%) Self-Motivation
9 19 (2.34%) Data Centre
10 18 (2.22%) Enterprise Software
11 16 (1.97%) Product Ownership
12 15 (1.85%) Cloud Native
12 15 (1.85%) Private Cloud
13 13 (1.60%) e-Learning
14 12 (1.48%) Operational Technology
15 11 (1.36%) SCADA
16 9 (1.11%) Manufacturing Execution System
17 8 (0.99%) Data Protection Act
18 7 (0.86%) Replication
Operating Systems
1 79 (9.74%) Linux
2 53 (6.54%) Windows
3 34 (4.19%) Unix
4 15 (1.85%) AIX
4 15 (1.85%) Windows Server
5 12 (1.48%) Red Hat Enterprise Linux
6 8 (0.99%) Oracle Linux
7 6 (0.74%) Solaris
8 4 (0.49%) Mac OS X
9 3 (0.37%) Android
9 3 (0.37%) Apple iOS
9 3 (0.37%) CentOS
10 2 (0.25%) SUSE
11 1 (0.12%) Mac OS
11 1 (0.12%) Rocky
11 1 (0.12%) Ubuntu
Processes & Methodologies
1 269 (33.17%) Agile
2 174 (21.45%) Problem-Solving
3 153 (18.87%) ITIL
4 146 (18.00%) DevOps
5 144 (17.76%) Analytics
6 142 (17.51%) ERP
7 111 (13.69%) Data Modelling
8 108 (13.32%) Business Intelligence
9 107 (13.19%) Service Management
10 105 (12.95%) Business Analysis
11 103 (12.70%) Data Management
12 92 (11.34%) Continuous Improvement
13 90 (11.10%) Customer Experience
14 85 (10.48%) Mentoring
15 84 (10.36%) Data Integration
16 79 (9.74%) SDLC
17 70 (8.63%) Migration
18 69 (8.51%) Software Engineering
19 67 (8.26%) Project Management
20 63 (7.77%) Change Management
Programming Languages
1 276 (34.03%) SQL
2 145 (17.88%) Java
3 118 (14.55%) PL/SQL
4 74 (9.12%) Python
5 60 (7.40%) C#
6 51 (6.29%) JavaScript
7 23 (2.84%) Shell Script
8 16 (1.97%) TypeScript
9 15 (1.85%) PowerShell
10 11 (1.36%) Korn
11 9 (1.11%) C-shell
11 9 (1.11%) T-SQL
11 9 (1.11%) VBA
12 8 (0.99%) Bash
13 7 (0.86%) C
13 7 (0.86%) Lua
14 5 (0.62%) Go
14 5 (0.62%) Groovy
15 4 (0.49%) R
15 4 (0.49%) Scala
Qualifications
1 119 (14.67%) Degree
2 83 (10.23%) DBS Check
3 74 (9.12%) Security Cleared
4 48 (5.92%) BPSS Clearance
5 41 (5.06%) ACCA
6 39 (4.81%) CIMA
7 38 (4.69%) SC Cleared
8 23 (2.84%) CISA
9 22 (2.71%) ISACA
10 18 (2.22%) Computer Science Degree
10 18 (2.22%) Oracle Certification
11 17 (2.10%) ITIL Certification
12 13 (1.60%) TOGAF Certification
13 9 (1.11%) PhD
14 8 (0.99%) Azure Certification
15 7 (0.86%) Microsoft Certification
15 7 (0.86%) OCP
15 7 (0.86%) PMI Certification
16 6 (0.74%) ISTQB
16 6 (0.74%) PMP
Quality Assurance & Compliance
1 39 (4.81%) IFRS
2 38 (4.69%) GAAP
3 26 (3.21%) QA
4 23 (2.84%) ITGC
5 21 (2.59%) SLA
6 17 (2.10%) Data Quality
7 16 (1.97%) Accessibility
8 7 (0.86%) GDPR
9 6 (0.74%) PMO
10 5 (0.62%) ISO/IEC 27001
11 2 (0.25%) COBIT
11 2 (0.25%) Dublin Core
11 2 (0.25%) NIST
12 1 (0.12%) COSO
12 1 (0.12%) Cyber Essentials
12 1 (0.12%) NCSC
12 1 (0.12%) PCI DSS
12 1 (0.12%) Sarbanes-Oxley
System Software
1 36 (4.44%) Docker
2 13 (1.60%) Active Directory
3 10 (1.23%) VMware Infrastructure
4 5 (0.62%) VMware NSX
5 4 (0.49%) KVM
6 3 (0.37%) Hyper-V
6 3 (0.37%) Virtual Machines
7 2 (0.25%) Firmware
7 2 (0.25%) NFS
7 2 (0.25%) Postfix
7 2 (0.25%) Sendmail
7 2 (0.25%) SRDF
7 2 (0.25%) Veritas Cluster Server
7 2 (0.25%) Xen
8 1 (0.12%) HDFS
8 1 (0.12%) LXC
8 1 (0.12%) Oracle RAC
8 1 (0.12%) Samba
Systems Management
1 27 (3.33%) Kubernetes
2 24 (2.96%) Terraform
3 16 (1.97%) Ansible
4 8 (0.99%) Oracle RMAN
5 7 (0.86%) Kibana
5 7 (0.86%) Puppet
6 5 (0.62%) Microsoft Intune
6 5 (0.62%) Progress Chef
6 5 (0.62%) Single Sign-On
6 5 (0.62%) Tivoli Storage Manager
6 5 (0.62%) ZABBIX
7 4 (0.49%) Grafana
7 4 (0.49%) HP ALM
8 3 (0.37%) Control-M
8 3 (0.37%) Nessus
8 3 (0.37%) NetBackup
8 3 (0.37%) Prometheus
9 2 (0.25%) Nagios
10 1 (0.12%) Backup Exec
10 1 (0.12%) QRadar
Vendors
1 103 (12.70%) SAP
2 91 (11.22%) Microsoft
3 59 (7.27%) IBM
4 43 (5.30%) Red Hat
5 39 (4.81%) Cognos
6 38 (4.69%) Infor
7 25 (3.08%) VMware
8 21 (2.59%) PeopleSoft
9 18 (2.22%) ServiceNow
10 14 (1.73%) Informatica
11 11 (1.36%) Workday
12 10 (1.23%) Google
13 9 (1.11%) Planview
13 9 (1.11%) Salesforce
14 8 (0.99%) NEC
15 6 (0.74%) Concur
15 6 (0.74%) HP
15 6 (0.74%) JD Edwards
15 6 (0.74%) MuleSoft
15 6 (0.74%) Splunk