Presentation Skills Jobs in the UK excluding London

Presentation Skills
UK > UK excluding London

The table below looks at the prevalence of the term Presentation Skills in permanent job vacancies in the UK excluding London. Included is a benchmarking guide to the salaries offered in vacancies that cited Presentation Skills over the 6 months leading up to 26 July 2024, comparing them to the same period in the previous two years.

6 months to
26 Jul 2024
Same period 2023 Same period 2022
Rank 124 105 128
Rank change year-on-year -19 +23 +64
Permanent jobs citing Presentation Skills 1,315 1,502 2,167
As % of all permanent jobs advertised in the UK excluding London 2.01% 3.12% 2.77%
As % of the General category 3.73% 4.75% 4.28%
Number of salaries quoted 509 424 956
10th Percentile £31,250 £32,800 £33,729
25th Percentile £40,988 £45,000 £42,494
Median annual salary (50th Percentile) £50,000 £56,630 £52,500
Median % change year-on-year -11.71% +7.87% +5.00%
75th Percentile £64,375 £70,250 £68,750
90th Percentile £85,221 £87,500 £78,568
UK median annual salary £55,000 £65,000 £60,000
% change year-on-year -15.38% +8.33% -

All General Skills
UK excluding London

Presentation Skills falls under the General Skills category. For comparison with the information above, the following table provides summary statistics for all permanent job vacancies requiring common skills in the UK excluding London.

Permanent vacancies with a requirement for common skills 35,229 31,627 50,647
As % of all permanent jobs advertised in the UK excluding London 53.97% 65.69% 64.67%
Number of salaries quoted 20,712 17,348 26,425
10th Percentile £26,250 £28,250 £28,750
25th Percentile £35,000 £37,500 £37,500
Median annual salary (50th Percentile) £47,557 £52,500 £50,000
Median % change year-on-year -9.42% +5.00% +5.26%
75th Percentile £62,500 £67,500 £65,720
90th Percentile £76,250 £81,250 £80,000
UK median annual salary £54,000 £60,000 £60,000
% change year-on-year -10.00% - +6.19%

Presentation Skills
Job Vacancy Trend in the UK excluding London

Job postings citing Presentation Skills as a proportion of all IT jobs advertised in the UK excluding London.
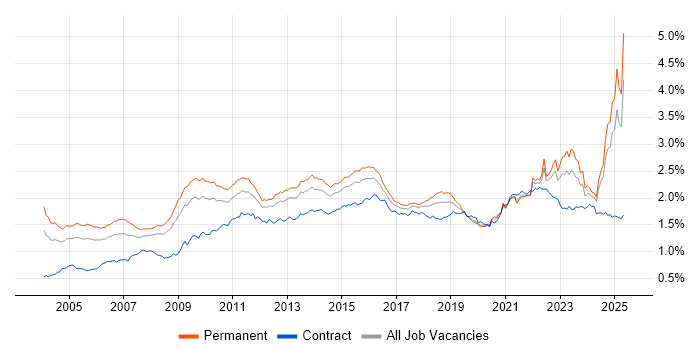
Job vacancy trend for Presentation Skills in the UK excluding London

Presentation Skills
Salary Trend in the UK excluding London

3-month moving average salary quoted in jobs citing Presentation Skills in the UK excluding London.

Salary trend for Presentation Skills in the UK excluding London

Presentation Skills
Salary Histogram in the UK excluding London

Salary distribution for jobs citing Presentation Skills in the UK excluding London over the 6 months to 26 July 2024.

Salary histogram for Presentation Skills in the UK excluding London

Presentation Skills
Job Locations in the UK excluding London

The table below looks at the demand and provides a guide to the median salaries quoted in IT jobs citing Presentation Skills within the UK excluding London region over the 6 months to 26 July 2024. The 'Rank Change' column provides an indication of the change in demand within each location based on the same 6 month period last year.

Location Rank Change
on Same Period
Last Year
Matching
Permanent
IT Job Ads
Median Salary
Past 6 Months
Median Salary
% Change
on Same Period
Last Year
Live
Jobs
North of England -17 328 £50,000 -9.09% 97
Midlands -8 290 £52,500 -12.50% 65
South East -9 248 £50,000 -21.57% 126
South West +42 216 £50,000 +5.26% 88
West Midlands -11 170 £55,000 -12.00% 40
North West -73 150 £55,000 - 60
Yorkshire +71 142 £47,500 - 33
East Midlands +2 120 £44,250 -19.55% 26
East of England +64 101 £52,500 -16.00% 60
Scotland -105 89 £50,000 -17.01% 13
North East +18 36 £39,000 -20.00% 6
Wales -48 30 £62,925 +128.82% 18
Northern Ireland -17 15 - - 12
Presentation Skills
UK

Presentation Skills
Co-occurring Skills and Capabilities in the UK excluding London by Category

The follow tables expand on the table above by listing co-occurrences grouped by category. The same employment type, locality and period is covered with up to 20 co-occurrences shown in each of the following categories:

Application Platforms
1 57 (4.33%) Confluence
2 23 (1.75%) SharePoint
3 9 (0.68%) Microsoft Exchange
4 7 (0.53%) MS Project Server
5 4 (0.30%) SAS
6 3 (0.23%) OpenStack
7 2 (0.15%) MTS
8 1 (0.076%) Apache
8 1 (0.076%) Apache Spark
8 1 (0.076%) ArcGIS
8 1 (0.076%) CMS
8 1 (0.076%) GeoServer
8 1 (0.076%) Liferay
8 1 (0.076%) nginx
8 1 (0.076%) Umbraco
Applications
1 113 (8.59%) Microsoft Excel
2 101 (7.68%) Microsoft Office
3 59 (4.49%) Microsoft PowerPoint
4 37 (2.81%) Microsoft Project
5 24 (1.83%) MS Visio
6 15 (1.14%) AutoCAD
7 8 (0.61%) Sketch
8 7 (0.53%) InVision
8 7 (0.53%) Spreadsheet
9 6 (0.46%) InDesign
9 6 (0.46%) Photoshop
10 4 (0.30%) Adobe Illustrator
11 2 (0.15%) Simulink
11 2 (0.15%) SketchUp
11 2 (0.15%) Trello
12 1 (0.076%) 3ds Max
12 1 (0.076%) Adobe Creative Suite
12 1 (0.076%) Adobe XD
12 1 (0.076%) Maya
12 1 (0.076%) MotionBuilder
Business Applications
1 10 (0.76%) NEC Housing
2 8 (0.61%) Dynamics CRM
3 5 (0.38%) NetSuite
3 5 (0.38%) Odoo
3 5 (0.38%) SAP WM
4 4 (0.30%) Primavera
4 4 (0.30%) SAP CO
4 4 (0.30%) SAP FI
4 4 (0.30%) SAP FI/CO
5 3 (0.23%) Salesforce CRM
6 2 (0.15%) Oracle Assets
6 2 (0.15%) Oracle EBS R12
6 2 (0.15%) Oracle Financials
6 2 (0.15%) Oracle General Ledger
6 2 (0.15%) Oracle Payables
6 2 (0.15%) Oracle Receivables
6 2 (0.15%) SAP S/4HANA
6 2 (0.15%) SAP SD
7 1 (0.076%) Dynamics NAV
7 1 (0.076%) Exchequer
Cloud Services
1 213 (16.20%) Azure
2 202 (15.36%) AWS
3 120 (9.13%) Microsoft 365
4 114 (8.67%) SaaS
5 92 (7.00%) Power Platform
6 91 (6.92%) GCP
7 21 (1.60%) GitHub
8 15 (1.14%) Figma
9 13 (0.99%) Azure DevOps
10 10 (0.76%) Dynamics 365
11 8 (0.61%) PaaS
12 7 (0.53%) IaaS
13 6 (0.46%) Azure Storage
13 6 (0.46%) OCI
13 6 (0.46%) PowerApps
13 6 (0.46%) Snowflake
13 6 (0.46%) WhatsApp
14 5 (0.38%) Adobe Analytics
15 4 (0.30%) Cloud Computing
15 4 (0.30%) Entra ID
Communications & Networking
1 29 (2.21%) 5G
1 29 (2.21%) WAN
2 25 (1.90%) SD-WAN
3 16 (1.22%) Intranet
4 15 (1.14%) Firewall
5 10 (0.76%) DNS
5 10 (0.76%) TCP/IP
6 9 (0.68%) Internet
6 9 (0.68%) Wi-Fi
7 8 (0.61%) HTTP
7 8 (0.61%) SMTP
8 6 (0.46%) 4G
8 6 (0.46%) Unified Communications
8 6 (0.46%) VPN
9 5 (0.38%) Network Security
9 5 (0.38%) RFID
10 4 (0.30%) LAN
10 4 (0.30%) NGFW
11 3 (0.23%) SSL
11 3 (0.23%) WebEx
Database & Business Intelligence
1 83 (6.31%) Data Warehouse
2 75 (5.70%) Power BI
3 62 (4.71%) Tableau
4 41 (3.12%) Data Lake
5 40 (3.04%) Azure SQL Data Warehouse
6 31 (2.36%) Data Vault
7 19 (1.44%) Big Data
7 19 (1.44%) SQL Server
8 10 (0.76%) SQL Server Integration Services
9 9 (0.68%) Azure SQL Database
10 7 (0.53%) Power Query
11 6 (0.46%) PostgreSQL
12 5 (0.38%) Oracle Reports
13 4 (0.30%) Data Mining
13 4 (0.30%) Electronic Patient Records
14 3 (0.23%) Amazon Athena
14 3 (0.23%) Relational Database
14 3 (0.23%) SQL Server Reporting Services
15 2 (0.15%) GIS
15 2 (0.15%) Oracle Database
Development Applications
1 68 (5.17%) JIRA
2 61 (4.64%) Git
3 24 (1.83%) Bitbucket
3 24 (1.83%) Visual Studio
4 23 (1.75%) Sourcetree
5 13 (0.99%) AdminStudio
5 13 (0.99%) InstallShield
5 13 (0.99%) LabVIEW
5 13 (0.99%) MSI
6 10 (0.76%) Jenkins
7 9 (0.68%) Moq
8 7 (0.53%) NUnit
9 2 (0.15%) Subversion
10 1 (0.076%) Gatling
10 1 (0.076%) JMeter
10 1 (0.076%) LoadRunner
10 1 (0.076%) Rational DOORS
10 1 (0.076%) Rational Rhapsody
10 1 (0.076%) Team Foundation Server
10 1 (0.076%) Zephyr
General
1 900 (68.44%) Social Skills
2 323 (24.56%) Finance
3 317 (24.11%) Retail
4 261 (19.85%) Analytical Skills
5 100 (7.60%) Marketing
6 97 (7.38%) Inclusion and Diversity
7 87 (6.62%) Local Government
8 83 (6.31%) Public Sector
9 74 (5.63%) Law
10 59 (4.49%) Organisational Skills
11 52 (3.95%) Banking
12 51 (3.88%) Billing
13 49 (3.73%) Investment Banking
14 46 (3.50%) Influencing Skills
15 44 (3.35%) Games
16 36 (2.74%) Legal
17 30 (2.28%) Aerospace
17 30 (2.28%) Telecoms
18 27 (2.05%) Manufacturing
19 26 (1.98%) Electronics
Job Titles
1 189 (14.37%) Senior
2 140 (10.65%) Analyst
3 135 (10.27%) Architect
4 95 (7.22%) Consultant
5 72 (5.48%) Cloud Architect
5 72 (5.48%) Project Manager
6 71 (5.40%) Lead
7 66 (5.02%) Developer
8 64 (4.87%) Business Manager
9 61 (4.64%) Business Development Manager
9 61 (4.64%) Development Manager
10 49 (3.73%) Senior Manager
11 46 (3.50%) Senior Consultant
12 42 (3.19%) Data Consultant
13 41 (3.12%) Service Manager
14 40 (3.04%) Senior Technology Consultant
14 40 (3.04%) Technology Consultant
15 39 (2.97%) Data Analyst
15 39 (2.97%) IT Manager
16 35 (2.66%) Data Architect
Libraries, Frameworks & Software Standards
1 23 (1.75%) Unity (Game Engine)
2 13 (0.99%) pytest
3 11 (0.84%) .NET
4 9 (0.68%) .NET Core
4 9 (0.68%) .NET Framework
5 8 (0.61%) ASP.NET Web API
5 8 (0.61%) jQuery
6 7 (0.53%) AngularJS
6 7 (0.53%) LINQ
6 7 (0.53%) LINQ to SQL
6 7 (0.53%) Razor View Engine
7 6 (0.46%) EDI
7 6 (0.46%) HTML
8 3 (0.23%) OpenACC
8 3 (0.23%) OpenMP
8 3 (0.23%) Oracle Fusion
8 3 (0.23%) REST
8 3 (0.23%) Web Services
9 2 (0.15%) Entity Framework
9 2 (0.15%) PySpark
Miscellaneous
1 237 (18.02%) Onboarding
2 108 (8.21%) Self-Motivation
3 73 (5.55%) Public Cloud
4 70 (5.32%) PKI
5 51 (3.88%) Driving Licence
6 47 (3.57%) NHS
7 42 (3.19%) Management Information System
8 41 (3.12%) Product Ownership
9 40 (3.04%) Mobile App
10 38 (2.89%) iPad
11 35 (2.66%) Housing Association
12 33 (2.51%) STB
13 26 (1.98%) Life Science
14 25 (1.90%) Cloud Native
14 25 (1.90%) Virtual Reality
15 23 (1.75%) Data Centre
16 18 (1.37%) Biopharmaceutical
17 15 (1.14%) Foreign Exchange (FX)
18 14 (1.06%) Low-Code
18 14 (1.06%) Robotics
Operating Systems
1 68 (5.17%) Windows
2 33 (2.51%) Linux
3 23 (1.75%) Unix
4 17 (1.29%) Windows 7
5 14 (1.06%) Windows 10
6 12 (0.91%) Windows Vista
7 10 (0.76%) Windows Server
8 8 (0.61%) Android
9 7 (0.53%) Apple iOS
10 4 (0.30%) Red Hat Enterprise Linux
11 3 (0.23%) SUSE Linux Enterprise Server
11 3 (0.23%) Ubuntu
12 2 (0.15%) CentOS
13 1 (0.076%) Windows Phone
Processes & Methodologies
1 575 (43.73%) Problem-Solving
2 360 (27.38%) Data Analysis
3 330 (25.10%) Project Management
4 303 (23.04%) Mentoring
5 289 (21.98%) Customer Service
6 280 (21.29%) Mathematics
7 225 (17.11%) Mechatronics
8 199 (15.13%) Agile
9 188 (14.30%) Business Development
10 156 (11.86%) Presales
11 150 (11.41%) Actionable Insight
11 150 (11.41%) Analytics
12 143 (10.87%) Roadmaps
13 127 (9.66%) Project Delivery
14 116 (8.82%) Artificial Intelligence
15 115 (8.75%) TOGAF
16 111 (8.44%) Coaching
17 108 (8.21%) DevOps
18 107 (8.14%) Migration
19 93 (7.07%) Decision-Making
Programming Languages
1 88 (6.69%) Python
2 67 (5.10%) SQL
3 46 (3.50%) C#
4 28 (2.13%) C++
5 26 (1.98%) PowerShell
6 22 (1.67%) MATLAB
7 21 (1.60%) C
8 14 (1.06%) VB
9 12 (0.91%) R
10 11 (0.84%) JavaScript
11 9 (0.68%) Java
12 8 (0.61%) Data Analysis Expressions
13 5 (0.38%) VBA
14 3 (0.23%) Bash
14 3 (0.23%) C-shell
14 3 (0.23%) Fortran
14 3 (0.23%) Scala
15 2 (0.15%) Embedded C
15 2 (0.15%) Embedded C++
15 2 (0.15%) T-SQL
Qualifications
1 576 (43.80%) Degree
2 226 (17.19%) HNC
3 81 (6.16%) Security Cleared
4 71 (5.40%) SC Cleared
5 58 (4.41%) Azure Certification
6 57 (4.33%) ACCA
7 51 (3.88%) DBS Check
8 44 (3.35%) AWS Certification
9 33 (2.51%) BPSS Clearance
10 28 (2.13%) Computer Science Degree
11 23 (1.75%) HND
12 19 (1.44%) APMP
13 14 (1.06%) CIMA
14 13 (0.99%) DV Cleared
15 11 (0.84%) Microsoft Certification
16 10 (0.76%) Master's Degree
17 7 (0.53%) PMI Certification
17 7 (0.53%) TOGAF Certification
18 6 (0.46%) PMP
19 4 (0.30%) CRISC
Quality Assurance & Compliance
1 53 (4.03%) PMO
2 44 (3.35%) GAAP
3 43 (3.27%) IFRS
4 34 (2.59%) SLA
5 23 (1.75%) Accessibility
6 21 (1.60%) GDPR
7 19 (1.44%) ISO/IEC 27001
8 18 (1.37%) QA
9 15 (1.14%) Good Clinical Practice
10 14 (1.06%) ISO 9001
11 12 (0.91%) Actionable Recommendations
12 10 (0.76%) ISO 22301
13 9 (0.68%) Sarbanes-Oxley
14 5 (0.38%) NIST
14 5 (0.38%) SEPA
14 5 (0.38%) TARGET2
15 4 (0.30%) COBIT
15 4 (0.30%) Cyber Essentials
15 4 (0.30%) Data Quality
16 3 (0.23%) JTAG
System Software
1 21 (1.60%) VMware Infrastructure
2 20 (1.52%) Active Directory
3 13 (0.99%) Microsoft App-V
4 9 (0.68%) Firmware
5 8 (0.61%) Embedded Firmware
6 6 (0.46%) Virtual Desktop
7 5 (0.38%) Hyper-V
8 4 (0.30%) Docker
9 3 (0.23%) Ceph
9 3 (0.23%) GPFS
9 3 (0.23%) Lustre
9 3 (0.23%) Slurm Workload Manager
9 3 (0.23%) Virtual Servers
Systems Management
1 16 (1.22%) SCCM
2 13 (0.99%) WSUS
3 6 (0.46%) Graphite
3 6 (0.46%) Kubernetes
4 4 (0.30%) Microsoft Intune
5 3 (0.23%) Ansible
5 3 (0.23%) Podman
6 2 (0.15%) SCOM
6 2 (0.15%) Terraform
7 1 (0.076%) Autotask
7 1 (0.076%) Functional Safety
7 1 (0.076%) Nagios
7 1 (0.076%) Puppet
7 1 (0.076%) ZABBIX
Vendors
1 337 (25.63%) Microsoft
2 78 (5.93%) Google
3 43 (3.27%) CA
4 42 (3.19%) Salesforce
5 40 (3.04%) SAP
6 30 (2.28%) Oracle
7 29 (2.21%) ServiceNow
8 28 (2.13%) Databricks
9 22 (1.67%) Adobe
9 22 (1.67%) VMware
10 14 (1.06%) Autodesk
11 10 (0.76%) NEC
12 9 (0.68%) Cisco
13 6 (0.46%) Dell
13 6 (0.46%) Facebook
13 6 (0.46%) Hotjar
13 6 (0.46%) IBM
14 5 (0.38%) Glassbox
14 5 (0.38%) Palo Alto
14 5 (0.38%) YouTube