TeamCity Contracts in England

JetBrains TeamCity
UK > England

The following table provides summary statistics for contract job vacancies advertised in England with a requirement for TeamCity skills. Included is a benchmarking guide to the contractor rates offered in vacancies that have cited TeamCity over the 6 months to 29 April 2024 with a comparison to the same period in the previous 2 years.

6 months to
29 Apr 2024
Same period 2023 Same period 2022
Rank 395 387 308
Rank change year-on-year -8 -79 +45
Contract jobs citing TeamCity 149 278 651
As % of all contract jobs advertised in England 0.40% 0.55% 0.92%
As % of the Development Applications category 3.50% 3.69% 5.10%
Number of daily rates quoted 109 231 481
10th Percentile £495 £450 £475
25th Percentile £563 £520 £538
Median daily rate (50th Percentile) £650 £630 £683
Median % change year-on-year +3.17% -7.69% +24.09%
75th Percentile £788 £750 £763
90th Percentile £850 £825 £825
UK median daily rate £625 £618 £650
% change year-on-year +1.21% -5.00% +18.18%
Number of hourly rates quoted 0 1 1
10th Percentile - - -
25th Percentile - £52.50 £53.75
Median hourly rate - £55.00 £57.50
Median % change year-on-year - -4.35% +69.12%
75th Percentile - £57.50 £61.25
90th Percentile - - -
UK median hourly rate - £55.00 £57.50
% change year-on-year - -4.35% +69.12%

All Development Application Skills
England

TeamCity is in the Development Applications category. The following table is for comparison with the above and provides summary statistics for all contract job vacancies advertised in England with a requirement for development application skills.

Contract vacancies with a requirement for development application skills 4,260 7,542 12,771
As % of all contract IT jobs advertised in England 11.45% 14.95% 17.98%
Number of daily rates quoted 2,905 5,319 9,060
10th Percentile £355 £375 £400
25th Percentile £425 £463 £463
Median daily rate (50th Percentile) £535 £550 £550
Median % change year-on-year -2.73% - +10.00%
75th Percentile £638 £675 £655
90th Percentile £738 £775 £750
UK median daily rate £525 £550 £550
% change year-on-year -4.55% - +12.02%
Number of hourly rates quoted 180 222 186
10th Percentile £31.71 £45.00 £37.75
25th Percentile £52.50 £52.56 £39.75
Median hourly rate £65.00 £61.34 £50.50
Median % change year-on-year +5.97% +21.46% +6.45%
75th Percentile £70.00 £70.00 £62.23
90th Percentile £82.75 £80.00 £75.00
UK median hourly rate £65.00 £61.50 £50.50
% change year-on-year +5.69% +21.78% +12.22%

TeamCity
Job Vacancy Trend in England

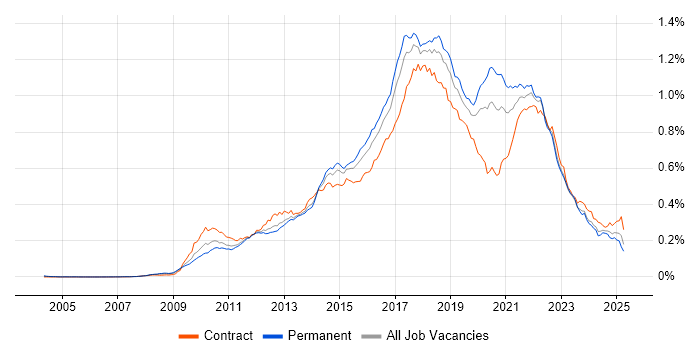
Job postings citing TeamCity as a proportion of all IT jobs advertised in England.

Job vacancy trend for TeamCity in England

TeamCity
Contractor Daily Rate Trend in England

3-month moving average daily rate quoted in jobs citing TeamCity in England.

Daily rate trend for TeamCity in England

TeamCity
Daily Rate Histogram in England

Daily rate distribution for jobs citing TeamCity in England over the 6 months to 29 April 2024.

Daily rate histogram for TeamCity in England

TeamCity
Contractor Hourly Rate Trend in England

3-month moving average hourly rates quoted in jobs citing TeamCity in England.

Hourly rate trend for TeamCity in England

TeamCity
Contract Job Locations in England

The table below looks at the demand and provides a guide to the median contractor rates quoted in IT jobs citing TeamCity within the England region over the 6 months to 29 April 2024. The 'Rank Change' column provides an indication of the change in demand within each location based on the same 6 month period last year.

Location Rank Change
on Same Period
Last Year
Matching
Contract
IT Job Ads
Median
Daily Rate
Past 6 Months
Median Daily Rate
% Change
on Same Period
Last Year
Live
Jobs
London +48 133 £700 - 19
Midlands +27 6 £356 -26.97%
North of England -10 6 £500 -9.09% 9
North West -12 6 £500 -9.09% 4
East Midlands +24 5 £356 -32.19%
South West +8 3 £319 -42.05% 1
West Midlands +25 1 £450 +33.33%
South East +14 1 £550 -12.00% 7
TeamCity
UK

TeamCity
Co-occurring Skills and Capabilities in England by Category

The follow tables expand on the table above by listing co-occurrences grouped by category. The same employment type, locality and period is covered with up to 20 co-occurrences shown in each of the following categories:

Application Platforms
1 19 (12.75%) Confluence
2 5 (3.36%) Anypoint
2 5 (3.36%) Apache Spark
2 5 (3.36%) JBoss
3 2 (1.34%) EPiServer
3 2 (1.34%) Mule
3 2 (1.34%) SAS
4 1 (0.67%) CMS
4 1 (0.67%) IIS
Applications
1 11 (7.38%) Microsoft Excel
1 11 (7.38%) Microsoft PowerPoint
1 11 (7.38%) MS Visio
2 2 (1.34%) Microsoft Office
Business Applications
1 6 (4.03%) ION MarketView
2 3 (2.01%) IntelliMatch
2 3 (2.01%) ION Anvil
3 1 (0.67%) Endur
Cloud Services
1 35 (23.49%) Azure
2 28 (18.79%) AWS
3 15 (10.07%) Azure DevOps
4 14 (9.40%) PaaS
5 13 (8.72%) OpenShift
5 13 (8.72%) SaaS
6 9 (6.04%) Cloud Computing
6 9 (6.04%) GCP
7 8 (5.37%) GitHub
7 8 (5.37%) IaaS
7 8 (5.37%) Nutanix
7 8 (5.37%) Rubrik
8 6 (4.03%) Serverless
9 5 (3.36%) Apigee
9 5 (3.36%) AWS Lambda
9 5 (3.36%) Azure Monitor
10 3 (2.01%) Sumo Logic
11 2 (1.34%) npm
11 2 (1.34%) NuGet
11 2 (1.34%) Yarn
Communications & Networking
1 16 (10.74%) Firewall
2 11 (7.38%) FIX Connectivity
3 8 (5.37%) DHCP
3 8 (5.37%) DNS
3 8 (5.37%) Kerberos
3 8 (5.37%) NAS
3 8 (5.37%) SAN
3 8 (5.37%) TCP/IP
3 8 (5.37%) VLAN
4 4 (2.68%) Network Security
Database & Business Intelligence
1 32 (21.48%) SQL Server
2 26 (17.45%) NoSQL
3 25 (16.78%) Relational Database
4 8 (5.37%) MongoDB
5 7 (4.70%) Elasticsearch
6 6 (4.03%) SQL Server Integration Services
6 6 (4.03%) SQL Server Reporting Services
7 5 (3.36%) Apache Hive
7 5 (3.36%) Big Data
7 5 (3.36%) Hadoop
7 5 (3.36%) HBase
7 5 (3.36%) RDBMS
8 4 (2.68%) KDB
8 4 (2.68%) PostgreSQL
9 3 (2.01%) Redis
10 2 (1.34%) Apache Cassandra
10 2 (1.34%) DynamoDB
10 2 (1.34%) RavenDB
11 1 (0.67%) Couchbase
11 1 (0.67%) Data Lake
Development Applications
1 54 (36.24%) Git
2 51 (34.23%) Jenkins
3 45 (30.20%) JIRA
4 25 (16.78%) Octopus Deploy
5 22 (14.77%) NUnit
6 14 (9.40%) Cucumber
7 13 (8.72%) Bitbucket
8 12 (8.05%) Moq
9 11 (7.38%) Maven
10 10 (6.71%) Selenium
11 9 (6.04%) Sonatype Nexus
12 8 (5.37%) Artifactory
13 6 (4.03%) Gradle
14 5 (3.36%) Bitbucket Server
14 5 (3.36%) CA Release Automation
14 5 (3.36%) GitLab
14 5 (3.36%) SonarQube
14 5 (3.36%) SpecFlow
14 5 (3.36%) Subversion
15 4 (2.68%) Jasmine
General
1 42 (28.19%) Banking
2 40 (26.85%) Front Office
3 36 (24.16%) Analytical Skills
4 30 (20.13%) Finance
5 28 (18.79%) Social Skills
6 25 (16.78%) Investment Banking
7 4 (2.68%) Inclusion and Diversity
7 4 (2.68%) Law
8 2 (1.34%) Agriculture
8 2 (1.34%) Retail
9 1 (0.67%) Back Office
9 1 (0.67%) Financial Institution
9 1 (0.67%) Public Sector
9 1 (0.67%) Tech for Good
Job Titles
1 59 (39.60%) Developer
2 33 (22.15%) DevOps Engineer
3 30 (20.13%) C# Developer
4 19 (12.75%) Senior
5 12 (8.05%) .NET Developer
6 11 (7.38%) Business Analyst
6 11 (7.38%) Electronic Trading Business Analyst
6 11 (7.38%) Front Office Business Analyst
6 11 (7.38%) Investment Banking Business Analyst
7 10 (6.71%) Senior DevOps
8 9 (6.04%) Java Developer
8 9 (6.04%) Senior DevOps Engineer
8 9 (6.04%) UI Developer
9 8 (5.37%) Electronic Trading Developer
9 8 (5.37%) Full Stack Developer
9 8 (5.37%) React Developer
10 7 (4.70%) Analyst
10 7 (4.70%) C# .NET Developer
11 6 (4.03%) Architect
11 6 (4.03%) Senior Developer
Libraries, Frameworks & Software Standards
1 60 (40.27%) .NET
2 30 (20.13%) .NET Core
3 27 (18.12%) RabbitMQ
4 24 (16.11%) WCF
5 23 (15.44%) REST
6 21 (14.09%) ASP.NET
7 19 (12.75%) ASP.NET Web API
8 18 (12.08%) WinForms
9 17 (11.41%) React
10 15 (10.07%) CSS
10 15 (10.07%) RESTful
10 15 (10.07%) WPF
11 14 (9.40%) .NET Framework
11 14 (9.40%) Redux
12 13 (8.72%) AngularJS
12 13 (8.72%) Middleware
12 13 (8.72%) XML
13 12 (8.05%) SignalR
14 11 (7.38%) FIX Protocol
14 11 (7.38%) Reactive Extensions
Miscellaneous
1 24 (16.11%) Fixed Income
2 19 (12.75%) Derivative
3 13 (8.72%) Product Ownership
4 12 (8.05%) Greenfield Project
5 8 (5.37%) Clustering
5 8 (5.37%) Replication
6 7 (4.70%) Algorithms
7 5 (3.36%) Public Cloud
8 4 (2.68%) Equities
9 2 (1.34%) Data Structures
9 2 (1.34%) Distributed Systems
9 2 (1.34%) Enterprise Software
9 2 (1.34%) Foreign Exchange (FX)
9 2 (1.34%) Virtual Team
10 1 (0.67%) Distributed Computing
10 1 (0.67%) Mobile App
Operating Systems
1 33 (22.15%) Windows
2 23 (15.44%) Linux
3 21 (14.09%) Unix
4 13 (8.72%) Red Hat Enterprise Linux
5 11 (7.38%) Windows Server
6 8 (5.37%) Oracle Linux
6 8 (5.37%) Solaris
7 7 (4.70%) Android
7 7 (4.70%) Apple iOS
Processes & Methodologies
1 67 (44.97%) CI/CD
2 65 (43.62%) DevOps
3 63 (42.28%) Agile
3 63 (42.28%) Continuous Integration
4 45 (30.20%) Test Automation
5 37 (24.83%) Microservices
6 36 (24.16%) Electronic Trading
7 32 (21.48%) TDD
8 30 (20.13%) Migration
9 23 (15.44%) Continuous Improvement
10 21 (14.09%) Design Patterns
10 21 (14.09%) Unit Testing
11 19 (12.75%) Continuous Delivery
12 18 (12.08%) OO
13 17 (11.41%) Deployment Automation
13 17 (11.41%) Problem-Solving
14 16 (10.74%) Asynchronous Programming
14 16 (10.74%) Containerisation
14 16 (10.74%) Scrum
14 16 (10.74%) SDLC
Programming Languages
1 82 (55.03%) SQL
2 73 (48.99%) C#
3 35 (23.49%) Python
4 28 (18.79%) PowerShell
5 25 (16.78%) Java
6 18 (12.08%) JavaScript
7 16 (10.74%) TypeScript
8 11 (7.38%) Bash
9 6 (4.03%) PL/SQL
9 6 (4.03%) Scala
10 5 (3.36%) C++
10 5 (3.36%) Perl
10 5 (3.36%) Shell Script
11 3 (2.01%) C
12 2 (1.34%) T-SQL
13 1 (0.67%) Groovy
13 1 (0.67%) Ruby
Qualifications
1 21 (14.09%) Degree
2 3 (2.01%) Computer Science Degree
3 2 (1.34%) Security Cleared
4 1 (0.67%) DV Cleared
4 1 (0.67%) Master's Degree
4 1 (0.67%) SC Cleared
Quality Assurance & Compliance
1 19 (12.75%) QA
2 9 (6.04%) MiFID
3 8 (5.37%) GDPR
3 8 (5.37%) Sarbanes-Oxley
4 7 (4.70%) Dodd-Frank
4 7 (4.70%) EMIR
5 1 (0.67%) SLA
System Software
1 42 (28.19%) Docker
2 20 (13.42%) Active Directory
3 8 (5.37%) VMware Infrastructure
4 5 (3.36%) HDFS
Systems Management
1 36 (24.16%) Kubernetes
2 24 (16.11%) Terraform
3 22 (14.77%) Ansible
4 8 (5.37%) EMC NetWorker
4 8 (5.37%) Netcool
4 8 (5.37%) Tivoli
4 8 (5.37%) Tivoli Storage Manager
5 6 (4.03%) Progress Chef
6 5 (3.36%) Hadoop YARN
6 5 (3.36%) Kibana
7 3 (2.01%) Rancher
8 1 (0.67%) Argo
8 1 (0.67%) Control-M
8 1 (0.67%) Grafana
8 1 (0.67%) Istio
8 1 (0.67%) linkerd
8 1 (0.67%) Prometheus
8 1 (0.67%) Puppet
8 1 (0.67%) SELinux
Vendors
1 24 (16.11%) Microsoft
1 24 (16.11%) Oracle
2 16 (10.74%) ION Trading
3 14 (9.40%) Bloomberg
4 13 (8.72%) Splunk
5 12 (8.05%) TIBCO
6 11 (7.38%) MarketAxess
6 11 (7.38%) Tradeweb
7 10 (6.71%) IBM
8 8 (5.37%) Cisco
8 8 (5.37%) CyberArk
8 8 (5.37%) Dell
8 8 (5.37%) EMC
8 8 (5.37%) HP
8 8 (5.37%) Isilon
8 8 (5.37%) Qualys
8 8 (5.37%) SAP
8 8 (5.37%) Serena
8 8 (5.37%) ServiceNow
8 8 (5.37%) VMware