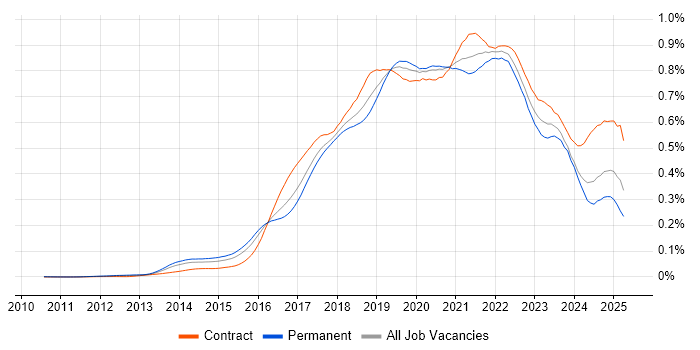
Bitbucket Contracts in England

Bitbucket
UK > England

The table below provides summary statistics for contract job vacancies advertised in England requiring Bitbucket skills. It includes a benchmarking guide to the contractor rates offered in vacancies that cited Bitbucket over the 6 months leading up to 3 July 2025, comparing them to the same period in the previous two years.

6 months to
3 Jul 2025
Same period 2024 Same period 2023
Rank 350 376 355
Rank change year-on-year +26 -21 -43
Contract jobs citing Bitbucket 150 181 310
As % of all contract jobs advertised in England 0.57% 0.48% 0.65%
As % of the Development Applications category 4.05% 3.98% 4.67%
Number of daily rates quoted 118 116 225
10th Percentile £312 £395 £450
25th Percentile £413 £484 £506
Median daily rate (50th Percentile) £531 £650 £575
Median % change year-on-year -18.38% +13.04% +4.55%
75th Percentile £647 £700 £694
90th Percentile £813 £769 £833
UK median daily rate £506 £625 £560
% change year-on-year -19.00% +11.61% +1.82%
Number of hourly rates quoted 6 24 11
10th Percentile £51.78 £45.88 £51.25
25th Percentile £53.13 £56.25 £53.13
Median hourly rate £56.38 £70.00 £57.50
Median % change year-on-year -19.46% +21.74% +4.55%
75th Percentile £61.91 - £62.50
90th Percentile £66.25 £75.00 £73.75
UK median hourly rate £57.75 £70.00 £57.50
% change year-on-year -17.50% +21.74% +4.55%

All Development Application Skills
England

Bitbucket falls under the Development Applications category. For comparison with the information above, the following table provides summary statistics for all contract job vacancies requiring development application skills in England.

Contract vacancies with a requirement for development application skills 3,704 4,553 6,641
As % of all contract IT jobs advertised in England 14.19% 12.18% 14.03%
Number of daily rates quoted 2,529 3,056 4,733
10th Percentile £332 £350 £363
25th Percentile £409 £425 £460
Median daily rate (50th Percentile) £500 £525 £550
Median % change year-on-year -4.76% -4.55% -
75th Percentile £600 £638 £675
90th Percentile £706 £725 £775
UK median daily rate £500 £525 £550
% change year-on-year -4.76% -4.55% -
Number of hourly rates quoted 79 231 202
10th Percentile £28.32 £33.00 £48.20
25th Percentile £50.00 £51.88 £53.75
Median hourly rate £62.50 £65.00 £62.00
Median % change year-on-year -3.85% +4.84% +18.10%
75th Percentile £73.75 £70.00 £75.00
90th Percentile £80.00 £75.00 £90.00
UK median hourly rate £59.50 £65.00 £62.50
% change year-on-year -8.46% +4.00% +18.72%

Bitbucket
Job Vacancy Trend in England

Job postings citing Bitbucket as a proportion of all IT jobs advertised in England.

Job vacancy trend for Bitbucket in England

Bitbucket
Contractor Daily Rate Trend in England

3-month moving average daily rate quoted in jobs citing Bitbucket in England.

Daily rate trend for Bitbucket in England

Bitbucket
Daily Rate Histogram in England

Daily rate distribution for jobs citing Bitbucket in England over the 6 months to 3 July 2025.

Daily rate histogram for Bitbucket in England

Bitbucket
Contractor Hourly Rate Trend in England

3-month moving average hourly rates quoted in jobs citing Bitbucket in England.

Hourly rate trend for Bitbucket in England

Bitbucket
Hourly Rate Histogram in England

Hourly rate distribution of jobs citing Bitbucket in England over the 6 months to 3 July 2025.

Hourly rate histogram for Bitbucket in England

Bitbucket
Contract Job Locations in England

The table below looks at the demand and provides a guide to the median contractor rates quoted in IT jobs citing Bitbucket within the England region over the 6 months to 3 July 2025. The 'Rank Change' column provides an indication of the change in demand within each location based on the same 6 month period last year.

Location Rank Change
on Same Period
Last Year
Matching
Contract
IT Job Ads
Median
Daily Rate
Past 6 Months
Median Daily Rate
% Change
on Same Period
Last Year
Live
Jobs
London +57 73 £625 -3.85% 233
South West +15 23 £575 -17.86% 47
South East +19 17 £606 +34.56% 94
North of England 0 17 £345 -31.95% 83
Midlands +17 15 £349 -36.55% 31
North West +1 15 £345 -34.29% 54
East Midlands +9 9 £311 -58.53% 10
West Midlands +5 6 £460 -16.36% 21
Yorkshire +4 2 - - 22
East of England +23 1 £500 -23.08% 26
Bitbucket
UK

Bitbucket
Co-occurring Skills and Capabilities in England by Category

The follow tables expand on the table above by listing co-occurrences grouped by category. The same employment type, locality and period is covered with up to 20 co-occurrences shown in each of the following categories:

Application Platforms
1 57 (38.00%) Confluence
2 9 (6.00%) JBoss
3 7 (4.67%) Tomcat
3 7 (4.67%) WebLogic
3 7 (4.67%) WebSphere
4 5 (3.33%) Apache
4 5 (3.33%) SharePoint
5 3 (2.00%) Microsoft Exchange
5 3 (2.00%) Skype for Business
6 2 (1.33%) Anypoint
6 2 (1.33%) nginx
7 1 (0.67%) Apache Airflow
7 1 (0.67%) Camunda
7 1 (0.67%) Mule
Applications
1 5 (3.33%) Microsoft Office
Business Applications
1 2 (1.33%) Magento
Cloud Services
1 53 (35.33%) AWS
2 26 (17.33%) GitHub
3 19 (12.67%) Azure
4 11 (7.33%) Amazon S3
5 9 (6.00%) GCP
5 9 (6.00%) OpenShift
5 9 (6.00%) Serverless
6 8 (5.33%) Azure DevOps
7 7 (4.67%) AWS Lambda
8 4 (2.67%) Amazon SQS
8 4 (2.67%) AWS CloudFormation
9 3 (2.00%) Amazon CloudWatch
9 3 (2.00%) Amazon Cognito
9 3 (2.00%) Amazon EC2
9 3 (2.00%) GitHub Actions
10 2 (1.33%) AWS CodeBuild
10 2 (1.33%) Azure Cognitive Services
10 2 (1.33%) Power Automate
10 2 (1.33%) Power Platform
10 2 (1.33%) Vertex AI
Communications & Networking
1 7 (4.67%) DNS
2 5 (3.33%) Firewall
2 5 (3.33%) HTTP
2 5 (3.33%) SNMP
2 5 (3.33%) VPN
3 4 (2.67%) BGP
3 4 (2.67%) DHCP
3 4 (2.67%) OSPF
3 4 (2.67%) Skype
3 4 (2.67%) Software-Defined Radio
3 4 (2.67%) Unified Communications
3 4 (2.67%) VLAN
4 3 (2.00%) IPsec
4 3 (2.00%) TCP/IP
5 2 (1.33%) Ethernet VPN
5 2 (1.33%) LAN
5 2 (1.33%) Multicast
5 2 (1.33%) Reverse Proxy
5 2 (1.33%) VXLAN
5 2 (1.33%) WAN
Database & Business Intelligence
1 17 (11.33%) SQL Server
2 8 (5.33%) Elasticsearch
3 7 (4.67%) DB2
3 7 (4.67%) Relational Database
4 6 (4.00%) Big Data
5 5 (3.33%) PostgreSQL
5 5 (3.33%) RDBMS
6 4 (2.67%) DynamoDB
6 4 (2.67%) MySQL
7 3 (2.00%) Amazon RDS
7 3 (2.00%) ClickHouse
7 3 (2.00%) MariaDB
7 3 (2.00%) MongoDB
7 3 (2.00%) NoSQL
8 2 (1.33%) Power BI
8 2 (1.33%) SQL Server Reporting Services
9 1 (0.67%) Aerospike
9 1 (0.67%) Data Warehouse
9 1 (0.67%) KDB
9 1 (0.67%) SQL Server Integration Services
Development Applications
1 77 (51.33%) Git
2 69 (46.00%) JIRA
3 56 (37.33%) Jenkins
4 38 (25.33%) GitLab
5 18 (12.00%) TeamCity
6 16 (10.67%) Maven
7 15 (10.00%) SonarQube
8 14 (9.33%) JUnit
8 14 (9.33%) Selenium
9 13 (8.67%) GoogleTest
9 13 (8.67%) Sonatype Nexus
10 11 (7.33%) Eclipse
11 10 (6.67%) Cucumber
11 10 (6.67%) Robot Framework
12 9 (6.00%) Artifactory
13 8 (5.33%) Atlassian Bamboo
13 8 (5.33%) Mockito
14 5 (3.33%) Postman
15 4 (2.67%) IntelliJ
15 4 (2.67%) Rational DOORS
General
1 33 (22.00%) Finance
2 32 (21.33%) Social Skills
3 30 (20.00%) Banking
4 18 (12.00%) Analytical Skills
5 14 (9.33%) Front Office
5 14 (9.33%) Investment Banking
6 9 (6.00%) Organisational Skills
7 6 (4.00%) Public Sector
8 3 (2.00%) Back Office
8 3 (2.00%) Law
8 3 (2.00%) Legal
8 3 (2.00%) Marketing
8 3 (2.00%) Retail
9 2 (1.33%) Inclusion and Diversity
10 1 (0.67%) Documentation Skills
10 1 (0.67%) Financial Institution
10 1 (0.67%) Health Technology
Job Titles
1 46 (30.67%) Developer
2 17 (11.33%) Software Engineer
3 15 (10.00%) Java Developer
3 15 (10.00%) Senior
4 12 (8.00%) DevOps Engineer
5 9 (6.00%) Embedded Engineer
5 9 (6.00%) Embedded Software Engineer
5 9 (6.00%) Scrum Master
6 8 (5.33%) Architect
6 8 (5.33%) Full-Stack Developer
6 8 (5.33%) Infrastructure Engineer
7 7 (4.67%) Solutions Architect
7 7 (4.67%) Test Engineer
8 6 (4.00%) Automation Engineer
8 6 (4.00%) Senior Developer
9 5 (3.33%) AWS Developer
9 5 (3.33%) AWS Engineer
9 5 (3.33%) Linux Engineer
9 5 (3.33%) SC Cleared Software Engineer
9 5 (3.33%) Splunk Engineer
Libraries, Frameworks & Software Standards
1 38 (25.33%) REST
2 32 (21.33%) HTML
3 31 (20.67%) CSS
4 23 (15.33%) Node.js
4 23 (15.33%) React
4 23 (15.33%) Spring Boot
5 21 (14.00%) SOAP
6 20 (13.33%) .NET
7 17 (11.33%) Spring
8 13 (8.67%) HTML5
8 13 (8.67%) Jest
8 13 (8.67%) Kafka
9 12 (8.00%) ASP.NET
10 10 (6.67%) JPA
10 10 (6.67%) RAML
11 9 (6.00%) ASP.NET Web API
11 9 (6.00%) Hibernate
11 9 (6.00%) Redux
12 8 (5.33%) Sass
12 8 (5.33%) Web Services
Miscellaneous
1 15 (10.00%) Private Cloud
2 10 (6.67%) Product Ownership
3 9 (6.00%) Foreign Exchange (FX)
4 8 (5.33%) Mobile App
4 8 (5.33%) Public Cloud
5 6 (4.00%) Algorithms
5 6 (4.00%) Data Structures
6 4 (2.67%) PKI
6 4 (2.67%) Virtual Team
7 3 (2.00%) Data Centre
7 3 (2.00%) Distributed Systems
7 3 (2.00%) Vector Graphics
8 2 (1.33%) Fixed Income
8 2 (1.33%) GNSS
8 2 (1.33%) Mobile Banking
8 2 (1.33%) Online Banking
8 2 (1.33%) Video\Live Streaming
9 1 (0.67%) Data Protection Act
9 1 (0.67%) Enterprise Software
9 1 (0.67%) Equities
Operating Systems
1 49 (32.67%) Linux
2 28 (18.67%) Windows
3 18 (12.00%) Windows Server
4 8 (5.33%) Red Hat Enterprise Linux
4 8 (5.33%) Unix
5 5 (3.33%) CentOS
6 4 (2.67%) Android
7 3 (2.00%) Embedded Linux
7 3 (2.00%) Windows 10
7 3 (2.00%) Windows Server 2016
8 2 (1.33%) Debian
8 2 (1.33%) Ubuntu
8 2 (1.33%) VMS
9 1 (0.67%) Apple iOS
Processes & Methodologies
1 85 (56.67%) Agile
2 69 (46.00%) DevOps
3 58 (38.67%) CI/CD
4 44 (29.33%) Scrum
5 37 (24.67%) Microservices
6 34 (22.67%) Software Engineering
7 29 (19.33%) Test Automation
8 28 (18.67%) Problem-Solving
9 24 (16.00%) Configuration Management
10 19 (12.67%) Deployment Automation
10 19 (12.67%) SDLC
11 18 (12.00%) Full-Stack Development
12 17 (11.33%) Validation
13 16 (10.67%) API Development
13 16 (10.67%) Infrastructure Automation
13 16 (10.67%) System Testing
13 16 (10.67%) TDD
14 15 (10.00%) Computer Science
14 15 (10.00%) Migration
14 15 (10.00%) OO
Programming Languages
1 51 (34.00%) JavaScript
2 48 (32.00%) Java
3 44 (29.33%) Python
4 35 (23.33%) SQL
5 25 (16.67%) C#
6 24 (16.00%) C++
7 22 (14.67%) PowerShell
8 15 (10.00%) Bash
9 14 (9.33%) TypeScript
10 5 (3.33%) Kotlin
10 5 (3.33%) Perl
11 4 (2.67%) PL/SQL
12 3 (2.00%) PHP
12 3 (2.00%) Shell Script
13 2 (1.33%) Apex Code
13 2 (1.33%) Haskell
13 2 (1.33%) RPG
13 2 (1.33%) VB.NET
14 1 (0.67%) Go
14 1 (0.67%) Swift
Qualifications
1 43 (28.67%) Security Cleared
2 34 (22.67%) SC Cleared
3 20 (13.33%) Degree
4 12 (8.00%) OCA
4 12 (8.00%) Oracle Certification
5 11 (7.33%) CCNP
5 11 (7.33%) Cisco Certification
5 11 (7.33%) DV Cleared
5 11 (7.33%) VMware Certified Professional (VCP)
6 10 (6.67%) Computer Science Degree
6 10 (6.67%) RHCA
6 10 (6.67%) RHCE
7 6 (4.00%) Master's Degree
8 5 (3.33%) AWS Certification
9 3 (2.00%) AWS Certified Developer
10 2 (1.33%) AWS Certified Solutions Architect
10 2 (1.33%) JNCIA
11 1 (0.67%) CTC Cleared
11 1 (0.67%) Microsoft Certification
11 1 (0.67%) OCP
Quality Assurance & Compliance
1 11 (7.33%) QA
2 2 (1.33%) ITGC
3 1 (0.67%) Accessibility
3 1 (0.67%) PCI DSS
System Software
1 26 (17.33%) Docker
2 18 (12.00%) VMware Infrastructure
3 10 (6.67%) Active Directory
4 4 (2.67%) Firmware
5 3 (2.00%) Hyper-V
5 3 (2.00%) Lustre
5 3 (2.00%) Microsoft Virtual Server
5 3 (2.00%) vCloud
5 3 (2.00%) Virtual Servers
5 3 (2.00%) VMware Workstation
5 3 (2.00%) vSphere
6 2 (1.33%) VirtualBox
6 2 (1.33%) VMware NSX
Systems Management
1 25 (16.67%) Ansible
2 22 (14.67%) Kubernetes
3 21 (14.00%) Terraform
4 19 (12.67%) Puppet
5 15 (10.00%) Progress Chef
6 11 (7.33%) vCenter Server
7 6 (4.00%) Grafana
8 5 (3.33%) Kibana
9 3 (2.00%) Karpenter
9 3 (2.00%) Podman
9 3 (2.00%) Prometheus
9 3 (2.00%) WSUS
10 2 (1.33%) CloudHub
10 2 (1.33%) HAProxy
10 2 (1.33%) Icinga
10 2 (1.33%) Nagios
10 2 (1.33%) Salt
10 2 (1.33%) Single Sign-On
11 1 (0.67%) Docker Swarm
11 1 (0.67%) PowerCLI
Vendors
1 34 (22.67%) Atlassian
2 23 (15.33%) Oracle
3 20 (13.33%) Google
4 18 (12.00%) VMware
5 13 (8.67%) Cisco
6 12 (8.00%) Splunk
7 11 (7.33%) Microsoft
8 9 (6.00%) Veracode
9 6 (4.00%) Intel
10 5 (3.33%) IBM
10 5 (3.33%) Red Hat
11 4 (2.67%) Dynatrace
11 4 (2.67%) Salesforce
11 4 (2.67%) Veeam
12 3 (2.00%) MuleSoft
12 3 (2.00%) Palo Alto
13 2 (1.33%) AppDynamics
13 2 (1.33%) F5
13 2 (1.33%) Nintex
13 2 (1.33%) Rackspace