PL/SQL Contracts in England

PL/SQL (PLSQL)
UK > England

The table below provides summary statistics for contract job vacancies advertised in England requiring PL/SQL skills. It includes a benchmarking guide to the contractor rates offered in vacancies that cited PL/SQL over the 6 months leading up to 1 May 2025, comparing them to the same period in the previous two years.

6 months to
1 May 2025
Same period 2024 Same period 2023
Rank 220 267 222
Rank change year-on-year +47 -45 +57
Contract jobs citing PL/SQL 297 312 604
As % of all contract jobs advertised in England 1.22% 0.84% 1.20%
As % of the Programming Languages category 3.61% 2.86% 3.39%
Number of daily rates quoted 226 238 431
10th Percentile £385 £381 -
25th Percentile £406 £413 £400
Median daily rate (50th Percentile) £500 £525 £525
Median % change year-on-year -4.76% - +0.96%
75th Percentile £588 £650 £600
90th Percentile £688 £700 £713
UK median daily rate £495 £530 £513
% change year-on-year -6.60% +3.41% +2.50%
Number of hourly rates quoted 2 0 10
10th Percentile - - £53.75
25th Percentile £91.25 - £55.31
Median hourly rate £92.50 - £62.50
75th Percentile £93.75 - £85.00
90th Percentile - - £87.53
UK median hourly rate £92.50 - £72.50
% change year-on-year - - +11.54%

All Programming Languages
England

PL/SQL falls under the Programming Languages category. For comparison with the information above, the following table provides summary statistics for all contract job vacancies requiring coding skills in England.

Contract vacancies with a requirement for coding skills 8,221 10,920 17,806
As % of all contract IT jobs advertised in England 33.76% 29.36% 35.29%
Number of daily rates quoted 5,687 7,931 13,003
10th Percentile £363 £350 £388
25th Percentile £425 £425 £463
Median daily rate (50th Percentile) £525 £540 £565
Median % change year-on-year -2.78% -4.42% +2.73%
75th Percentile £650 £652 £688
90th Percentile £788 £775 £798
UK median daily rate £525 £525 £550
% change year-on-year - -4.55% -
Number of hourly rates quoted 214 441 430
10th Percentile £25.25 £35.52 £26.24
25th Percentile £37.65 £48.00 £50.00
Median hourly rate £62.75 £62.50 £61.84
Median % change year-on-year +0.40% +1.07% +23.68%
75th Percentile £68.00 £70.00 £70.00
90th Percentile £85.00 £80.00 £77.00
UK median hourly rate £62.50 £60.50 £60.70
% change year-on-year +3.31% -0.33% +21.40%

PL/SQL
Job Vacancy Trend in England

Job postings citing PL/SQL as a proportion of all IT jobs advertised in England.
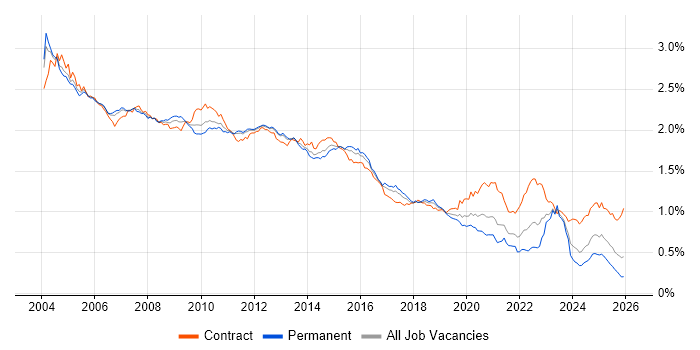
Job vacancy trend for PL/SQL in England

PL/SQL
Contractor Daily Rate Trend in England

3-month moving average daily rate quoted in jobs citing PL/SQL in England.

Daily rate trend for PL/SQL in England

PL/SQL
Daily Rate Histogram in England

Daily rate distribution for jobs citing PL/SQL in England over the 6 months to 1 May 2025.

Daily rate histogram for PL/SQL in England

PL/SQL
Contractor Hourly Rate Trend in England

3-month moving average hourly rates quoted in jobs citing PL/SQL in England.

Hourly rate trend for PL/SQL in England

PL/SQL
Contract Job Locations in England

The table below looks at the demand and provides a guide to the median contractor rates quoted in IT jobs citing PL/SQL within the England region over the 6 months to 1 May 2025. The 'Rank Change' column provides an indication of the change in demand within each location based on the same 6 month period last year.

Location Rank Change
on Same Period
Last Year
Matching
Contract
IT Job Ads
Median
Daily Rate
Past 6 Months
Median Daily Rate
% Change
on Same Period
Last Year
Live
Jobs
London +45 163 £475 -5.19% 78
South East +49 53 £500 +3.63% 54
North of England +53 48 £550 -4.60% 34
Yorkshire +31 26 £538 - 11
North West +28 22 £610 +5.81% 20
Midlands -27 12 £460 -14.02% 32
South West +37 10 £463 -27.45% 20
West Midlands -35 8 £460 -14.02% 19
East of England +34 7 £538 +23.56% 15
East Midlands +10 4 £425 +9.68% 10
PL/SQL
UK

PL/SQL
Co-occurring Skills and Capabilities in England by Category

The follow tables expand on the table above by listing co-occurrences grouped by category. The same employment type, locality and period is covered with up to 20 co-occurrences shown in each of the following categories:

Application Platforms
1 25 (8.42%) Confluence
2 21 (7.07%) Oracle SOA Suite
3 13 (4.38%) IIS
4 9 (3.03%) WebLogic
5 7 (2.36%) Oracle Workflow
6 6 (2.02%) BizTalk Server
6 6 (2.02%) Tomcat
7 5 (1.68%) JBoss
8 3 (1.01%) Oracle Service Bus
9 2 (0.67%) Tuxedo
9 2 (0.67%) WebSphere
9 2 (0.67%) WebSphere Application Server
10 1 (0.34%) Apache
10 1 (0.34%) Apache Spark
10 1 (0.34%) Oracle Application Server
10 1 (0.34%) Oracle Self-Service HR
10 1 (0.34%) SharePoint
Applications
1 29 (9.76%) Microsoft Excel
2 17 (5.72%) Microsoft Office
3 6 (2.02%) Oracle Smart View
4 2 (0.67%) Microsoft Project
4 2 (0.67%) MS Visio
Business Applications
1 31 (10.44%) Oracle EBS
2 15 (5.05%) Oracle Payables
3 13 (4.38%) Oracle EBS R12
3 13 (4.38%) Oracle Receivables
4 12 (4.04%) Oracle General Ledger
5 11 (3.70%) Oracle Assets
5 11 (3.70%) Oracle Cash Management
6 7 (2.36%) FLEXCUBE
7 6 (2.02%) Oracle Applications
7 6 (2.02%) Oracle BPM
7 6 (2.02%) Oracle ERP
7 6 (2.02%) Oracle Financials
8 4 (1.35%) Cognos Business Intelligence
8 4 (1.35%) Endur
9 2 (0.67%) Oracle 11i
9 2 (0.67%) Oracle Procure-to-Pay
9 2 (0.67%) SAP ERP
10 1 (0.34%) NEC Housing
10 1 (0.34%) Remedy ITSM
10 1 (0.34%) Temenos T24
Cloud Services
1 53 (17.85%) AWS
2 26 (8.75%) Azure
3 20 (6.73%) OCI
4 13 (4.38%) Power Platform
5 8 (2.69%) AWS Lambda
5 8 (2.69%) SaaS
5 8 (2.69%) Serverless
6 6 (2.02%) Azure Cosmos DB
6 6 (2.02%) Azure Logic Apps
6 6 (2.02%) Cloud Computing
7 5 (1.68%) Azure Functions
7 5 (1.68%) Azure Storage
7 5 (1.68%) GitHub
7 5 (1.68%) Snowflake
8 4 (1.35%) Azure DevOps
9 3 (1.01%) Amazon S3
9 3 (1.01%) Azure API Management
9 3 (1.01%) GCP
10 2 (0.67%) Azure Data Factory
10 2 (0.67%) Entra ID
Communications & Networking
1 18 (6.06%) DNS
2 11 (3.70%) Internet
3 3 (1.01%) HTTP
4 1 (0.34%) Kerberos
4 1 (0.34%) SSL
Database & Business Intelligence
1 96 (32.32%) Oracle Database
2 40 (13.47%) Oracle Reports
3 32 (10.77%) SQL Server
4 28 (9.43%) PostgreSQL
5 26 (8.75%) Oracle BI Publisher
6 20 (6.73%) Data Warehouse
7 18 (6.06%) Oracle Database 11g
8 14 (4.71%) Amazon RDS
8 14 (4.71%) Relational Database
9 13 (4.38%) Power BI
10 10 (3.37%) MongoDB
11 9 (3.03%) Oracle ODI
12 8 (2.69%) SQL Server Reporting Services
13 7 (2.36%) Tableau
14 6 (2.02%) Azure SQL Database
14 6 (2.02%) GIS
14 6 (2.02%) Oracle Database 10g
14 6 (2.02%) Qlik Sense
15 5 (1.68%) Crystal Reports
15 5 (1.68%) Siebel EIM
Development Applications
1 34 (11.45%) JIRA
2 18 (6.06%) Visual Studio
3 17 (5.72%) Oracle Forms
4 11 (3.70%) Oracle APEX
5 10 (3.37%) Git
5 10 (3.37%) Jenkins
5 10 (3.37%) Subversion
6 7 (2.36%) Toad
7 5 (1.68%) Bitbucket
7 5 (1.68%) GitLab
8 4 (1.35%) Atlassian Bamboo
8 4 (1.35%) JUnit
8 4 (1.35%) SQL Server Management Studio (SSMS)
8 4 (1.35%) VSS/SourceSafe
9 3 (1.01%) Ant
9 3 (1.01%) Selenium
9 3 (1.01%) SonarQube
10 2 (0.67%) Maven
10 2 (0.67%) SoapUI
10 2 (0.67%) Team Foundation Server
General
1 128 (43.10%) Finance
2 101 (34.01%) Social Skills
3 43 (14.48%) Analytical Skills
4 37 (12.46%) Banking
5 17 (5.72%) Public Sector
6 11 (3.70%) Manufacturing
7 9 (3.03%) Documentation Skills
7 9 (3.03%) Military
8 8 (2.69%) General Ledger
9 6 (2.02%) Financial Institution
10 5 (1.68%) Billing
10 5 (1.68%) Front Office
10 5 (1.68%) Retail
11 4 (1.35%) Back Office
11 4 (1.35%) Organisational Skills
11 4 (1.35%) Telecoms
12 2 (0.67%) Automotive
13 1 (0.34%) Advertising
13 1 (0.34%) Corporate Banking
13 1 (0.34%) French Language
Job Titles
1 145 (48.82%) Developer
2 42 (14.14%) Oracle Developer
3 39 (13.13%) C# Developer
4 36 (12.12%) .NET Developer
5 29 (9.76%) C# WPF Developer
5 29 (9.76%) WPF Developer
6 26 (8.75%) C# .NET Developer
7 22 (7.41%) Consultant
7 22 (7.41%) Data Engineer
8 17 (5.72%) Analyst
9 16 (5.39%) Delphi Developer
10 15 (5.05%) Cloud Developer
11 13 (4.38%) Architect
11 13 (4.38%) Senior
11 13 (4.38%) Software Engineer
12 12 (4.04%) Migration Engineer
13 11 (3.70%) C# WCF Developer
13 11 (3.70%) SQL Developer
13 11 (3.70%) WCF Developer
14 10 (3.37%) PL/SQL Developer
Libraries, Frameworks & Software Standards
1 55 (18.52%) .NET
2 45 (15.15%) .NET Framework
3 29 (9.76%) WPF
4 26 (8.75%) XML
5 24 (8.08%) Oracle Fusion
6 22 (7.41%) SOAP
7 17 (5.72%) Web Services
8 13 (4.38%) Middleware
9 12 (4.04%) Entity Framework
10 11 (3.70%) Kafka
10 11 (3.70%) WCF
10 11 (3.70%) WinForms
11 9 (3.03%) XSLT
12 7 (2.36%) .NET Core
12 7 (2.36%) HTML
12 7 (2.36%) REST
12 7 (2.36%) Spring Boot
13 6 (2.02%) AngularJS
13 6 (2.02%) Blazor
14 5 (1.68%) RESTful
Miscellaneous
1 18 (6.06%) Legacy Systems
2 16 (5.39%) Linux Command Line
3 13 (4.38%) SCADA
4 10 (3.37%) Product Ownership
5 9 (3.03%) Operational Technology
6 6 (2.02%) Cloud Native
7 5 (1.68%) Replication
8 4 (1.35%) TWAP
8 4 (1.35%) VWAP
9 3 (1.01%) Algorithms
9 3 (1.01%) Clustering
9 3 (1.01%) Data Protection Act
9 3 (1.01%) Onboarding
9 3 (1.01%) Self-Motivation
9 3 (1.01%) Team-Oriented Environment
10 2 (0.67%) Data Structures
10 2 (0.67%) Distributed Systems
10 2 (0.67%) Enterprise Software
10 2 (0.67%) Foreign Exchange (FX)
10 2 (0.67%) SWIFT Messaging Network
Operating Systems
1 97 (32.66%) Windows
2 55 (18.52%) Linux
3 27 (9.09%) Unix
4 22 (7.41%) Windows Server
5 5 (1.68%) Solaris
6 3 (1.01%) AIX
7 1 (0.34%) Red Hat Enterprise Linux
7 1 (0.34%) Ubuntu
Processes & Methodologies
1 91 (30.64%) Problem-Solving
2 69 (23.23%) Migration
3 65 (21.89%) Agile
4 42 (14.14%) Data Migration
4 42 (14.14%) Data Modelling
5 40 (13.47%) Business Intelligence
6 38 (12.79%) Microservices
7 34 (11.45%) DevOps
7 34 (11.45%) Performance Tuning
8 31 (10.44%) User Acceptance Testing
9 28 (9.43%) Analytics
10 26 (8.75%) ERP
10 26 (8.75%) Validation
11 24 (8.08%) ETL
12 23 (7.74%) CI/CD
13 22 (7.41%) Root Cause Analysis
14 21 (7.07%) Data Analysis
14 21 (7.07%) Functional Testing
14 21 (7.07%) SOA
15 20 (6.73%) Computer Science
Programming Languages
1 295 (99.33%) SQL
2 72 (24.24%) C#
3 39 (13.13%) Java
4 34 (11.45%) Perl
5 29 (9.76%) VBA
6 28 (9.43%) VB
7 27 (9.09%) T-SQL
8 21 (7.07%) Python
9 19 (6.40%) Bash
10 17 (5.72%) VB.NET
11 16 (5.39%) Delphi
11 16 (5.39%) JavaScript
12 15 (5.05%) PowerShell
13 13 (4.38%) Shell Script
14 11 (3.70%) RPG
14 11 (3.70%) RPG IV
15 6 (2.02%) C++
15 6 (2.02%) Go
16 4 (1.35%) COBOL
17 3 (1.01%) Korn
Qualifications
1 83 (27.95%) Security Cleared
2 78 (26.26%) SC Cleared
3 25 (8.42%) Degree
4 18 (6.06%) Cisco Certification
5 7 (2.36%) BPSS Clearance
5 7 (2.36%) Computer Science Degree
6 2 (0.67%) Azure Certification
6 2 (0.67%) PRINCE2 Certification
7 1 (0.34%) AWS Certification
7 1 (0.34%) ISEB
7 1 (0.34%) Master's Degree
7 1 (0.34%) Oracle Certification
7 1 (0.34%) Siebel Certification
Quality Assurance & Compliance
1 15 (5.05%) QA
2 13 (4.38%) Data Quality
3 9 (3.03%) GDPR
4 3 (1.01%) Sarbanes-Oxley
5 2 (0.67%) SEPA
6 1 (0.34%) ISO/IEC 27001
6 1 (0.34%) PCI DSS
System Software
1 22 (7.41%) Active Directory
2 15 (5.05%) Docker
3 5 (1.68%) Oracle RAC
4 1 (0.34%) VMware ESXi
4 1 (0.34%) VMware Infrastructure
Systems Management
1 23 (7.74%) Kubernetes
2 5 (1.68%) Ansible
3 4 (1.35%) Oracle RMAN
4 3 (1.01%) Data Guard
4 3 (1.01%) Oracle Enterprise Manager
4 3 (1.01%) Terraform
5 1 (0.34%) Control-M
5 1 (0.34%) EMC NetWorker
5 1 (0.34%) Enterprise Manager Cloud Control
5 1 (0.34%) QRadar
5 1 (0.34%) Tivoli
5 1 (0.34%) Tivoli Storage Manager
Vendors
1 237 (79.80%) Oracle
2 29 (9.76%) Microsoft
3 18 (6.06%) Cisco
4 11 (3.70%) Citrix
4 11 (3.70%) IBM
5 10 (3.37%) MuleSoft
6 9 (3.03%) IFS
7 8 (2.69%) Informatica
8 6 (2.02%) Avaloq
8 6 (2.02%) Siebel
9 5 (1.68%) Perforce
10 4 (1.35%) Atlassian
10 4 (1.35%) CODA
10 4 (1.35%) Cognos
10 4 (1.35%) OpenLink
10 4 (1.35%) Solace
10 4 (1.35%) TIBCO
11 3 (1.01%) SAP
12 2 (0.67%) Red Hat
12 2 (0.67%) Sybase