SAP S/4HANA
England > London
The table below provides summary statistics and salary benchmarking for jobs advertised in London requiring SAP S/4HANA skills. It covers permanent job vacancies from the 6 months leading up to 17 February 2026, with comparisons to the same periods in the previous two years.
| 6 months to 17 Feb 2026 |
Same period 2025 | Same period 2024 | |
|---|---|---|---|
| Rank | 262 | 270 | 339 |
| Rank change year-on-year | +8 | +69 | +96 |
| Permanent jobs citing SAP S/4HANA | 132 | 152 | 139 |
| As % of all permanent jobs in London | 0.85% | 1.02% | 0.65% |
| As % of the Business Applications category | 17.32% | 14.71% | 12.07% |
| Number of salaries quoted | 61 | 88 | 66 |
| 10th Percentile | £62,500 | £62,500 | £62,500 |
| 25th Percentile | £75,000 | £80,000 | £72,125 |
| Median annual salary (50th Percentile) | £80,000 | £90,000 | £90,000 |
| Median % change year-on-year | -11.11% | - | +12.50% |
| 75th Percentile | £93,750 | £105,000 | £100,000 |
| 90th Percentile | £115,000 | £110,750 | £115,000 |
| England median annual salary | £80,000 | £90,000 | £74,000 |
| % change year-on-year | -11.11% | +21.62% | - |
All Business Application Skills
London
SAP S/4HANA falls under the Business Applications category. For comparison with the information above, the following table provides summary statistics for all permanent job vacancies requiring business application skills in London.
| Permanent vacancies with a requirement for business application skills | 762 | 1,033 | 1,152 |
| As % of all permanent jobs advertised in London | 4.90% | 6.95% | 5.42% |
| Number of salaries quoted | 464 | 547 | 875 |
| 10th Percentile | £32,650 | £45,000 | £40,000 |
| 25th Percentile | £46,250 | £52,500 | £52,500 |
| Median annual salary (50th Percentile) | £72,500 | £75,000 | £70,000 |
| Median % change year-on-year | -3.33% | +7.14% | -3.45% |
| 75th Percentile | £85,000 | £96,250 | £90,000 |
| 90th Percentile | £109,625 | £112,500 | £104,500 |
| England median annual salary | £55,000 | £60,000 | £56,000 |
| % change year-on-year | -8.33% | +7.14% | -10.40% |
SAP S/4HANA
Job Vacancy Trend in London
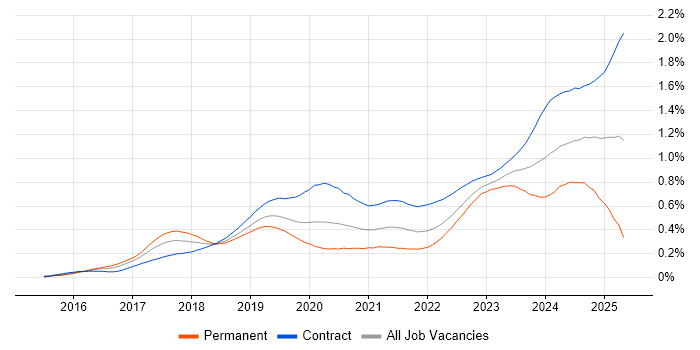
Historical trend showing the proportion of permanent IT job postings citing SAP S/4HANA relative to all permanent IT jobs advertised in London.

SAP S/4HANA
Salary Trend in London
Salary distribution trend for jobs in London citing SAP S/4HANA.

SAP S/4HANA
Salary Histogram in London
Salary distribution for jobs citing SAP S/4HANA in London over the 6 months to 17 February 2026.
SAP S/4HANA
Job Locations in London
The table below looks at the demand and provides a guide to the median salaries quoted in IT jobs citing SAP S/4HANA within the London region over the 6 months to 17 February 2026. The 'Rank Change' column provides an indication of the change in demand within each location based on the same 6 month period last year.
| Location | Rank Change on Same Period Last Year |
Matching Permanent IT Job Ads |
Median Salary Past 6 Months |
Median Salary % Change on Same Period Last Year |
Live Jobs |
|---|---|---|---|---|---|
| Central London | +23 | 13 | £77,500 | -3.13% | 15 |
| West London | -5 | 5 | £92,500 | +48.00% | 3 |
| East London | -4 | 2 | £80,000 | -5.88% | |
| North London | - | 1 | £125,000 | - | |
| SAP S/4HANA England |
|||||
SAP S/4HANA
Co-Occurring Skills & Capabilities in London by Category
The following tables expand on the one above by listing co-occurrences grouped by category. They cover the same employment type, locality and period, with up to 20 co-occurrences shown in each category:
|
|
||||||||||||||||||||||||||||||||||||||||||||||||||||||||||||||||||||||||||||||||||||||||||||||||||||||||||||||||||||||||||||||
|
|
||||||||||||||||||||||||||||||||||||||||||||||||||||||||||||||||||||||||||||||||||||||||||||||||||||||||||||||||||||||||||||||
|
|
||||||||||||||||||||||||||||||||||||||||||||||||||||||||||||||||||||||||||||||||||||||||||||||||||||||||||||||||||||||||||||||
|
|
||||||||||||||||||||||||||||||||||||||||||||||||||||||||||||||||||||||||||||||||||||||||||||||||||||||||||||||||||||||||||||||
|
|
||||||||||||||||||||||||||||||||||||||||||||||||||||||||||||||||||||||||||||||||||||||||||||||||||||||||||||||||||||||||||||||
|
|
||||||||||||||||||||||||||||||||||||||||||||||||||||||||||||||||||||||||||||||||||||||||||||||||||||||||||||||||||||||||||||||
|
|
||||||||||||||||||||||||||||||||||||||||||||||||||||||||||||||||||||||||||||||||||||||||||||||||||||||||||||||||||||||||||||||
|
|
||||||||||||||||||||||||||||||||||||||||||||||||||||||||||||||||||||||||||||||||||||||||||||||||||||||||||||||||||||||||||||||
|
|||||||||||||||||||||||||||||||||||||||||||||||||||||||||||||||||||||||||||||||||||||||||||||||||||||||||||||||||||||||||||||||
