C# Contracts with Hybrid/Remote/WFH Options

C#
UK > Work from Home

The table below provides summary statistics for remote or hybrid contract work requiring C# skills. It includes a benchmarking guide to the contractor rates offered in vacancies that cited C# over the 6 months leading up to 19 June 2025, comparing them to the same period in the previous two years.

6 months to
19 Jun 2025
Same period 2024 Same period 2023
Rank 54 30 37
Rank change year-on-year -24 +7 -8
Contract jobs citing C# 407 881 1,291
As % of all contract jobs with a WFH option 4.16% 5.96% 5.42%
As % of the Programming Languages category 11.04% 17.18% 14.97%
Number of daily rates quoted 307 593 983
10th Percentile £325 £363 £373
25th Percentile £410 £456 £425
Median daily rate (50th Percentile) £525 £560 £550
Median % change year-on-year -6.25% +1.82% +4.76%
75th Percentile £750 £675 £688
90th Percentile £850 £773 £800
UK median daily rate £501 £563 £575
% change year-on-year -10.93% -2.17% +4.55%
Number of hourly rates quoted 10 12 34
10th Percentile £58.57 £20.77 £41.50
25th Percentile £62.19 £32.19 £52.19
Median hourly rate £65.00 £62.50 £65.00
Median % change year-on-year +4.00% -3.85% +39.28%
75th Percentile - £65.00 £65.56
90th Percentile - - £65.75
UK median hourly rate £62.50 £65.00 £65.00
% change year-on-year -3.85% - +13.04%

All Programming Languages
Work from Home

C# falls under the Programming Languages category. For comparison with the information above, the following table provides summary statistics for all contract job vacancies with remote or hybrid options requiring coding skills.

Contract vacancies with a requirement for coding skills 3,685 5,127 8,623
As % of all contract jobs with a WFH option 37.68% 34.70% 36.23%
Number of daily rates quoted 2,610 3,673 6,372
10th Percentile £350 £356 £381
25th Percentile £413 £430 £450
Median daily rate (50th Percentile) £511 £525 £550
Median % change year-on-year -2.67% -4.55% +1.85%
75th Percentile £638 £650 £673
90th Percentile £800 £800 £781
UK median daily rate £510 £525 £550
% change year-on-year -2.86% -4.55% -
Number of hourly rates quoted 57 136 190
10th Percentile £27.44 £31.88 £25.98
25th Percentile £45.75 £44.88 £49.76
Median hourly rate £65.00 £55.00 £62.50
Median % change year-on-year +18.18% -12.00% +25.00%
75th Percentile £68.00 £72.50 £70.00
90th Percentile £88.50 £85.00 £85.00
UK median hourly rate £55.00 £62.50 £62.50
% change year-on-year -12.00% - +20.19%

C#
Trend for Jobs with a WFH Option

Job vacancies with remote working options citing C# as a proportion of all IT jobs advertised.
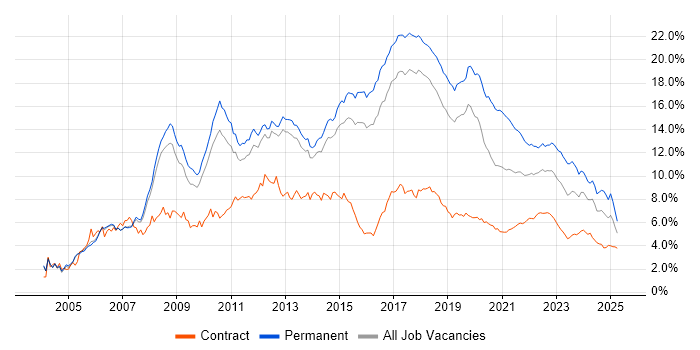
C# trend for jobs with Hybrid/Remote/WFH options

C#
Daily Rate Trend for Jobs with a WFH Option

3-month moving average daily rate quoted in job vacancies with remote working options citing C#.

C# daily rate for jobs with a WFH option

C#
Daily Rate Histogram for Jobs with a WFH Option

Daily rate distribution for jobs with remote working options citing C# over the 6 months to 19 June 2025.

C# daily rate histogram for jobs with a WFH option

C#
Hourly Rate Trend for Jobs with a WFH Option

3-month moving average hourly rate quoted in job vacancies with remote working options citing C#.

C# hourly rate for jobs with a WFH option

C#
Hourly Rate Histogram for Jobs with a WFH Option

Hourly rate distribution for jobs with remote working options citing C# over the 6 months to 19 June 2025.

C# hourly rate histogram for jobs with a WFH option

C#
Co-occurring Skills and Capabilities with WFH Options by Category

The follow tables expand on the table above by listing co-occurrences grouped by category. The same employment type, locality and period is covered with up to 20 co-occurrences shown in each of the following categories:

Application Platforms
1 16 (3.93%) SharePoint
2 12 (2.95%) Confluence
3 7 (1.72%) Umbraco
4 4 (0.98%) Oracle Coherence
5 3 (0.74%) CMS
6 2 (0.49%) Anypoint
6 2 (0.49%) Apache Airflow
6 2 (0.49%) IIS
7 1 (0.25%) Apache Spark
7 1 (0.25%) Appian
7 1 (0.25%) BizTalk Server
7 1 (0.25%) Camunda
7 1 (0.25%) DataSynapse
7 1 (0.25%) Headless CMS
7 1 (0.25%) Microsoft Exchange
7 1 (0.25%) Oracle Workflow
7 1 (0.25%) Tomcat
Applications
1 10 (2.46%) Microsoft Excel
2 8 (1.97%) Microsoft Office
3 6 (1.47%) Chatbot
4 2 (0.49%) Trello
Business Applications
1 20 (4.91%) Dynamics CRM
2 2 (0.49%) Aladdin
2 2 (0.49%) Endur
2 2 (0.49%) Oracle EBS
3 1 (0.25%) Fidessa
3 1 (0.25%) OpenText MBPM
3 1 (0.25%) Oracle BPM
3 1 (0.25%) Payment Gateway
Cloud Services
1 196 (48.16%) Azure
2 97 (23.83%) Azure DevOps
3 49 (12.04%) AWS
4 41 (10.07%) Power Platform
5 36 (8.85%) Dynamics 365
6 29 (7.13%) Azure Service Bus
6 29 (7.13%) PowerApps
7 24 (5.90%) Serverless
8 23 (5.65%) GitHub
8 23 (5.65%) Power Automate
9 19 (4.67%) Azure Logic Apps
10 15 (3.69%) Azure Functions
10 15 (3.69%) Entra ID
10 15 (3.69%) GCP
11 13 (3.19%) Azure Data Factory
12 12 (2.95%) Azure Monitor
13 10 (2.46%) Azure Cosmos DB
14 9 (2.21%) Azure AKS
14 9 (2.21%) Azure API Management
14 9 (2.21%) SaaS
Communications & Networking
1 16 (3.93%) TCP/IP
2 9 (2.21%) Ethernet
3 6 (1.47%) DNS
3 6 (1.47%) HTTP
4 4 (0.98%) FTP
4 4 (0.98%) SMTP
4 4 (0.98%) SSL
5 3 (0.74%) Firewall
6 2 (0.49%) DHCP
7 1 (0.25%) Kerberos
7 1 (0.25%) NAS
7 1 (0.25%) Network Security
7 1 (0.25%) RS-232
7 1 (0.25%) SAN
7 1 (0.25%) VLAN
Database & Business Intelligence
1 71 (17.44%) SQL Server
2 22 (5.41%) Relational Database
3 19 (4.67%) Power BI
4 18 (4.42%) Azure SQL Database
5 16 (3.93%) NoSQL
6 11 (2.70%) SQL Server Reporting Services
7 10 (2.46%) MongoDB
8 8 (1.97%) PostgreSQL
9 7 (1.72%) SQL Server Integration Services
10 5 (1.23%) MySQL
10 5 (1.23%) Redis
11 4 (0.98%) Apache Cassandra
11 4 (0.98%) Big Data
12 3 (0.74%) Data Warehouse
12 3 (0.74%) Elasticsearch
13 2 (0.49%) Geospatial Data
13 2 (0.49%) GIS
13 2 (0.49%) Metadata
13 2 (0.49%) ObjectStore
14 1 (0.25%) Looker
Development Applications
1 57 (14.00%) JIRA
2 53 (13.02%) Git
3 39 (9.58%) Jenkins
4 31 (7.62%) Visual Studio
5 21 (5.16%) Selenium
6 13 (3.19%) JMeter
7 11 (2.70%) NUnit
8 10 (2.46%) Cypress.io
9 9 (2.21%) Appium
9 9 (2.21%) Eclipse
9 9 (2.21%) Postman
9 9 (2.21%) SpecFlow
10 8 (1.97%) GitLab
10 8 (1.97%) LoadRunner
11 7 (1.72%) Subversion
11 7 (1.72%) TeamCity
12 6 (1.47%) Gatling
12 6 (1.47%) Team Foundation Server
13 5 (1.23%) Artifactory
13 5 (1.23%) Serenity BDD
General
1 124 (30.47%) Social Skills
2 94 (23.10%) Finance
3 60 (14.74%) Analytical Skills
4 46 (11.30%) Banking
5 42 (10.32%) Public Sector
6 38 (9.34%) Front Office
7 21 (5.16%) Investment Banking
8 18 (4.42%) Manufacturing
9 14 (3.44%) Organisational Skills
10 10 (2.46%) Inclusion and Diversity
10 10 (2.46%) Marketing
10 10 (2.46%) Presentation Skills
11 9 (2.21%) Electronics
11 9 (2.21%) Military
12 8 (1.97%) Telecoms
13 5 (1.23%) Wholesale Banking
14 4 (0.98%) Documentation Skills
15 3 (0.74%) Legal
16 2 (0.49%) Financial Institution
16 2 (0.49%) Publishing
Job Titles
1 266 (65.36%) Developer
2 95 (23.34%) C# Developer
3 93 (22.85%) .NET Developer
4 56 (13.76%) Senior
5 45 (11.06%) C# .NET Developer
6 42 (10.32%) Senior Developer
7 34 (8.35%) Lead
8 33 (8.11%) Software Engineer
9 28 (6.88%) Azure Developer
10 24 (5.90%) Lead Developer
10 24 (5.90%) Senior .NET Developer
11 22 (5.41%) Senior C# Developer
12 20 (4.91%) C# Software Engineer
12 20 (4.91%) Python Developer
13 19 (4.67%) Software Developer
14 18 (4.42%) Lead .NET Developer
15 17 (4.18%) C# Developer - Electronic Trading
15 17 (4.18%) Electronic Trading Developer
15 17 (4.18%) Real Time Developer
16 16 (3.93%) Full-Stack Developer
Libraries, Frameworks & Software Standards
1 241 (59.21%) .NET
2 81 (19.90%) .NET Core
3 57 (14.00%) React
4 53 (13.02%) AngularJS
5 49 (12.04%) REST
6 41 (10.07%) .NET Framework
7 40 (9.83%) ASP.NET
7 40 (9.83%) Web Services
8 36 (8.85%) HTML
9 29 (7.13%) CSS
10 28 (6.88%) Kafka
11 26 (6.39%) RESTful
12 24 (5.90%) WCF
13 22 (5.41%) Reactive Extensions
14 21 (5.16%) SOAP
15 20 (4.91%) ASP.NET Web API
16 18 (4.42%) Node.js
17 16 (3.93%) FastAPI
18 15 (3.69%) Entity Framework
19 14 (3.44%) Playwright
Miscellaneous
1 28 (6.88%) Product Ownership
2 27 (6.63%) Foreign Exchange (FX)
3 22 (5.41%) Enterprise Software
4 15 (3.69%) Greenfield Project
4 15 (3.69%) Legacy Applications
5 13 (3.19%) Distributed Systems
5 13 (3.19%) Fixed Income
6 12 (2.95%) Cloud Native
7 11 (2.70%) Legacy Systems
8 8 (1.97%) Derivative
8 8 (1.97%) Mobile App
8 8 (1.97%) Onboarding
9 7 (1.72%) Equities
9 7 (1.72%) Self-Motivation
10 5 (1.23%) Equity Derivative
11 4 (0.98%) Data Structures
11 4 (0.98%) NHS
11 4 (0.98%) Private Cloud
11 4 (0.98%) Renewable Energy
11 4 (0.98%) Virtual Team
Operating Systems
1 51 (12.53%) Windows
2 22 (5.41%) Linux
3 12 (2.95%) Windows Server
4 8 (1.97%) Unix
5 7 (1.72%) Android
6 6 (1.47%) Apple iOS
7 4 (0.98%) Windows Server 2019
8 3 (0.74%) Windows 10
9 1 (0.25%) Mac OS
9 1 (0.25%) Oracle Linux
9 1 (0.25%) Red Hat Enterprise Linux
9 1 (0.25%) Solaris
9 1 (0.25%) Ubuntu
9 1 (0.25%) Windows Server 2016
Processes & Methodologies
1 196 (48.16%) Agile
2 164 (40.29%) DevOps
3 121 (29.73%) CI/CD
4 88 (21.62%) Problem-Solving
5 68 (16.71%) Software Engineering
6 66 (16.22%) Test Automation
7 52 (12.78%) Microservices
8 51 (12.53%) OO
9 50 (12.29%) Scrum
9 50 (12.29%) TDD
10 49 (12.04%) Continuous Improvement
11 44 (10.81%) Full-Stack Development
12 41 (10.07%) Containerisation
13 39 (9.58%) Design Patterns
14 30 (7.37%) Mentoring
14 30 (7.37%) SDLC
15 29 (7.13%) Code Quality
16 28 (6.88%) Continuous Delivery
17 26 (6.39%) Unit Testing
18 24 (5.90%) Continuous Integration
Programming Languages
1 161 (39.56%) SQL
2 132 (32.43%) JavaScript
3 99 (24.32%) Python
4 77 (18.92%) Java
5 55 (13.51%) TypeScript
6 50 (12.29%) PowerShell
7 48 (11.79%) C++
8 12 (2.95%) PL/SQL
9 8 (1.97%) Bicep
9 8 (1.97%) Delphi
9 8 (1.97%) VB
10 7 (1.72%) Ruby
11 5 (1.23%) F#
11 5 (1.23%) PHP
11 5 (1.23%) VBA
12 4 (0.98%) Scala
13 3 (0.74%) T-SQL
13 3 (0.74%) VBScript
14 2 (0.49%) Go
14 2 (0.49%) Kusto Query Language
Qualifications
1 58 (14.25%) Security Cleared
2 50 (12.29%) SC Cleared
3 24 (5.90%) Degree
4 8 (1.97%) Computer Science Degree
5 6 (1.47%) BPSS Clearance
6 4 (0.98%) Microsoft Certification
7 3 (0.74%) DV Cleared
7 3 (0.74%) ISTQB
7 3 (0.74%) Master's Degree
8 2 (0.49%) OCP
8 2 (0.49%) Oracle Certification
9 1 (0.25%) CTC Cleared
9 1 (0.25%) ISEB
9 1 (0.25%) ISTQB Foundation Certification
9 1 (0.25%) ITIL Foundation Certificate
9 1 (0.25%) MCAD
9 1 (0.25%) MCPD
9 1 (0.25%) MCSD
9 1 (0.25%) PhD
9 1 (0.25%) Sun Certification
Quality Assurance & Compliance
1 23 (5.65%) QA
2 18 (4.42%) Accessibility
3 5 (1.23%) Sarbanes-Oxley
4 4 (0.98%) ISO/IEC 27001
5 2 (0.49%) Data Quality
5 2 (0.49%) GDPR
5 2 (0.49%) HL7
6 1 (0.25%) EMIR
6 1 (0.25%) MiFID
6 1 (0.25%) PCI DSS
6 1 (0.25%) WCAG
System Software
1 48 (11.79%) Docker
2 12 (2.95%) Active Directory
3 2 (0.49%) Platform Symphony
4 1 (0.25%) Virtual Desktop
4 1 (0.25%) Virtual Machines
4 1 (0.25%) VMware ESXi
4 1 (0.25%) VMware Infrastructure
Systems Management
1 67 (16.46%) Kubernetes
2 36 (8.85%) Terraform
3 22 (5.41%) Ansible
4 6 (1.47%) Perfmon
5 5 (1.23%) Grafana
5 5 (1.23%) Kibana
6 4 (0.98%) MIIS
6 4 (0.98%) SCCM
7 3 (0.74%) ITRS Geneos
7 3 (0.74%) Progress Chef
7 3 (0.74%) Puppet
8 2 (0.49%) Active Directory Federation Services
9 1 (0.25%) EMC NetWorker
9 1 (0.25%) Microsoft Intune
9 1 (0.25%) Netcool
9 1 (0.25%) SCOM
9 1 (0.25%) Tivoli
9 1 (0.25%) Tivoli Storage Manager
9 1 (0.25%) WSUS
Vendors
1 94 (23.10%) Microsoft
2 59 (14.50%) Oracle
3 10 (2.46%) SAP
4 9 (2.21%) Google
5 8 (1.97%) Salesforce
6 7 (1.72%) Conga
6 7 (1.72%) ServiceNow
7 6 (1.47%) PayPal
7 6 (1.47%) UiPath
8 5 (1.23%) Bloomberg
8 5 (1.23%) Reuters
9 4 (0.98%) CyberArk
9 4 (0.98%) Dynatrace
9 4 (0.98%) IBM
9 4 (0.98%) New Relic
9 4 (0.98%) Red Hat
9 4 (0.98%) Solace
9 4 (0.98%) Splunk
10 3 (0.74%) BeyondTrust
10 3 (0.74%) MuleSoft