Linux Contracts with Hybrid/Remote/WFH Options

Linux
UK > Work from Home

The table below provides summary statistics for remote or hybrid contract work requiring Linux skills. It includes a benchmarking guide to the contractor rates offered in vacancies that cited Linux over the 6 months leading up to 2 May 2025, comparing them to the same period in the previous two years.

6 months to
2 May 2025
Same period 2024 Same period 2023
Rank 30 40 28
Rank change year-on-year +10 -12 +10
Contract jobs citing Linux 614 687 1,711
As % of all contract jobs with a WFH option 6.20% 4.48% 6.65%
As % of the Operating Systems category 51.90% 42.94% 48.39%
Number of daily rates quoted 368 437 1,188
10th Percentile £375 £325 £420
25th Percentile £425 £425 £475
Median daily rate (50th Percentile) £525 £533 £550
Median % change year-on-year -1.50% -3.09% -
75th Percentile £625 £619 £675
90th Percentile £709 £704 £750
UK median daily rate £550 £550 £575
% change year-on-year - -4.35% +0.88%
Number of hourly rates quoted 20 14 58
10th Percentile £40.50 £38.42 £47.50
25th Percentile £61.25 £55.00 £51.25
Median hourly rate £65.00 £62.75 £63.75
Median % change year-on-year +3.59% -1.57% +13.33%
75th Percentile £68.00 £71.88 £73.75
90th Percentile £68.08 £76.00 £75.30
UK median hourly rate £65.00 £60.50 £65.00
% change year-on-year +7.44% -6.92% +8.33%

All Operating Systems
Work from Home

Linux falls under the Operating Systems category. For comparison with the information above, the following table provides summary statistics for all contract job vacancies with remote or hybrid options requiring operating system skills.

Contract vacancies with a requirement for operating system skills 1,183 1,600 3,536
As % of all contract jobs with a WFH option 11.95% 10.45% 13.74%
Number of daily rates quoted 792 1,114 2,496
10th Percentile £290 £214 £250
25th Percentile £388 £350 £406
Median daily rate (50th Percentile) £500 £475 £520
Median % change year-on-year +5.26% -8.65% +4.00%
75th Percentile £581 £588 £625
90th Percentile £675 £679 £724
UK median daily rate £475 £468 £504
% change year-on-year +1.50% -7.14% +0.80%
Number of hourly rates quoted 34 48 102
10th Percentile £14.20 £13.10 £19.00
25th Percentile £32.19 £14.27 £39.70
Median hourly rate £62.50 £18.15 £55.00
Median % change year-on-year +244.35% -67.00% +29.41%
75th Percentile £68.00 £65.00 £69.88
90th Percentile £68.53 £74.00 £75.00
UK median hourly rate £24.00 £22.00 £39.00
% change year-on-year +9.09% -43.59% +73.33%

Linux
Trend for Jobs with a WFH Option

Job vacancies with remote working options citing Linux as a proportion of all IT jobs advertised.
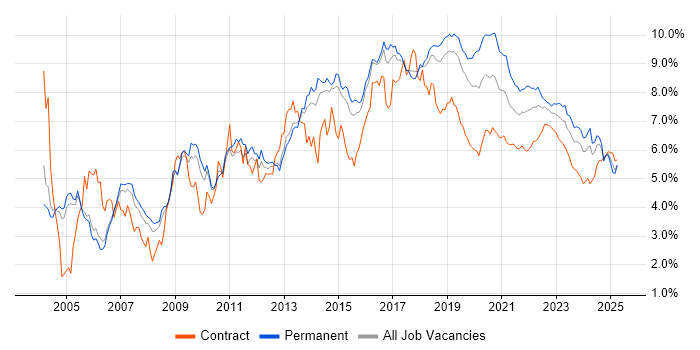
Linux trend for jobs with Hybrid/Remote/WFH options

Linux
Daily Rate Trend for Jobs with a WFH Option

3-month moving average daily rate quoted in job vacancies with remote working options citing Linux.

Linux daily rate for jobs with a WFH option

Linux
Daily Rate Histogram for Jobs with a WFH Option

Daily rate distribution for jobs with remote working options citing Linux over the 6 months to 2 May 2025.

Linux daily rate histogram for jobs with a WFH option

Linux
Hourly Rate Trend for Jobs with a WFH Option

3-month moving average hourly rate quoted in job vacancies with remote working options citing Linux.

Linux hourly rate for jobs with a WFH option

Linux
Hourly Rate Histogram for Jobs with a WFH Option

Hourly rate distribution for jobs with remote working options citing Linux over the 6 months to 2 May 2025.

Linux hourly rate histogram for jobs with a WFH option

Linux
Co-occurring Skills and Capabilities with WFH Options by Category

The follow tables expand on the table above by listing co-occurrences grouped by category. The same employment type, locality and period is covered with up to 20 co-occurrences shown in each of the following categories:

Application Platforms
1 32 (5.21%) Confluence
2 18 (2.93%) nginx
3 17 (2.77%) Apache
4 16 (2.61%) Apache Spark
4 16 (2.61%) OpenStack
5 12 (1.95%) CMS
6 10 (1.63%) Microsoft Exchange
7 7 (1.14%) JBoss
8 6 (0.98%) Documentum
9 5 (0.81%) IIS
9 5 (0.81%) SharePoint
9 5 (0.81%) Tomcat
9 5 (0.81%) Traefik
10 4 (0.65%) Drupal
10 4 (0.65%) Jupyter
10 4 (0.65%) WebLogic
10 4 (0.65%) WordPress
11 3 (0.49%) Adobe Experience Manager
11 3 (0.49%) FileNet
12 2 (0.33%) Apache Airflow
Applications
1 6 (0.98%) Microsoft Office
2 2 (0.33%) Microsoft Project
3 1 (0.16%) Microsoft Excel
3 1 (0.16%) Microsoft PowerPoint
Business Applications
1 4 (0.65%) Sage X3
2 3 (0.49%) Oracle BPM
3 2 (0.33%) Actimize
3 2 (0.33%) Oracle Applications
3 2 (0.33%) Oracle Assets
3 2 (0.33%) Oracle Cash Management
3 2 (0.33%) Oracle EBS
3 2 (0.33%) Oracle EBS R12
3 2 (0.33%) Oracle E-Business Tax
3 2 (0.33%) Oracle General Ledger
3 2 (0.33%) Oracle Internet Expenses
3 2 (0.33%) Oracle iProcurement
3 2 (0.33%) Oracle Payables
3 2 (0.33%) Oracle Receivables
3 2 (0.33%) Oracle Subledger Accounting
3 2 (0.33%) Payment Gateway
4 1 (0.16%) IBM Planning Analytics
4 1 (0.16%) Kondor
4 1 (0.16%) SAP HCM
4 1 (0.16%) Unit4 Business World
Cloud Services
1 177 (28.83%) AWS
2 97 (15.80%) Azure
3 46 (7.49%) AWS CloudFormation
4 40 (6.51%) GitHub
5 32 (5.21%) Amazon EC2
6 29 (4.72%) GCP
7 25 (4.07%) Entra ID
8 19 (3.09%) Amazon S3
8 19 (3.09%) Virtual Private Cloud
9 18 (2.93%) Cloud Computing
9 18 (2.93%) Serverless
10 17 (2.77%) OpenShift
11 16 (2.61%) Amazon ECS
11 16 (2.61%) Amazon EKS
11 16 (2.61%) Azure DevOps
12 15 (2.44%) Amazon CloudWatch
13 12 (1.95%) AWS Lambda
13 12 (1.95%) Microsoft 365
14 10 (1.63%) AWS Fargate
14 10 (1.63%) Route 53
Communications & Networking
1 60 (9.77%) DNS
2 50 (8.14%) TCP/IP
3 48 (7.82%) Firewall
4 37 (6.03%) HTTP
5 29 (4.72%) DHCP
6 20 (3.26%) VPN
7 18 (2.93%) Internet
8 12 (1.95%) WAN
9 11 (1.79%) LAN
9 11 (1.79%) Network Security
9 11 (1.79%) SMTP
9 11 (1.79%) Wireless
10 10 (1.63%) Wi-Fi
11 8 (1.30%) SSL
12 7 (1.14%) SAN
13 6 (0.98%) SSH
14 5 (0.81%) HTTPS
14 5 (0.81%) NAS
15 4 (0.65%) Ethernet
15 4 (0.65%) Kerberos
Database & Business Intelligence
1 54 (8.79%) MongoDB
2 52 (8.47%) Relational Database
3 38 (6.19%) DB2
4 34 (5.54%) SQL Server
5 32 (5.21%) PostgreSQL
6 20 (3.26%) MySQL
7 19 (3.09%) Amazon RDS
7 19 (3.09%) Elasticsearch
7 19 (3.09%) Oracle Database
8 17 (2.77%) Hadoop
9 13 (2.12%) Big Data
9 13 (2.12%) KDB
9 13 (2.12%) Kdb+
10 12 (1.95%) RDBMS
11 10 (1.63%) Amazon Aurora
12 9 (1.47%) Data Warehouse
13 8 (1.30%) NoSQL
14 7 (1.14%) Power BI
15 6 (0.98%) Apache Cassandra
16 5 (0.81%) Apache Hive
Development Applications
1 85 (13.84%) Jenkins
2 78 (12.70%) Git
3 67 (10.91%) GitLab
4 46 (7.49%) JIRA
5 43 (7.00%) JUnit
6 19 (3.09%) Bitbucket
7 11 (1.79%) Subversion
8 10 (1.63%) Eclipse
8 10 (1.63%) Maven
9 8 (1.30%) Cucumber
10 7 (1.14%) Artifactory
10 7 (1.14%) Bitbucket Server
10 7 (1.14%) Jasmine
11 6 (0.98%) SonarQube
12 5 (0.81%) Ant
12 5 (0.81%) Atlassian Bamboo
12 5 (0.81%) Visual Studio
13 4 (0.65%) MSI
13 4 (0.65%) TeamCity
13 4 (0.65%) VSS/SourceSafe
General
1 176 (28.66%) Social Skills
2 116 (18.89%) Finance
3 71 (11.56%) Analytical Skills
4 64 (10.42%) Banking
5 42 (6.84%) Investment Banking
6 36 (5.86%) Public Sector
7 24 (3.91%) Front Office
8 15 (2.44%) Inclusion and Diversity
9 13 (2.12%) Law
10 10 (1.63%) Presentation Skills
11 7 (1.14%) Organisational Skills
11 7 (1.14%) Telecoms
12 6 (0.98%) Documentation Skills
12 6 (0.98%) Financial Institution
12 6 (0.98%) General Ledger
12 6 (0.98%) Influencing Skills
13 5 (0.81%) Wholesale Banking
14 4 (0.65%) Military
15 3 (0.49%) Back Office
16 2 (0.33%) French Language
Job Titles
1 120 (19.54%) Developer
2 103 (16.78%) Senior
3 70 (11.40%) DevOps Engineer
4 61 (9.93%) Java Developer
5 54 (8.79%) Linux Engineer
6 46 (7.49%) Architect
7 42 (6.84%) Linux Developer
8 33 (5.37%) Senior DevOps
9 32 (5.21%) Infrastructure Engineer
9 32 (5.21%) Senior Developer
10 29 (4.72%) Lead
11 28 (4.56%) Senior DevOps Engineer
11 28 (4.56%) Software Engineer
12 27 (4.40%) AWS Engineer
13 26 (4.23%) SQL Developer
14 23 (3.75%) Platform Engineer
14 23 (3.75%) Support Engineer
15 22 (3.58%) Analyst
15 22 (3.58%) Python Developer
16 20 (3.26%) Cloud Engineer
Libraries, Frameworks & Software Standards
1 55 (8.96%) Spring
2 49 (7.98%) Kafka
3 29 (4.72%) Elastic Stack
4 26 (4.23%) JMS
5 21 (3.42%) Middleware
6 19 (3.09%) HTML
7 18 (2.93%) Spring Boot
8 17 (2.77%) LDAP
9 16 (2.61%) Web Services
10 15 (2.44%) RESTful
11 13 (2.12%) CSS
12 11 (1.79%) AngularJS
12 11 (1.79%) cloud-init
12 11 (1.79%) Keycloak
12 11 (1.79%) REST
13 10 (1.63%) .NET
13 10 (1.63%) Node.js
13 10 (1.63%) OpenTelemetry
14 9 (1.47%) OpenAPI
14 9 (1.47%) Swagger
Miscellaneous
1 45 (7.33%) Data Structures
2 32 (5.21%) Data Centre
3 31 (5.05%) Equities
4 24 (3.91%) Algorithms
4 24 (3.91%) Management Information System
5 23 (3.75%) Cloud Native
6 21 (3.42%) Linux Command Line
7 19 (3.09%) Enterprise Software
8 15 (2.44%) Product Ownership
9 13 (2.12%) PKI
10 12 (1.95%) Derivative
10 12 (1.95%) Onboarding
11 11 (1.79%) Data Protection Act
11 11 (1.79%) Distributed Systems
12 10 (1.63%) Embedded Systems
12 10 (1.63%) Equity Derivative
12 10 (1.63%) Security Posture
13 9 (1.47%) Self-Motivation
14 8 (1.30%) Enterprise Storage
15 7 (1.14%) IoT
Operating Systems
1 219 (35.67%) Windows
2 134 (21.82%) Unix
3 116 (18.89%) Red Hat Enterprise Linux
4 64 (10.42%) Windows Server
5 23 (3.75%) Ubuntu
6 22 (3.58%) AIX
7 19 (3.09%) CentOS
8 11 (1.79%) Solaris
9 10 (1.63%) VMS
10 8 (1.30%) Oracle Linux
11 7 (1.14%) Android
11 7 (1.14%) SUSE
11 7 (1.14%) Windows Server 2016
11 7 (1.14%) Windows Server 2019
12 6 (0.98%) Amazon Linux
12 6 (0.98%) Mac OS
13 4 (0.65%) HPUX
13 4 (0.65%) Mac OS X
14 3 (0.49%) Apple iOS
14 3 (0.49%) Embedded Linux
Processes & Methodologies
1 144 (23.45%) CI/CD
2 142 (23.13%) DevOps
3 125 (20.36%) Agile
4 118 (19.22%) Problem-Solving
5 90 (14.66%) Containerisation
6 86 (14.01%) Software Engineering
7 81 (13.19%) Infrastructure as Code
8 74 (12.05%) SDLC
9 58 (9.45%) Migration
10 56 (9.12%) Performance Tuning
11 55 (8.96%) High Availability
12 54 (8.79%) Continuous Integration
13 45 (7.33%) Multithreading
14 44 (7.17%) Open Source
15 43 (7.00%) Configuration Management
16 40 (6.51%) Microservices
16 40 (6.51%) Test Automation
17 39 (6.35%) Infrastructure Engineering
18 36 (5.86%) ITIL
18 36 (5.86%) Platform Engineering
Programming Languages
1 244 (39.74%) Python
2 136 (22.15%) SQL
3 118 (19.22%) Java
4 95 (15.47%) Bash
5 75 (12.21%) Shell Script
6 60 (9.77%) PowerShell
7 50 (8.14%) C++
8 41 (6.68%) JavaScript
9 32 (5.21%) Perl
10 25 (4.07%) C
11 20 (3.26%) C#
11 20 (3.26%) Go
12 17 (2.77%) PL/SQL
13 13 (2.12%) TypeScript
14 9 (1.47%) Groovy
15 8 (1.30%) Ada
16 7 (1.14%) PHP
17 5 (0.81%) Bicep
17 5 (0.81%) Embedded C
17 5 (0.81%) Rust
Qualifications
1 146 (23.78%) Security Cleared
2 132 (21.50%) SC Cleared
3 31 (5.05%) Degree
4 21 (3.42%) AWS Certification
5 20 (3.26%) Computer Science Degree
6 18 (2.93%) DV Cleared
7 7 (1.14%) Cisco Certification
7 7 (1.14%) Master's Degree
8 5 (0.81%) AWS Certified Solutions Architect
8 5 (0.81%) CISSP
9 4 (0.65%) BPSS Clearance
9 4 (0.65%) CCNA
9 4 (0.65%) Oracle Certification
9 4 (0.65%) RHCE
9 4 (0.65%) VMware Certified Professional (VCP)
10 3 (0.49%) AWS Certified DevOps Engineer
10 3 (0.49%) Azure Certification
10 3 (0.49%) CCNP
10 3 (0.49%) CISA
10 3 (0.49%) CISM
Quality Assurance & Compliance
1 15 (2.44%) Disclosure Scotland
2 13 (2.12%) GDPR
3 10 (1.63%) QA
4 9 (1.47%) NCSC
5 8 (1.30%) NIST
6 7 (1.14%) Cyber Essentials
6 7 (1.14%) HL7
7 6 (0.98%) SLA
8 4 (0.65%) Cyber Essentials PLUS
8 4 (0.65%) PCI DSS
8 4 (0.65%) Sarbanes-Oxley
9 3 (0.49%) Data Quality
9 3 (0.49%) ISO/IEC 27001
9 3 (0.49%) SOC 2
10 2 (0.33%) ITGC
11 1 (0.16%) Accessibility
11 1 (0.16%) Basel III
11 1 (0.16%) HIPAA
11 1 (0.16%) MiFID
11 1 (0.16%) WCAG
System Software
1 106 (17.26%) Docker
2 54 (8.79%) Active Directory
3 40 (6.51%) VMware Infrastructure
4 9 (1.47%) Hyper-V
4 9 (1.47%) Virtual Machines
4 9 (1.47%) Virtual Servers
5 8 (1.30%) Firmware
5 8 (1.30%) VMware ESXi
6 7 (1.14%) vSphere
7 6 (0.98%) Apache ZooKeeper
7 6 (0.98%) Veritas Cluster Server
7 6 (0.98%) Virtual Desktop
8 5 (0.81%) NFS
9 3 (0.49%) Microsoft Virtual Server
9 3 (0.49%) Oracle RAC
9 3 (0.49%) Samba
9 3 (0.49%) VMware NSX
10 2 (0.33%) Ceph
10 2 (0.33%) Embedded Firmware
10 2 (0.33%) Time Sharing Option
Systems Management
1 152 (24.76%) Kubernetes
2 144 (23.45%) Terraform
3 134 (21.82%) Ansible
4 48 (7.82%) Grafana
5 42 (6.84%) Puppet
6 41 (6.68%) Progress Chef
7 34 (5.54%) Prometheus
8 17 (2.77%) Argo
8 17 (2.77%) Packer
9 12 (1.95%) ZABBIX
10 11 (1.79%) Consul
11 9 (1.47%) Istio
12 8 (1.30%) Kibana
12 8 (1.30%) Rancher
13 7 (1.14%) Jamf Pro
13 7 (1.14%) linkerd
13 7 (1.14%) Microsoft Intune
13 7 (1.14%) Nagios
13 7 (1.14%) Tivoli Storage Manager
14 6 (0.98%) Single Sign-On
Vendors
1 83 (13.52%) Red Hat
2 82 (13.36%) VMware
3 69 (11.24%) Microsoft
4 57 (9.28%) Oracle
5 47 (7.65%) Splunk
6 42 (6.84%) Sybase
7 28 (4.56%) IBM
8 21 (3.42%) Cisco
8 21 (3.42%) ServiceNow
9 19 (3.09%) CyberArk
10 14 (2.28%) Dynatrace
10 14 (2.28%) HP
11 13 (2.12%) SAP
11 13 (2.12%) SolarWinds
12 10 (1.63%) Dell
12 10 (1.63%) F5
12 10 (1.63%) Google
13 9 (1.47%) Apple
13 9 (1.47%) Atlassian
13 9 (1.47%) Veritas