Manufacturing Contracts with Hybrid/Remote/WFH Options

Manufacturing
UK > Work from Home

The table below looks at the prevalence of the term Manufacturing in remote or hybrid contract work. Included is a benchmarking guide to the contractor rates offered in vacancies that cited Manufacturing over the 6 months leading up to 5 August 2025, comparing them to the same period in the previous two years.

6 months to
5 Aug 2025
Same period 2024 Same period 2023
Rank 133 106 125
Rank change year-on-year -27 +19 +35
Contract jobs citing Manufacturing 209 273 437
As % of all contract jobs with a WFH option 2.06% 2.07% 1.95%
As % of the General category 3.28% 3.52% 3.33%
Number of daily rates quoted 107 148 303
10th Percentile £281 £358 £302
25th Percentile £425 £425 £414
Median daily rate (50th Percentile) £550 £531 £510
Median % change year-on-year +3.53% +4.17% -7.27%
75th Percentile £675 £638 £625
90th Percentile £775 £775 £725
UK median daily rate £550 £500 £525
% change year-on-year +10.00% -4.76% -4.55%
Number of hourly rates quoted 28 22 28
10th Percentile £25.25 £12.75 £31.68
25th Percentile £46.26 £23.99 £34.31
Median hourly rate £61.75 £40.00 £43.75
Median % change year-on-year +54.38% -8.57% -2.78%
75th Percentile £67.00 £57.00 £52.19
90th Percentile £75.75 £62.00 £75.00
UK median hourly rate £33.91 £32.95 £50.00
% change year-on-year +2.92% -34.11% +25.00%

All General Skills
Work from Home

Manufacturing falls under the General Skills category. For comparison with the information above, the following table provides summary statistics for all contract job vacancies with remote or hybrid options requiring common skills.

Contract vacancies with a requirement for common skills 6,365 7,764 13,116
As % of all contract jobs with a WFH option 62.85% 58.84% 58.46%
Number of daily rates quoted 4,194 5,019 9,140
10th Percentile £325 £325 £350
25th Percentile £413 £425 £450
Median daily rate (50th Percentile) £513 £538 £550
Median % change year-on-year -4.65% -2.27% -
75th Percentile £638 £650 £675
90th Percentile £788 £800 £775
UK median daily rate £500 £525 £550
% change year-on-year -4.76% -4.55% -
Number of hourly rates quoted 220 321 301
10th Percentile £14.00 £16.50 £18.50
25th Percentile £17.51 £27.84 £25.71
Median hourly rate £34.00 £43.00 £47.50
Median % change year-on-year -20.93% -9.47% +35.71%
75th Percentile £64.52 £57.50 £65.00
90th Percentile £72.75 £72.50 £75.00
UK median hourly rate £25.15 £38.12 £30.00
% change year-on-year -34.02% +27.07% +21.53%

Manufacturing
Trend for Jobs with a WFH Option

Job vacancies with remote working options citing Manufacturing as a proportion of all IT jobs advertised.
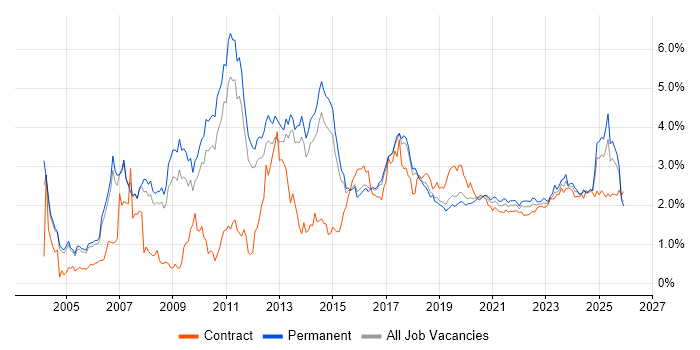
Manufacturing trend for jobs with Hybrid/Remote/WFH options

Manufacturing
Daily Rate Trend for Jobs with a WFH Option

3-month moving average daily rate quoted in job vacancies with remote working options citing Manufacturing.

Manufacturing daily rate for jobs with a WFH option

Manufacturing
Daily Rate Histogram for Jobs with a WFH Option

Daily rate distribution for jobs with remote working options citing Manufacturing over the 6 months to 5 August 2025.

Manufacturing daily rate histogram for jobs with a WFH option

Manufacturing
Hourly Rate Trend for Jobs with a WFH Option

3-month moving average hourly rate quoted in job vacancies with remote working options citing Manufacturing.

Manufacturing hourly rate for jobs with a WFH option

Manufacturing
Hourly Rate Histogram for Jobs with a WFH Option

Hourly rate distribution for jobs with remote working options citing Manufacturing over the 6 months to 5 August 2025.

Manufacturing hourly rate histogram for jobs with a WFH option

Manufacturing
Co-occurring Skills and Capabilities with WFH Options by Category

The follow tables expand on the table above by listing co-occurrences grouped by category. The same employment type, locality and period is covered with up to 20 co-occurrences shown in each of the following categories:

Application Platforms
1 10 (4.78%) SharePoint
2 7 (3.35%) Microsoft Exchange
3 5 (2.39%) Confluence
4 2 (0.96%) CMS
4 2 (0.96%) Oracle Workflow
5 1 (0.48%) Apache Spark
5 1 (0.48%) FactoryTalk
Applications
1 11 (5.26%) Microsoft Project
2 8 (3.83%) Microsoft Excel
3 6 (2.87%) Microsoft Office
3 6 (2.87%) Microsoft PowerPoint
4 4 (1.91%) MS Visio
5 2 (0.96%) Spreadsheet
6 1 (0.48%) Adobe Illustrator
6 1 (0.48%) InVision
6 1 (0.48%) Photoshop
6 1 (0.48%) Sketch
6 1 (0.48%) SOLIDWORKS
6 1 (0.48%) Windchill
Business Applications
1 27 (12.92%) SAP S/4HANA
2 9 (4.31%) Oracle EBS
3 8 (3.83%) SAP Oil and Gas
4 6 (2.87%) SAP ERP
5 4 (1.91%) SAP PP
6 3 (1.44%) Dynamics AX
6 3 (1.44%) Oracle ASCP
6 3 (1.44%) SAP APO
6 3 (1.44%) SAP GTS
6 3 (1.44%) Workday HCM
7 2 (0.96%) Oracle Assets
7 2 (0.96%) Oracle EBS R12
7 2 (0.96%) Oracle General Ledger
7 2 (0.96%) Oracle Payables
7 2 (0.96%) Salesforce CRM
7 2 (0.96%) SAP MDG
7 2 (0.96%) SAP MM
7 2 (0.96%) SAP SCM
7 2 (0.96%) Teamcenter
8 1 (0.48%) SAP IBP
Cloud Services
1 29 (13.88%) Azure
2 16 (7.66%) Power Platform
3 15 (7.18%) Dynamics 365
4 13 (6.22%) Azure DevOps
5 11 (5.26%) Microsoft 365
6 9 (4.31%) AWS
7 6 (2.87%) SaaS
8 4 (1.91%) GCP
8 4 (1.91%) Salesforce Sales Cloud
8 4 (1.91%) Salesforce Service Cloud
9 3 (1.44%) Power Automate
9 3 (1.44%) PowerApps
9 3 (1.44%) SuccessFactors
10 2 (0.96%) Azure Data Factory
10 2 (0.96%) Cloud Computing
10 2 (0.96%) GitHub
10 2 (0.96%) iPaaS
10 2 (0.96%) Smartsheet
11 1 (0.48%) Entra ID
11 1 (0.48%) ServiceMax
Communications & Networking
1 5 (2.39%) Firewall
2 4 (1.91%) PSTN
2 4 (1.91%) VoIP
3 1 (0.48%) BGP
3 1 (0.48%) Cisco IOS
3 1 (0.48%) DHCP
3 1 (0.48%) DNS
3 1 (0.48%) EIGRP
3 1 (0.48%) Ethernet
3 1 (0.48%) Intrusion Detection
3 1 (0.48%) Network Security
3 1 (0.48%) OSPF
3 1 (0.48%) SD-WAN
3 1 (0.48%) SNMP
3 1 (0.48%) Spanning Tree
3 1 (0.48%) TACACS
3 1 (0.48%) VLAN
3 1 (0.48%) Wireless
3 1 (0.48%) WLAN
Database & Business Intelligence
1 14 (6.70%) Power BI
2 4 (1.91%) Big Data
2 4 (1.91%) Data Warehouse
3 3 (1.44%) Azure SQL Database
3 3 (1.44%) SAP HANA
4 2 (0.96%) Data Lake
4 2 (0.96%) SQL Server
4 2 (0.96%) Tableau
5 1 (0.48%) Apache Hive
5 1 (0.48%) Ataccama
5 1 (0.48%) Data Hub
5 1 (0.48%) Hadoop
5 1 (0.48%) HBase
5 1 (0.48%) Impala
5 1 (0.48%) Oracle Database
5 1 (0.48%) PostgreSQL
5 1 (0.48%) SAP BW
5 1 (0.48%) SAP Data Services
5 1 (0.48%) SQL Server Integration Services
5 1 (0.48%) SQL Server Reporting Services
Development Applications
1 10 (4.78%) JIRA
2 5 (2.39%) Git
3 3 (1.44%) Cypress.io
3 3 (1.44%) Hudson
3 3 (1.44%) Selenium
4 2 (0.96%) Appium
4 2 (0.96%) Gatling
4 2 (0.96%) JMeter
4 2 (0.96%) JUnit
4 2 (0.96%) LoadRunner
4 2 (0.96%) Postman
4 2 (0.96%) TestNG
5 1 (0.48%) Axure RP
5 1 (0.48%) LabVIEW
5 1 (0.48%) LSMW
General
1 89 (42.58%) Social Skills
2 82 (39.23%) Finance
3 41 (19.62%) Marketing
4 40 (19.14%) Electronics
4 40 (19.14%) Public Sector
5 38 (18.18%) Telecoms
6 30 (14.35%) Analytical Skills
7 18 (8.61%) Retail
8 13 (6.22%) Aerospace
9 12 (5.74%) Pharmaceutical
10 10 (4.78%) Automotive
11 6 (2.87%) Influencing Skills
12 5 (2.39%) Legal
13 4 (1.91%) Documentation Skills
13 4 (1.91%) Organisational Skills
13 4 (1.91%) Presentation Skills
14 3 (1.44%) Agriculture
14 3 (1.44%) Aviation
14 3 (1.44%) General Ledger
14 3 (1.44%) Inclusion and Diversity
Job Titles
1 39 (18.66%) Consultant
2 30 (14.35%) Project Manager
3 22 (10.53%) Analyst
4 20 (9.57%) Architect
5 19 (9.09%) Senior
6 18 (8.61%) Lead
7 17 (8.13%) Business Analyst
8 14 (6.70%) Developer
9 9 (4.31%) SAP Consultant
10 8 (3.83%) Enterprise Architect
10 8 (3.83%) SAP Manager
11 6 (2.87%) .NET Developer
11 6 (2.87%) C# .NET Developer
11 6 (2.87%) C# Developer
11 6 (2.87%) Oracle Consultant
11 6 (2.87%) Senior Developer
11 6 (2.87%) Solutions Architect
12 5 (2.39%) Azure Developer
12 5 (2.39%) Dynamics 365 Consultant
12 5 (2.39%) Security Consultant
Libraries, Frameworks & Software Standards
1 8 (3.83%) .NET
2 5 (2.39%) .NET Core
2 5 (2.39%) EDI
3 4 (1.91%) Lightning Web Components
3 4 (1.91%) REST
4 3 (1.44%) cXML
4 3 (1.44%) EDIFACT
4 3 (1.44%) RESTful
4 3 (1.44%) Visualforce
5 2 (0.96%) SailPoint
5 2 (0.96%) XML
6 1 (0.48%) .NET Framework
6 1 (0.48%) AngularJS
6 1 (0.48%) CSS
6 1 (0.48%) Entity Framework
6 1 (0.48%) jQuery
6 1 (0.48%) JSON
6 1 (0.48%) Kafka
6 1 (0.48%) React
6 1 (0.48%) XSL
Miscellaneous
1 25 (11.96%) Life Science
2 19 (9.09%) Renewable Energy
3 8 (3.83%) Onboarding
4 7 (3.35%) Management Information System
5 6 (2.87%) FMCG
5 6 (2.87%) Product Ownership
6 4 (1.91%) Legacy Systems
6 4 (1.91%) Self-Motivation
7 3 (1.44%) CMDB
7 3 (1.44%) Enterprise Software
7 3 (1.44%) FPGA
7 3 (1.44%) LIMS
7 3 (1.44%) Operational Technology
7 3 (1.44%) PCIe
7 3 (1.44%) State Machine
7 3 (1.44%) Virtual Team
8 2 (0.96%) Data Structures
8 2 (0.96%) NHS
8 2 (0.96%) PMI
8 2 (0.96%) Robotics
Operating Systems
1 7 (3.35%) Windows
2 4 (1.91%) Linux
3 2 (0.96%) Windows 10
4 1 (0.48%) Windows Server
4 1 (0.48%) Windows XP
Processes & Methodologies
1 58 (27.75%) Business Intelligence
2 44 (21.05%) ERP
3 43 (20.57%) Programme Management
4 39 (18.66%) Problem-Solving
5 38 (18.18%) Agile
5 38 (18.18%) Digital Marketing
5 38 (18.18%) Stakeholder Management
6 35 (16.75%) Migration
7 32 (15.31%) Project Management
8 28 (13.40%) Change Management
9 26 (12.44%) Stakeholder Engagement
10 22 (10.53%) Project Delivery
11 19 (9.09%) Risk Management
11 19 (9.09%) User Acceptance Testing
11 19 (9.09%) Workshop Facilitation
12 18 (8.61%) DevOps
12 18 (8.61%) Logistics
13 17 (8.13%) Data Migration
14 16 (7.66%) Collaborative Working
15 15 (7.18%) Decision-Making
Programming Languages
1 16 (7.66%) SQL
2 15 (7.18%) C#
3 11 (5.26%) PowerShell
4 4 (1.91%) Apex Code
4 4 (1.91%) JavaScript
5 3 (1.44%) C++
5 3 (1.44%) Java
6 1 (0.48%) ABAP
6 1 (0.48%) Assembly Language
6 1 (0.48%) C
6 1 (0.48%) JCL
6 1 (0.48%) Korn
6 1 (0.48%) Natural
6 1 (0.48%) PL/SQL
6 1 (0.48%) Python
6 1 (0.48%) Scala
6 1 (0.48%) X++
Qualifications
1 37 (17.70%) Security Cleared
2 27 (12.92%) Degree
2 27 (12.92%) SC Cleared
3 11 (5.26%) PMP
4 10 (4.78%) DV Cleared
5 9 (4.31%) PMI Certification
6 7 (3.35%) CISSP
7 6 (2.87%) CISM
8 5 (2.39%) BPSS Clearance
8 5 (2.39%) CESG Certified Professional
8 5 (2.39%) ISO 27001 Lead Auditor
9 4 (1.91%) Master's Degree
10 3 (1.44%) ACCA
10 3 (1.44%) AWS Certification
10 3 (1.44%) Azure Certification
10 3 (1.44%) Computer Science Degree
10 3 (1.44%) Oracle Certification
11 2 (0.96%) Cisco Certification
11 2 (0.96%) Microsoft Certification
11 2 (0.96%) SAP Certification
Quality Assurance & Compliance
1 8 (3.83%) ISO/IEC 27001
2 7 (3.35%) NCSC
3 6 (2.87%) Data Quality
3 6 (2.87%) GxP
4 5 (2.39%) QA
4 5 (2.39%) RMADS
5 4 (1.91%) Accessibility
6 3 (1.44%) PMO
6 3 (1.44%) SLA
7 2 (0.96%) 21 CFR Part 11
7 2 (0.96%) GDPR
7 2 (0.96%) JSP 440
7 2 (0.96%) PMBOK
7 2 (0.96%) Sarbanes-Oxley
8 1 (0.48%) Cyber Essentials
8 1 (0.48%) HL7
8 1 (0.48%) IFRS
8 1 (0.48%) ISO 9001
8 1 (0.48%) NIST
System Software
1 4 (1.91%) Active Directory
2 1 (0.48%) Docker
2 1 (0.48%) HDFS
2 1 (0.48%) VMware Infrastructure
Systems Management
1 5 (2.39%) Terraform
2 1 (0.48%) CEMLI
2 1 (0.48%) Data Guard
2 1 (0.48%) Kubernetes
2 1 (0.48%) Microsoft Intune
2 1 (0.48%) Nagios
2 1 (0.48%) Oracle Enterprise Manager
2 1 (0.48%) Oracle RMAN
Vendors
1 91 (43.54%) SAP
2 42 (20.10%) Microsoft
3 15 (7.18%) Oracle
4 12 (5.74%) Salesforce
5 9 (4.31%) Ariba
6 7 (3.35%) Workday
7 6 (2.87%) IFS
8 4 (1.91%) Cisco
9 3 (1.44%) Meraki
10 2 (0.96%) Autodesk
10 2 (0.96%) CrowdStrike
10 2 (0.96%) Facebook
10 2 (0.96%) Hitachi
10 2 (0.96%) Informatica
10 2 (0.96%) MobileIron
10 2 (0.96%) Remedy
10 2 (0.96%) Rockwell
10 2 (0.96%) ServiceNow
10 2 (0.96%) Siemens
10 2 (0.96%) webMethods