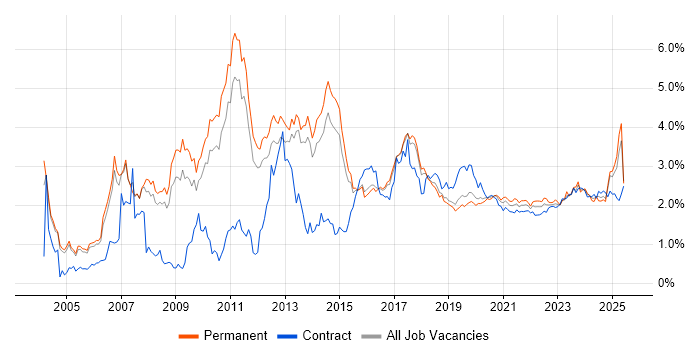
Manufacturing Jobs with Hybrid/Remote/WFH Options

Manufacturing
UK > Work from Home

The table below looks at the prevalence of the term Manufacturing in remote or hybrid work. Included is a benchmarking guide to the salaries offered in vacancies that cited Manufacturing over the 6 months leading up to 17 June 2025, comparing them to the same period in the previous two years.

6 months to
17 Jun 2025
Same period 2024 Same period 2023
Rank 75 134 185
Rank change year-on-year +59 +51 +29
Permanent jobs citing Manufacturing 882 817 697
As % of all permanent jobs with a WFH option 4.51% 2.29% 1.89%
As % of the General category 5.79% 3.81% 2.89%
Number of salaries quoted 273 549 497
10th Percentile £31,750 £33,500 £33,450
25th Percentile £41,250 £41,250 £42,500
Median annual salary (50th Percentile) £52,500 £51,500 £55,000
Median % change year-on-year +1.94% -6.36% -2.22%
75th Percentile £72,500 £66,250 £67,500
90th Percentile £80,000 £78,750 £85,000
UK median annual salary £50,818 £45,000 £52,500
% change year-on-year +12.93% -14.29% +5.00%

All General Skills
Work from Home

Manufacturing falls under the General Skills category. For comparison with the information above, the following table provides summary statistics for all permanent job vacancies with remote or hybrid options requiring common skills.

Permanent vacancies with a requirement for common skills 15,246 21,458 24,145
As % of all permanent jobs with a WFH option 78.04% 60.08% 65.36%
Number of salaries quoted 7,610 15,253 16,716
10th Percentile £25,087 £31,579 £36,250
25th Percentile £36,250 £41,250 £46,570
Median annual salary (50th Percentile) £55,000 £55,000 £62,500
Median % change year-on-year - -12.00% +4.17%
75th Percentile £76,250 £75,000 £82,500
90th Percentile £102,500 £95,000 £105,000
UK median annual salary £55,000 £52,500 £60,000
% change year-on-year +4.76% -12.50% -

Manufacturing
Trend for Jobs with a WFH Option

Job vacancies with remote working options citing Manufacturing as a proportion of all IT jobs advertised.

Manufacturing trend for jobs with Hybrid/Remote/WFH options

Manufacturing
Salary Trend for Jobs with a WFH Option

3-month moving average salary quoted in job vacancies with remote working options citing Manufacturing.

Manufacturing salary trend for jobs with a WFH option

Manufacturing
Salary Histogram for Jobs with a WFH Option

Salary distribution for jobs with remote working options citing Manufacturing over the 6 months to 17 June 2025.

Manufacturing salary histogram for jobs with a WFH option

Manufacturing
Co-occurring Skills and Capabilities with WFH Options by Category

The follow tables expand on the table above by listing co-occurrences grouped by category. The same employment type, locality and period is covered with up to 20 co-occurrences shown in each of the following categories:

Application Platforms
1 39 (4.42%) SharePoint
2 21 (2.38%) Microsoft Exchange
3 3 (0.34%) CMS
4 2 (0.23%) Confluence
4 2 (0.23%) Kinematics
4 2 (0.23%) Sitecore CMS
5 1 (0.11%) Apache
5 1 (0.11%) Mendix
5 1 (0.11%) SharePoint 2013
Applications
1 17 (1.93%) Microsoft Excel
2 12 (1.36%) Microsoft Office
3 7 (0.79%) SOLIDWORKS
4 5 (0.57%) Microsoft Project
5 3 (0.34%) Autodesk Inventor
5 3 (0.34%) Microsoft PowerPoint
6 2 (0.23%) AutoCAD
6 2 (0.23%) CATIA
6 2 (0.23%) Spreadsheet
7 1 (0.11%) Adobe Illustrator
7 1 (0.11%) MS Visio
Business Applications
1 27 (3.06%) Sage 200
2 19 (2.15%) NetSuite
3 16 (1.81%) Sage CRM
3 16 (1.81%) SAP S/4HANA
4 14 (1.59%) Sage 50
5 9 (1.02%) Oracle EBS
5 9 (1.02%) SAP PP
6 8 (0.91%) Infor M3
7 6 (0.68%) Dynamics AX
8 5 (0.57%) SAP IBP
9 4 (0.45%) IBM Planning Analytics
9 4 (0.45%) Oracle ERP
9 4 (0.45%) Sage 1000
9 4 (0.45%) Sage X3
10 3 (0.34%) SAP EHS
11 2 (0.23%) SAP ERP
11 2 (0.23%) SAP EWM
11 2 (0.23%) SAP FI
11 2 (0.23%) SAP FI/CO
11 2 (0.23%) SAP Oil and Gas
Cloud Services
1 48 (5.44%) Azure
2 33 (3.74%) Microsoft 365
3 28 (3.17%) AWS
4 25 (2.83%) Power Platform
5 16 (1.81%) GitHub
6 11 (1.25%) Amazon SageMaker
7 10 (1.13%) SaaS
8 8 (0.91%) Microsoft Copilot
9 7 (0.79%) Amazon S3
9 7 (0.79%) Entra ID
9 7 (0.79%) Power Automate
9 7 (0.79%) PowerApps
10 6 (0.68%) Amazon EC2
10 6 (0.68%) Azure Data Factory
11 4 (0.45%) AWS Lambda
11 4 (0.45%) Cloud Computing
11 4 (0.45%) Dynamics 365
11 4 (0.45%) GCP
11 4 (0.45%) Serverless
12 3 (0.34%) Virtual Private Cloud
Communications & Networking
1 22 (2.49%) Firewall
2 10 (1.13%) WAN
3 9 (1.02%) Internet
3 9 (1.02%) LAN
4 8 (0.91%) Ethernet
5 7 (0.79%) Remote Desktop
5 7 (0.79%) RS-232
6 6 (0.68%) DHCP
6 6 (0.68%) DNS
6 6 (0.68%) RS-485
7 5 (0.57%) Modbus
7 5 (0.57%) Profibus
7 5 (0.57%) ZigBee
8 4 (0.45%) Bluetooth
8 4 (0.45%) SD-WAN
8 4 (0.45%) VoIP
8 4 (0.45%) Wireless
9 3 (0.34%) SSL
9 3 (0.34%) TCP/IP
9 3 (0.34%) VPN
Database & Business Intelligence
1 36 (4.08%) SQL Server
2 24 (2.72%) Power BI
3 15 (1.70%) Data Warehouse
4 10 (1.13%) MySQL
5 9 (1.02%) Oracle Reports
6 8 (0.91%) SQL Server Reporting Services
7 7 (0.79%) Tableau
8 6 (0.68%) Data Lake
8 6 (0.68%) SQL Server Integration Services
9 5 (0.57%) NoSQL
10 4 (0.45%) Amazon RDS
10 4 (0.45%) Big Data
10 4 (0.45%) Data Hub
10 4 (0.45%) Metadata
10 4 (0.45%) Metadata Repository
10 4 (0.45%) PostgreSQL
11 3 (0.34%) Azure SQL Data Warehouse
11 3 (0.34%) MongoDB
11 3 (0.34%) QlikView
11 3 (0.34%) SAP BW
Development Applications
1 14 (1.59%) Jenkins
2 13 (1.47%) Visual Studio
3 7 (0.79%) Git
3 7 (0.79%) Octopus Deploy
3 7 (0.79%) TeamCity
4 6 (0.68%) LabVIEW
5 4 (0.45%) JIRA
6 3 (0.34%) SQL Server Management Studio (SSMS)
7 2 (0.23%) GitLab
8 1 (0.11%) Bitbucket
8 1 (0.11%) CMake
8 1 (0.11%) Fiddler
8 1 (0.11%) JUnit
8 1 (0.11%) Oracle APEX
8 1 (0.11%) Oracle Forms
8 1 (0.11%) SonarQube
8 1 (0.11%) Subversion
8 1 (0.11%) WiX
General
1 576 (65.31%) Retail
2 196 (22.22%) Dutch Language
2 196 (22.22%) Finnish Language
3 144 (16.33%) Social Skills
4 136 (15.42%) Finance
5 111 (12.59%) Analytical Skills
6 66 (7.48%) Electronics
7 64 (7.26%) Marketing
8 51 (5.78%) Public Sector
9 50 (5.67%) Telecoms
10 49 (5.56%) Catalan Language
11 19 (2.15%) Inclusion and Diversity
12 18 (2.04%) Pharmaceutical
13 13 (1.47%) Automotive
14 10 (1.13%) Aerospace
14 10 (1.13%) Organisational Skills
15 9 (1.02%) Law
16 6 (0.68%) Advertising
17 5 (0.57%) Documentation Skills
17 5 (0.57%) Legal
Job Titles
1 540 (61.22%) Trainer
2 72 (8.16%) Analyst
3 33 (3.74%) Developer
4 31 (3.51%) Senior
5 25 (2.83%) Support Analyst
6 21 (2.38%) Consultant
7 20 (2.27%) Business Analyst
8 19 (2.15%) IT Support
9 16 (1.81%) Sage 200 Support
9 16 (1.81%) Sage Support
10 15 (1.70%) IT Analyst
11 13 (1.47%) IT Support Analyst
11 13 (1.47%) Software Engineer
11 13 (1.47%) Technical Support
12 12 (1.36%) .NET Developer
12 12 (1.36%) Architect
13 11 (1.25%) .NET Software Developer
13 11 (1.25%) Administrator
13 11 (1.25%) Data Analyst
13 11 (1.25%) ERP Analyst
Libraries, Frameworks & Software Standards
1 26 (2.95%) .NET
2 23 (2.61%) HTML
3 21 (2.38%) CSS
4 17 (1.93%) .NET Core
4 17 (1.93%) .NET Framework
5 12 (1.36%) HTML5
6 11 (1.25%) jQuery
6 11 (1.25%) React Native
7 10 (1.13%) ASP.NET
7 10 (1.13%) PyTorch
7 10 (1.13%) React
7 10 (1.13%) scikit-learn
7 10 (1.13%) TensorFlow
8 9 (1.02%) Keras
8 9 (1.02%) NumPy
9 6 (0.68%) Entity Framework
10 5 (0.57%) ASP.NET MVC
10 5 (0.57%) Bootstrap
10 5 (0.57%) LINQ
10 5 (0.57%) NHibernate
Miscellaneous
1 544 (61.68%) Robotics
2 36 (4.08%) Self-Motivation
3 21 (2.38%) FMCG
4 19 (2.15%) PMI
5 16 (1.81%) Management Information System
6 12 (1.36%) Algorithms
7 10 (1.13%) Analogue Electronics
8 8 (0.91%) IoT
8 8 (0.91%) Life Science
8 8 (0.91%) Pricing Data
8 8 (0.91%) Product Ownership
9 7 (0.79%) Cloud Native
9 7 (0.79%) Enterprise Software
9 7 (0.79%) Manufacturing Execution System
9 7 (0.79%) Renewable Energy
10 6 (0.68%) Embedded Systems
10 6 (0.68%) Onboarding
11 4 (0.45%) Analytical Mindset
12 3 (0.34%) Digital Signage
12 3 (0.34%) Legacy Systems
Operating Systems
1 35 (3.97%) Windows
2 28 (3.17%) Windows Server
3 21 (2.38%) Linux
4 8 (0.91%) Windows Server 2019
5 4 (0.45%) FreeRTOS
6 3 (0.34%) Embedded Linux
6 3 (0.34%) Mac OS
7 1 (0.11%) Debian
7 1 (0.11%) Robot Operating System
7 1 (0.11%) Solaris
7 1 (0.11%) Unix
7 1 (0.11%) Windows 10
7 1 (0.11%) Windows Server 2016
Processes & Methodologies
1 640 (72.56%) Problem-Solving
2 565 (64.06%) Artificial Intelligence
3 560 (63.49%) Machine Learning
4 542 (61.45%) Generative AI
5 539 (61.11%) Data Privacy
5 539 (61.11%) LLM
5 539 (61.11%) Red Team
6 100 (11.34%) Business Intelligence
7 90 (10.20%) ERP
8 61 (6.92%) Biology
9 58 (6.58%) Continuous Improvement
10 56 (6.35%) Project Management
11 52 (5.90%) Chemistry
12 51 (5.78%) Agile
12 51 (5.78%) Analytics
13 50 (5.67%) Biochemistry
14 46 (5.22%) Digital Marketing
14 46 (5.22%) Programme Management
15 41 (4.65%) Computer Science
16 40 (4.54%) Stakeholder Management
Programming Languages
1 99 (11.22%) SQL
2 37 (4.20%) Python
3 31 (3.51%) C#
4 26 (2.95%) JavaScript
5 17 (1.93%) C
6 10 (1.13%) PowerShell
6 10 (1.13%) T-SQL
7 9 (1.02%) C++
7 9 (1.02%) Embedded C
7 9 (1.02%) PL/SQL
8 8 (0.91%) Shell Script
9 7 (0.79%) C-shell
9 7 (0.79%) Java
9 7 (0.79%) Korn
10 5 (0.57%) VBA
11 4 (0.45%) PHP
11 4 (0.45%) TypeScript
11 4 (0.45%) VB.NET
12 3 (0.34%) Bash
13 2 (0.23%) X++
Qualifications
1 615 (69.73%) Degree
2 32 (3.63%) Security Cleared
3 27 (3.06%) DV Cleared
4 22 (2.49%) Computer Science Degree
5 20 (2.27%) Master's Degree
5 20 (2.27%) PMI Certification
6 17 (1.93%) PhD
7 10 (1.13%) SC Cleared
8 9 (1.02%) Cisco Certification
9 8 (0.91%) CCNA
10 7 (0.79%) Microsoft Certification
11 5 (0.57%) ACCA
11 5 (0.57%) CCNP
12 4 (0.45%) CIMA
12 4 (0.45%) Network+ Certification
13 3 (0.34%) Chartered Engineer
13 3 (0.34%) CISSP
13 3 (0.34%) HNC
13 3 (0.34%) MCSE
14 2 (0.23%) MCSA
Quality Assurance & Compliance
1 14 (1.59%) QA
2 7 (0.79%) GxP
3 6 (0.68%) Data Quality
3 6 (0.68%) GMP
4 3 (0.34%) GDPR
4 3 (0.34%) ISO/IEC 27001
5 2 (0.23%) 21 CFR Part 11
5 2 (0.23%) Accessibility
5 2 (0.23%) NIST
5 2 (0.23%) PMO
6 1 (0.11%) Sarbanes-Oxley
System Software
1 16 (1.81%) Active Directory
2 9 (1.02%) Firmware
3 6 (0.68%) Hyper-V
4 5 (0.57%) Docker
4 5 (0.57%) Embedded Firmware
4 5 (0.57%) Terminal Services
5 1 (0.11%) VMware Infrastructure
5 1 (0.11%) vSphere
Systems Management
1 6 (0.68%) Kubernetes
1 6 (0.68%) Terraform
2 3 (0.34%) Ansible
2 3 (0.34%) Microsoft Intune
3 1 (0.11%) Active Directory Federation Services
3 1 (0.11%) Data Guard
3 1 (0.11%) EMC NetWorker
3 1 (0.11%) FortiGate
3 1 (0.11%) Kibana
3 1 (0.11%) Kustomize
3 1 (0.11%) Marathon
3 1 (0.11%) Oracle ZFS
3 1 (0.11%) Single Sign-On
3 1 (0.11%) ZABBIX
Vendors
1 543 (61.56%) Adobe
2 542 (61.45%) Google
3 540 (61.22%) Databricks
4 92 (10.43%) SAP
5 52 (5.90%) Microsoft
6 38 (4.31%) Sage
7 29 (3.29%) Oracle
8 17 (1.93%) Cisco
9 12 (1.36%) Salesforce
10 10 (1.13%) Infor
11 8 (0.91%) Fortinet
11 8 (0.91%) VMware
12 6 (0.68%) Meraki
13 5 (0.57%) Informatica
14 4 (0.45%) EMC
14 4 (0.45%) IBM
14 4 (0.45%) JD Edwards
15 3 (0.34%) Acronis
15 3 (0.34%) Allen-Bradley
15 3 (0.34%) Kaseya