Middleware Jobs with Hybrid/Remote/WFH Options

Middleware
UK > Work from Home

The table below provides summary statistics for permanent remote or hybrid work requiring Middleware skills. It includes a benchmarking guide to the annual salaries offered in vacancies that cited Middleware over the 6 months leading up to 1 May 2025, comparing them to the same period in the previous two years.

6 months to
1 May 2025
Same period 2024 Same period 2023
Rank 285 453 358
Rank change year-on-year +168 -95 +124
Permanent jobs citing Middleware 114 139 352
As % of all permanent jobs with a WFH option 0.76% 0.41% 0.82%
As % of the Libraries, Frameworks & Software Standards category 2.90% 1.55% 2.43%
Number of salaries quoted 86 123 239
10th Percentile £43,125 £40,000 £44,000
25th Percentile £51,250 £55,625 £52,500
Median annual salary (50th Percentile) £63,750 £65,000 £60,000
Median % change year-on-year -1.92% +8.33% -
75th Percentile £79,375 £83,750 £77,375
90th Percentile £101,250 £115,000 £92,585
UK median annual salary £65,000 £65,000 £65,000

All Software Libraries and Frameworks
Work from Home

Middleware falls under the Software Libraries and Frameworks category. For comparison with the information above, the following table provides summary statistics for all permanent job vacancies with remote or hybrid options requiring technical specification, industry standards, software libraries and framework skills.

Permanent vacancies with a requirement for technical specification, industry standards, software libraries and framework skills 3,931 8,983 14,504
As % of all permanent jobs with a WFH option 26.29% 26.55% 33.92%
Number of salaries quoted 3,184 7,517 10,899
10th Percentile £40,000 £38,900 £41,250
25th Percentile £51,250 £47,500 £50,927
Median annual salary (50th Percentile) £65,000 £60,000 £65,000
Median % change year-on-year +8.33% -7.69% +4.00%
75th Percentile £85,627 £79,500 £86,250
90th Percentile £114,694 £98,750 £102,500
UK median annual salary £65,000 £60,000 £67,500
% change year-on-year +8.33% -11.11% +8.00%

Middleware
Trend for Jobs with a WFH Option

Job vacancies with remote working options citing Middleware as a proportion of all IT jobs advertised.
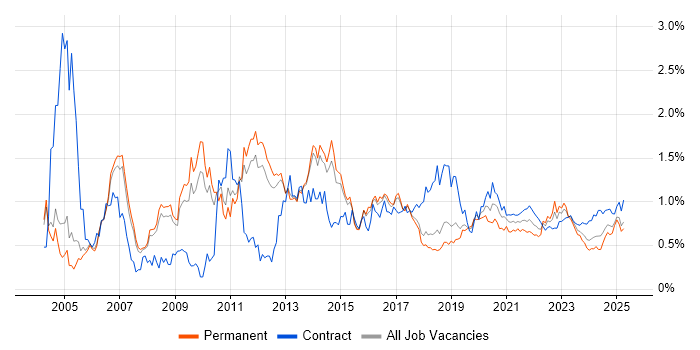
Middleware trend for jobs with Hybrid/Remote/WFH options

Middleware
Salary Trend for Jobs with a WFH Option

3-month moving average salary quoted in job vacancies with remote working options citing Middleware.

Middleware salary trend for jobs with a WFH option

Middleware
Salary Histogram for Jobs with a WFH Option

Salary distribution for jobs with remote working options citing Middleware over the 6 months to 1 May 2025.

Middleware salary histogram for jobs with a WFH option

Middleware
Co-occurring Skills and Capabilities with WFH Options by Category

The follow tables expand on the table above by listing co-occurrences grouped by category. The same employment type, locality and period is covered with up to 20 co-occurrences shown in each of the following categories:

Application Platforms
1 4 (3.51%) Apache
2 3 (2.63%) Confluence
2 3 (2.63%) GemFire
2 3 (2.63%) nginx
3 2 (1.75%) Tomcat
3 2 (1.75%) WebSphere
3 2 (1.75%) WebSphere Application Server
4 1 (0.88%) Apache Airflow
4 1 (0.88%) CMS
4 1 (0.88%) Drupal
4 1 (0.88%) Headless CMS
Business Applications
1 19 (16.67%) Oracle EBS
2 14 (12.28%) Oracle Applications
3 9 (7.89%) NetSuite
4 7 (6.14%) SAP S/4HANA
5 4 (3.51%) SAP HCM
6 1 (0.88%) Magento
Cloud Services
1 23 (20.18%) Azure
2 14 (12.28%) AWS
3 13 (11.40%) Boomi
4 11 (9.65%) GitHub
5 9 (7.89%) SaaS
6 8 (7.02%) GCP
7 4 (3.51%) Azure API Management
7 4 (3.51%) Power Platform
7 4 (3.51%) Zapier
8 3 (2.63%) Azure Synapse Analytics
9 2 (1.75%) GitHub Actions
10 1 (0.88%) Azure Data Factory
10 1 (0.88%) Azure Event Grid
10 1 (0.88%) Azure Logic Apps
10 1 (0.88%) Cloudflare
10 1 (0.88%) Contentful
10 1 (0.88%) dbt
10 1 (0.88%) Dynamics 365
10 1 (0.88%) Kong
10 1 (0.88%) Serverless
Communications & Networking
1 7 (6.14%) NAS
1 7 (6.14%) SAN
2 5 (4.39%) DHCP
2 5 (4.39%) DNS
2 5 (4.39%) VSAN
3 2 (1.75%) Cisco Nexus
3 2 (1.75%) FCoE
3 2 (1.75%) Fibre Channel
3 2 (1.75%) Firewall
3 2 (1.75%) HTTP
3 2 (1.75%) iSCSI
3 2 (1.75%) LAN
3 2 (1.75%) Multicast
3 2 (1.75%) SSL
3 2 (1.75%) VPN
3 2 (1.75%) WAN
4 1 (0.88%) Kerberos
4 1 (0.88%) SSH
Database & Business Intelligence
1 14 (12.28%) Relational Database
2 12 (10.53%) SQL Server
3 11 (9.65%) PostgreSQL
4 8 (7.02%) MongoDB
5 5 (4.39%) NoSQL
5 5 (4.39%) Oracle Database
5 5 (4.39%) RDBMS
5 5 (4.39%) Redis
6 4 (3.51%) MySQL
6 4 (3.51%) Oracle Exadata
6 4 (3.51%) Power BI
6 4 (3.51%) Tableau
7 3 (2.63%) Apache Ignite
7 3 (2.63%) InterSystems Cache
8 1 (0.88%) Azure SQL Database
8 1 (0.88%) BigQuery
8 1 (0.88%) Data Lake
8 1 (0.88%) Data Warehouse
8 1 (0.88%) SQL Server Integration Services
Development Applications
1 20 (17.54%) Git
2 14 (12.28%) JIRA
3 5 (4.39%) Oracle Forms
4 4 (3.51%) Mocha
5 2 (1.75%) Jenkins
5 2 (1.75%) Sonatype Nexus
6 1 (0.88%) Crucible
6 1 (0.88%) Rational Rhapsody
6 1 (0.88%) Team Foundation Server
6 1 (0.88%) Visual Studio
General
1 33 (28.95%) Inclusion and Diversity
2 32 (28.07%) Social Skills
3 21 (18.42%) Finance
4 19 (16.67%) Banking
5 14 (12.28%) Analytical Skills
6 9 (7.89%) Law
7 6 (5.26%) Front Office
8 5 (4.39%) Police
8 5 (4.39%) Public Sector
9 2 (1.75%) Investment Banking
9 2 (1.75%) Legal
9 2 (1.75%) Manufacturing
10 1 (0.88%) Advertising
10 1 (0.88%) Back Office
10 1 (0.88%) French Language
10 1 (0.88%) Local Government
Job Titles
1 46 (40.35%) Developer
2 17 (14.91%) Senior
3 15 (13.16%) Senior Developer
4 14 (12.28%) Lead
5 11 (9.65%) Java Developer
6 10 (8.77%) Applications Support
7 9 (7.89%) NetSuite Developer
7 9 (7.89%) Technical Developer
8 8 (7.02%) Applications Engineer
8 8 (7.02%) Applications Support Engineer
8 8 (7.02%) Architect
8 8 (7.02%) Software Engineer
8 8 (7.02%) Support Engineer
9 6 (5.26%) C# Developer
9 6 (5.26%) Data Manager
9 6 (5.26%) Integration Developer
9 6 (5.26%) Resilience Manager
10 5 (4.39%) Automation Engineer
10 5 (4.39%) Cloud Infrastructure Engineer
10 5 (4.39%) Full-Stack Developer
Libraries, Frameworks & Software Standards
1 20 (17.54%) REST
2 18 (15.79%) Oracle Fusion
3 15 (13.16%) .NET
4 14 (12.28%) Web Services
4 14 (12.28%) XML
5 13 (11.40%) OAuth
5 13 (11.40%) SAML
6 9 (7.89%) CSS
6 9 (7.89%) HTML
6 9 (7.89%) Node.js
6 9 (7.89%) Restlet
7 7 (6.14%) FIX Protocol
8 6 (5.26%) GraphQL
8 6 (5.26%) SOAP
8 6 (5.26%) WebSockets
9 5 (4.39%) J2EE
9 5 (4.39%) Jest
9 5 (4.39%) JPA
9 5 (4.39%) React
9 5 (4.39%) Vaadin
Miscellaneous
1 10 (8.77%) Hybrid Cloud
2 9 (7.89%) Algorithms
2 9 (7.89%) Data Structures
2 9 (7.89%) Virtual Team
3 7 (6.14%) Mobile App
4 6 (5.26%) Cyber Threat
5 5 (4.39%) Foreign Exchange (FX)
5 5 (4.39%) Product Ownership
5 5 (4.39%) Robotics
6 4 (3.51%) Enterprise Software
6 4 (3.51%) Management Information System
7 3 (2.63%) Credit Derivative
7 3 (2.63%) Derivative
7 3 (2.63%) Equities
7 3 (2.63%) Fixed Income
7 3 (2.63%) Legacy Systems
8 2 (1.75%) Clustering
8 2 (1.75%) Greenfield Project
8 2 (1.75%) Life Science
8 2 (1.75%) Replication
Operating Systems
1 33 (28.95%) Linux
2 16 (14.04%) Windows
3 7 (6.14%) Unix
4 6 (5.26%) Red Hat Enterprise Linux
5 5 (4.39%) Robot Operating System
5 5 (4.39%) Rocky
5 5 (4.39%) Windows Server
6 2 (1.75%) Solaris
7 1 (0.88%) Amazon Linux
7 1 (0.88%) Debian
Processes & Methodologies
1 39 (34.21%) Agile
2 38 (33.33%) Problem-Solving
3 20 (17.54%) Collaborative Working
3 20 (17.54%) Continuous Integration
4 17 (14.91%) CI/CD
4 17 (14.91%) User Experience
5 15 (13.16%) Mentoring
5 15 (13.16%) Performance Optimisation
6 14 (12.28%) Data Management
6 14 (12.28%) Strategic Thinking
7 13 (11.40%) Migration
8 12 (10.53%) Disaster Recovery
8 12 (10.53%) OO
8 12 (10.53%) OOP
9 11 (9.65%) Data Modelling
9 11 (9.65%) Fintech
9 11 (9.65%) Project Management
9 11 (9.65%) Unit Testing
9 11 (9.65%) Vulnerability Remediation
10 10 (8.77%) Cost Reduction
Programming Languages
1 49 (42.98%) SQL
2 26 (22.81%) JavaScript
3 23 (20.18%) Java
4 22 (19.30%) Python
5 13 (11.40%) C#
5 13 (11.40%) C++
6 7 (6.14%) PowerShell
7 6 (5.26%) C
8 5 (4.39%) Bash
8 5 (4.39%) TypeScript
9 4 (3.51%) PL/SQL
9 4 (3.51%) Shell Script
10 1 (0.88%) Apex Code
10 1 (0.88%) PHP
Qualifications
1 17 (14.91%) Degree
2 12 (10.53%) Security Cleared
3 6 (5.26%) Master's Degree
4 5 (4.39%) Azure Certification
4 5 (4.39%) DV Cleared
4 5 (4.39%) Microsoft Certification
4 5 (4.39%) VMware Certified Professional (VCP)
5 4 (3.51%) OCA
5 4 (3.51%) OCP
5 4 (3.51%) Oracle Certification
6 3 (2.63%) SC Cleared
7 2 (1.75%) Computer Science Degree
7 2 (1.75%) SAP Certification
8 1 (0.88%) PMI Certification
Quality Assurance & Compliance
1 8 (7.02%) Accessibility
2 4 (3.51%) QA
3 3 (2.63%) HL7
4 2 (1.75%) Data Quality
4 2 (1.75%) GDPR
4 2 (1.75%) ISO/IEC 27001
5 1 (0.88%) Cyber Essentials
5 1 (0.88%) DICOM
5 1 (0.88%) PMO
System Software
1 10 (8.77%) Docker
2 5 (4.39%) VMware ESXi
2 5 (4.39%) VMware NSX
3 2 (1.75%) Active Directory
3 2 (1.75%) Firmware
3 2 (1.75%) Hyper-V
3 2 (1.75%) KVM
3 2 (1.75%) NFS
3 2 (1.75%) SRDF
3 2 (1.75%) Veritas Cluster Server
3 2 (1.75%) VMware Infrastructure
3 2 (1.75%) Xen
Systems Management
1 9 (7.89%) Kubernetes
1 9 (7.89%) Single Sign-On
2 7 (6.14%) Ansible
2 7 (6.14%) Terraform
3 5 (4.39%) Progress Chef
4 4 (3.51%) Oracle RMAN
5 2 (1.75%) HAProxy
5 2 (1.75%) Puppet
Vendors
1 30 (26.32%) Oracle
2 18 (15.79%) ServiceNow
3 13 (11.40%) Microsoft
4 12 (10.53%) SAP
4 12 (10.53%) VMware
5 11 (9.65%) MuleSoft
6 8 (7.02%) Google
7 6 (5.26%) Red Hat
7 6 (5.26%) Salesforce
8 4 (3.51%) Dell
8 4 (3.51%) DocuSign
9 3 (2.63%) Databricks
9 3 (2.63%) IBM
9 3 (2.63%) Solace
9 3 (2.63%) TIBCO
10 2 (1.75%) Cisco
10 2 (1.75%) EMC
10 2 (1.75%) F5
10 2 (1.75%) NetApp
10 2 (1.75%) Trayport