Senior Contracts with Hybrid/Remote/WFH Options

Senior
UK > Work from Home

The median Senior daily rate for remote or hybrid work is £550, according to job vacancies posted in the 6 months leading up to 8 May 2025.

The table below provides contractor rate benchmarking and summary statistics, comparing them to the same period in the previous two years.

6 months to
8 May 2025
Same period 2024 Same period 2023
Rank 21 18 19
Rank change year-on-year -3 +1 +1
Contract jobs requiring a Senior 866 1,325 2,077
As % of all contract jobs with a WFH option 8.86% 8.76% 8.20%
As % of the Job Titles category 9.45% 9.36% 8.60%
Number of daily rates quoted 603 907 1,468
10th Percentile £400 £411 £413
25th Percentile £456 £475 £475
Median daily rate (50th Percentile) £550 £575 £575
Median % change year-on-year -4.35% - +4.55%
75th Percentile £675 £675 £686
90th Percentile £800 £800 £788
UK median daily rate £550 £560 £590
% change year-on-year -1.79% -5.08% +2.61%
Number of hourly rates quoted 11 51 42
10th Percentile £26.32 £24.00 £40.15
25th Percentile £35.75 £35.89 £42.50
Median hourly rate £55.00 £44.74 £45.00
Median % change year-on-year +22.93% -0.58% -2.70%
75th Percentile £58.25 £62.50 £67.50
90th Percentile £67.50 £72.50 £68.75
UK median hourly rate £52.75 £47.50 £49.50
% change year-on-year +11.05% -4.04% +31.99%

All Contract IT Job Vacancies
Work from Home

For comparison with the information above, the following table provides summary statistics for all contract IT job vacancies with WFH or hybrid options. Most job vacancies include a discernible job title that can be normalized. As such, the figures in the second row provide an indication of the number of contract jobs in our overall sample.

Contract vacancies in Work from Home with a recognized job title 9,168 14,152 24,153
% of contract IT jobs with a recognized job title 93.83% 93.54% 95.32%
Number of daily rates quoted 6,276 9,490 17,046
10th Percentile £337 £325 £359
25th Percentile £413 £425 £444
Median daily rate (50th Percentile) £523 £525 £538
Median % change year-on-year -0.48% -2.33% +2.38%
75th Percentile £638 £638 £650
90th Percentile £775 £750 £750
UK median daily rate £513 £525 £540
% change year-on-year -2.38% -2.78% +2.86%
Number of hourly rates quoted 220 575 555
10th Percentile £14.00 £14.27 £17.71
25th Percentile £17.51 £23.39 £25.73
Median hourly rate £35.00 £44.00 £54.00
Median % change year-on-year -20.45% -18.52% +54.29%
75th Percentile £65.25 £63.00 £68.75
90th Percentile £75.00 £75.25 £80.25
UK median hourly rate £28.75 £36.50 £45.00
% change year-on-year -21.23% -18.89% +90.68%

Senior
Trend for Jobs with a WFH Option

Job vacancies with remote working options which featured Senior in the job title as a proportion of all IT jobs advertised.
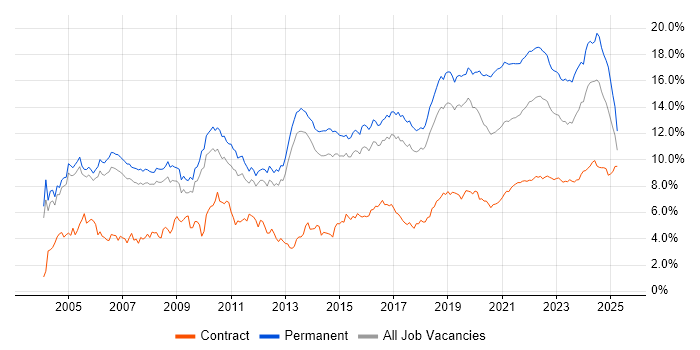
Senior trend for jobs with Hybrid/Remote/WFH options

Senior
Daily Rate Trend for Jobs with a WFH Option

3-month moving average daily rate quoted in job vacancies with remote working options citing Senior.

Senior daily rate for jobs with a WFH option

Senior
Daily Rate Histogram for Jobs with a WFH Option

Daily rate distribution for jobs with remote working options citing Senior over the 6 months to 8 May 2025.

Senior daily rate histogram for jobs with a WFH option

Senior
Hourly Rate Trend for Jobs with a WFH Option

3-month moving average hourly rate quoted in job vacancies with remote working options citing Senior.

Senior hourly rate for jobs with a WFH option

Senior
Hourly Rate Histogram for Jobs with a WFH Option

Hourly rate distribution for jobs with remote working options citing Senior over the 6 months to 8 May 2025.

Senior hourly rate histogram for jobs with a WFH option

Senior Skill Set
Top 30 Co-occurring Skills and Capabilities in Job Vacancies with WFH Options

For the 6 months to 8 May 2025, Senior contract job roles required the following skills and capabilities in order of popularity. The figures indicate the absolute number co-occurrences and as a proportion of all contract jobs with a WFH option featuring Senior in the job title.

1 248 (28.64%) Social Skills
2 247 (28.52%) Agile
3 209 (24.13%) AWS
4 205 (23.67%) Finance
5 200 (23.09%) Python
6 176 (20.32%) Azure
7 167 (19.28%) SQL
8 166 (19.17%) DevOps
9 162 (18.71%) Security Cleared
10 160 (18.48%) CI/CD
11 158 (18.24%) Problem-Solving
12 129 (14.90%) SC Cleared
13 122 (14.09%) Banking
14 118 (13.63%) Java
15 112 (12.93%) Docker
16 110 (12.70%) Kubernetes
17 105 (12.12%) Analytical Skills
18 102 (11.78%) Linux
18 102 (11.78%) Software Engineering
19 99 (11.43%) JavaScript
20 98 (11.32%) Public Sector
21 93 (10.74%) Terraform
22 88 (10.16%) TypeScript
23 82 (9.47%) Containerisation
23 82 (9.47%) Microsoft
24 77 (8.89%) Stakeholder Management
24 77 (8.89%) Infrastructure as Code
25 73 (8.43%) Analytics
26 67 (7.74%) Migration
26 67 (7.74%) Investment Banking

Senior Skill Set
Co-occurring Skills and Capabilities with WFH Options by Category

The follow tables expand on the table above by listing co-occurrences grouped by category. The same employment type, locality and period is covered with up to 20 co-occurrences shown in each of the following categories:

Application Platforms
1 29 (3.35%) Apache
2 27 (3.12%) Apache Airflow
3 19 (2.19%) SharePoint
4 16 (1.85%) Moodle
5 15 (1.73%) Confluence
6 10 (1.15%) Microsoft Exchange
7 9 (1.04%) Apache Spark
8 8 (0.92%) GemFire
8 8 (0.92%) Oracle Coherence
9 5 (0.58%) CMS
10 4 (0.46%) nginx
10 4 (0.46%) OpenStack
11 3 (0.35%) Headless CMS
11 3 (0.35%) Traefik
12 2 (0.23%) CICS
12 2 (0.23%) JBoss
12 2 (0.23%) Jupyter
12 2 (0.23%) Umbraco
12 2 (0.23%) WebLogic
13 1 (0.12%) WebSphere Application Server
Applications
1 18 (2.08%) Microsoft Excel
2 12 (1.39%) Microsoft Office
3 8 (0.92%) Microsoft Project
4 5 (0.58%) Microsoft PowerPoint
5 4 (0.46%) Spreadsheet
5 4 (0.46%) Trello
6 2 (0.23%) Adobe After Effects
6 2 (0.23%) Adobe Illustrator
6 2 (0.23%) Photoshop
6 2 (0.23%) Sketch
7 1 (0.12%) Adobe Creative Suite
7 1 (0.12%) Adobe Premiere
7 1 (0.12%) Adobe XD
7 1 (0.12%) CINEMA 4D
7 1 (0.12%) Final Cut Pro
7 1 (0.12%) InVision
7 1 (0.12%) MadCap Flare
7 1 (0.12%) MS Visio
7 1 (0.12%) Notion
7 1 (0.12%) Windchill
Business Applications
1 11 (1.27%) SAP S/4HANA
2 4 (0.46%) Payment Gateway
3 3 (0.35%) SAP CO
3 3 (0.35%) SAP FI
3 3 (0.35%) SAP LE
4 2 (0.23%) Dynamics CRM
4 2 (0.23%) NEC Housing
4 2 (0.23%) OPENHousing
4 2 (0.23%) Primavera
4 2 (0.23%) SAP SD
4 2 (0.23%) Workday HCM
5 1 (0.12%) Aladdin
5 1 (0.12%) Endur
5 1 (0.12%) OpenText VIM for SAP
5 1 (0.12%) Oracle ERP
5 1 (0.12%) R3 Corda
5 1 (0.12%) SAP CS
5 1 (0.12%) SAP IBP
5 1 (0.12%) SAP MM
5 1 (0.12%) Unit4 Business World
Cloud Services
1 209 (24.13%) AWS
2 176 (20.32%) Azure
3 51 (5.89%) Power Platform
4 45 (5.20%) GCP
5 43 (4.97%) Serverless
6 40 (4.62%) dbt
7 38 (4.39%) Azure DevOps
8 37 (4.27%) AWS CloudFormation
8 37 (4.27%) GitHub
9 36 (4.16%) Amazon EC2
9 36 (4.16%) Snowflake
10 34 (3.93%) AWS Lambda
11 31 (3.58%) Entra ID
12 29 (3.35%) Microsoft 365
13 28 (3.23%) Amazon ECS
14 27 (3.12%) SaaS
15 26 (3.00%) Amazon EKS
16 20 (2.31%) Amazon S3
17 18 (2.08%) GitHub Actions
18 17 (1.96%) Amazon SQS
Communications & Networking
1 35 (4.04%) Firewall
2 24 (2.77%) DNS
2 24 (2.77%) TCP/IP
3 20 (2.31%) WAN
4 19 (2.19%) Network Security
4 19 (2.19%) VPN
5 18 (2.08%) HTTP
6 17 (1.96%) Internet
7 14 (1.62%) LAN
8 13 (1.50%) SD-WAN
9 12 (1.39%) BGP
10 11 (1.27%) Wireless
11 9 (1.04%) DHCP
11 9 (1.04%) OSPF
11 9 (1.04%) Wi-Fi
12 8 (0.92%) 4G
13 7 (0.81%) MPLS
14 5 (0.58%) Cisco Nexus
14 5 (0.58%) Ethernet
15 4 (0.46%) Radio Access Network
Database & Business Intelligence
1 41 (4.73%) PostgreSQL
1 41 (4.73%) Power BI
2 36 (4.16%) Relational Database
3 34 (3.93%) MongoDB
4 32 (3.70%) Data Lake
5 31 (3.58%) SQL Server
6 29 (3.35%) Amazon Athena
7 24 (2.77%) Apache Iceberg
7 24 (2.77%) Data Warehouse
8 23 (2.66%) Apache Arrow
8 23 (2.66%) Apache Ignite
8 23 (2.66%) Dremio
9 20 (2.31%) Amazon RDS
10 18 (2.08%) MySQL
11 13 (1.50%) DB2
11 13 (1.50%) NoSQL
12 12 (1.39%) Azure SQL Database
12 12 (1.39%) KDB
12 12 (1.39%) Kdb+
13 10 (1.15%) Big Data
Development Applications
1 65 (7.51%) Jenkins
2 48 (5.54%) Git
3 46 (5.31%) GitLab
4 41 (4.73%) JIRA
5 25 (2.89%) JUnit
6 15 (1.73%) Postman
7 14 (1.62%) Cypress.io
8 10 (1.15%) Cucumber
8 10 (1.15%) Gradle
9 8 (0.92%) Mockito
10 7 (0.81%) Bitbucket
10 7 (0.81%) CircleCI
10 7 (0.81%) REST Assured
11 6 (0.69%) Jasmine
11 6 (0.69%) Liquibase
11 6 (0.69%) PHPUnit
11 6 (0.69%) Selenium
11 6 (0.69%) webpack
12 5 (0.58%) SoapUI
12 5 (0.58%) Team Foundation Server
General
1 248 (28.64%) Social Skills
2 205 (23.67%) Finance
3 122 (14.09%) Banking
4 105 (12.12%) Analytical Skills
5 98 (11.32%) Public Sector
6 67 (7.74%) Investment Banking
7 50 (5.77%) Front Office
8 27 (3.12%) Retail
9 25 (2.89%) Marketing
10 21 (2.42%) Telecoms
11 17 (1.96%) Inclusion and Diversity
11 17 (1.96%) Presentation Skills
12 15 (1.73%) Manufacturing
13 12 (1.39%) Legal
14 11 (1.27%) Electronics
14 11 (1.27%) Local Government
15 9 (1.04%) Military
15 9 (1.04%) Organisational Skills
16 8 (0.92%) Law
17 7 (0.81%) Games
Libraries, Frameworks & Software Standards
1 62 (7.16%) React
2 52 (6.00%) Kafka
3 42 (4.85%) .NET
3 42 (4.85%) Node.js
4 33 (3.81%) RESTful
4 33 (3.81%) Spring
5 28 (3.23%) Pandas
6 27 (3.12%) CSS
7 26 (3.00%) NumPy
8 25 (2.89%) AngularJS
9 24 (2.77%) gRPC
10 23 (2.66%) Protocol Buffers
10 23 (2.66%) SciPy
11 21 (2.42%) Web Services
12 20 (2.31%) HTML
13 19 (2.19%) Spring Boot
14 17 (1.96%) .NET Core
14 17 (1.96%) ASP.NET
14 17 (1.96%) REST
14 17 (1.96%) Swagger
Miscellaneous
1 38 (4.39%) Equities
2 37 (4.27%) Foreign Exchange (FX)
3 34 (3.93%) Derivative
4 28 (3.23%) Cloud Native
5 27 (3.12%) Fixed Income
5 27 (3.12%) Product Ownership
6 25 (2.89%) Hedge funds
7 21 (2.42%) Data Centre
8 20 (2.31%) Self-Motivation
9 18 (2.08%) Data Structures
10 15 (1.73%) Greenfield Project
10 15 (1.73%) Management Information System
11 14 (1.62%) Enterprise Software
11 14 (1.62%) Mobile App
11 14 (1.62%) Onboarding
11 14 (1.62%) Pricing Data
12 12 (1.39%) PKI
13 9 (1.04%) Data Protection Act
14 8 (0.92%) Enterprise Storage
14 8 (0.92%) Market Risk
Operating Systems
1 102 (11.78%) Linux
2 66 (7.62%) Windows
3 25 (2.89%) Red Hat Enterprise Linux
4 23 (2.66%) Unix
5 18 (2.08%) Android
5 18 (2.08%) Windows Server
6 10 (1.15%) CentOS
7 9 (1.04%) Apple iOS
8 5 (0.58%) Windows 10
8 5 (0.58%) Windows Server 2012
9 2 (0.23%) Mac OS
9 2 (0.23%) SUSE
9 2 (0.23%) Windows Server 2019
10 1 (0.12%) AIX
10 1 (0.12%) FreeRTOS
10 1 (0.12%) Kali Linux
10 1 (0.12%) Solaris
Processes & Methodologies
1 247 (28.52%) Agile
2 166 (19.17%) DevOps
3 160 (18.48%) CI/CD
4 158 (18.24%) Problem-Solving
5 102 (11.78%) Software Engineering
6 82 (9.47%) Containerisation
7 77 (8.89%) Infrastructure as Code
7 77 (8.89%) Stakeholder Management
8 73 (8.43%) Analytics
9 67 (7.74%) Migration
10 65 (7.51%) Mentoring
11 60 (6.93%) Project Management
12 57 (6.58%) Microservices
13 53 (6.12%) Business Intelligence
13 53 (6.12%) Test Automation
14 46 (5.31%) Scrum
14 46 (5.31%) SDLC
15 45 (5.20%) Data Modelling
16 43 (4.97%) Continuous Integration
16 43 (4.97%) TDD
Programming Languages
1 200 (23.09%) Python
2 167 (19.28%) SQL
3 118 (13.63%) Java
4 99 (11.43%) JavaScript
5 88 (10.16%) TypeScript
6 53 (6.12%) Bash
7 48 (5.54%) PowerShell
8 45 (5.20%) C#
9 25 (2.89%) C++
10 21 (2.42%) Go
11 18 (2.08%) Shell Script
12 13 (1.50%) Kotlin
13 10 (1.15%) C
14 8 (0.92%) T-SQL
15 7 (0.81%) Bicep
15 7 (0.81%) PHP
16 6 (0.69%) R
16 6 (0.69%) VBA
17 5 (0.58%) Ruby
18 4 (0.46%) Scala
Qualifications
1 162 (18.71%) Security Cleared
2 129 (14.90%) SC Cleared
3 65 (7.51%) Degree
4 26 (3.00%) Computer Science Degree
5 19 (2.19%) CISM
6 17 (1.96%) AWS Certification
7 16 (1.85%) DV Cleared
8 15 (1.73%) Cisco Certification
9 14 (1.62%) CISSP
10 13 (1.50%) BPSS Clearance
10 13 (1.50%) CCNP
11 12 (1.39%) Microsoft Certification
12 9 (1.04%) Master's Degree
12 9 (1.04%) Numerate Degree
13 7 (0.81%) MCSE
14 6 (0.69%) Azure Certification
14 6 (0.69%) ITIL Certification
14 6 (0.69%) PhD
15 5 (0.58%) AWS Certified Solutions Architect
15 5 (0.58%) DBS Check
Quality Assurance & Compliance
1 26 (3.00%) QA
2 19 (2.19%) Accessibility
3 12 (1.39%) Data Quality
3 12 (1.39%) NCSC
4 11 (1.27%) ISO/IEC 27001
5 8 (0.92%) GDPR
5 8 (0.92%) PMO
6 7 (0.81%) NIST
7 6 (0.69%) Disclosure Scotland
8 5 (0.58%) Sarbanes-Oxley
9 4 (0.46%) Actionable Recommendations
9 4 (0.46%) Cyber Essentials
10 3 (0.35%) Basel II
10 3 (0.35%) GRC
10 3 (0.35%) ISO/IEC 27005
10 3 (0.35%) SOC 2
11 2 (0.23%) Government Security Classifications
11 2 (0.23%) NIST 800
11 2 (0.23%) WCAG
12 1 (0.12%) IFRS
System Software
1 112 (12.93%) Docker
2 29 (3.35%) Active Directory
3 8 (0.92%) GridGain
3 8 (0.92%) VMware Infrastructure
4 7 (0.81%) Firmware
5 5 (0.58%) Virtual Machines
6 3 (0.35%) Hyper-V
6 3 (0.35%) VMware NSX
7 2 (0.23%) Embedded Firmware
8 1 (0.12%) Apache ZooKeeper
8 1 (0.12%) KVM
8 1 (0.12%) Oracle RAC
8 1 (0.12%) Platform Symphony
8 1 (0.12%) QEMU
8 1 (0.12%) Tivoli Workload Scheduler
8 1 (0.12%) vSphere
8 1 (0.12%) Xen
Systems Management
1 110 (12.70%) Kubernetes
2 93 (10.74%) Terraform
3 60 (6.93%) Ansible
4 30 (3.46%) Grafana
5 26 (3.00%) Prometheus
6 19 (2.19%) Puppet
7 14 (1.62%) Progress Chef
8 10 (1.15%) Packer
9 7 (0.81%) Consul
9 7 (0.81%) FortiGate
9 7 (0.81%) Istio
9 7 (0.81%) Jamf Pro
9 7 (0.81%) Microsoft Intune
9 7 (0.81%) Single Sign-On
10 6 (0.69%) Argo
10 6 (0.69%) linkerd
10 6 (0.69%) Rancher
11 5 (0.58%) SCCM
11 5 (0.58%) WSUS
11 5 (0.58%) ZABBIX
Vendors
1 82 (9.47%) Microsoft
2 41 (4.73%) SAP
3 24 (2.77%) Cisco
3 24 (2.77%) Oracle
4 21 (2.42%) ServiceNow
5 19 (2.19%) Databricks
6 18 (2.08%) Google
7 17 (1.96%) Red Hat
7 17 (1.96%) VMware
8 13 (1.50%) Dynatrace
8 13 (1.50%) Okta
9 12 (1.39%) Palo Alto
9 12 (1.39%) Splunk
9 12 (1.39%) Sybase
10 11 (1.27%) Adobe
11 8 (0.92%) Citrix
11 8 (0.92%) IBM
11 8 (0.92%) New Relic
12 7 (0.81%) Apple
12 7 (0.81%) Juniper