Billing Jobs in England

Billing
UK > England

The table below looks at the prevalence of the term Billing in permanent job vacancies advertised in England. Included is a benchmarking guide to the salaries offered in vacancies that have cited Billing over the 6 months to 27 April 2024 with a comparison to the same period over the previous 2 years.

6 months to
27 Apr 2024
Same period 2023 Same period 2022
Rank 374 617 712
Rank change year-on-year +243 +95 -121
Permanent jobs citing Billing 589 356 466
As % of all permanent jobs advertised in England 0.69% 0.38% 0.36%
As % of the General category 1.17% 0.56% 0.56%
Number of salaries quoted 304 151 239
10th Percentile - £26,250 £31,000
25th Percentile £24,500 £41,250 £42,500
Median annual salary (50th Percentile) £33,500 £60,000 £57,500
Median % change year-on-year -44.17% +4.35% +9.00%
75th Percentile £62,500 £88,750 £72,573
90th Percentile £80,000 £111,250 £89,000
UK median annual salary £34,000 £56,250 £58,250
% change year-on-year -39.56% -3.43% +5.91%

All General Skills
England

Billing is in the General Skills category. The following table is for comparison with the above and provides summary statistics for all permanent job vacancies advertised in England with a requirement for common skills.

Permanent vacancies with a requirement for common skills 50,259 64,087 82,968
As % of all permanent jobs advertised in England 59.26% 68.74% 63.47%
Number of salaries quoted 35,481 34,591 45,074
10th Percentile £27,445 £32,500 £32,500
25th Percentile £36,250 £44,000 £43,000
Median annual salary (50th Percentile) £52,500 £60,249 £60,000
Median % change year-on-year -12.86% +0.42% +4.35%
75th Percentile £72,500 £83,750 £80,000
90th Percentile £93,750 £103,750 £100,000
UK median annual salary £52,500 £60,000 £60,000
% change year-on-year -12.50% - +9.09%

Billing
Job Vacancy Trend in England

Job postings citing Billing as a proportion of all IT jobs advertised in England.
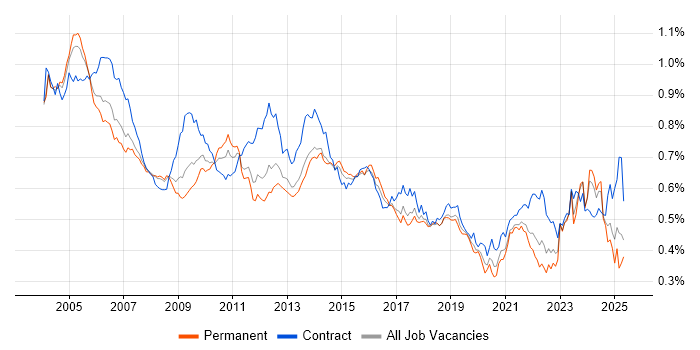
Job vacancy trend for Billing in England

Billing
Salary Trend in England

3-month moving average salary quoted in jobs citing Billing in England.

Salary trend for Billing in England

Billing
Salary Histogram in England

Salary distribution for jobs citing Billing in England over the 6 months to 27 April 2024.

Salary histogram for Billing in England

Billing
Job Locations in England

The table below looks at the demand and provides a guide to the median salaries quoted in IT jobs citing Billing within the England region over the 6 months to 27 April 2024. The 'Rank Change' column provides an indication of the change in demand within each location based on the same 6 month period last year.

Location Rank Change
on Same Period
Last Year
Matching
Permanent
IT Job Ads
Median Salary
Past 6 Months
Median Salary
% Change
on Same Period
Last Year
Live
Jobs
South East +121 198 £25,000 -41.18% 27
London +127 150 £65,000 -18.75% 84
North of England +95 87 £26,500 -47.00% 29
Midlands +46 68 £52,500 - 16
North West +52 56 £25,500 -51.43% 21
South West +43 54 £24,077 -12.45% 11
East Midlands +6 39 £33,250 -36.67% 3
West Midlands +45 29 £58,750 -2.08% 13
Yorkshire +94 26 £64,941 +63.37% 6
East of England +7 26 £50,000 -37.50% 11
North East +1 5 £26,500 -70.96% 2
Billing
UK

Billing
Co-occurring Skills and Capabilities in England by Category

The follow tables expand on the table above by listing co-occurrences grouped by category. The same employment type, locality and period is covered with up to 20 co-occurrences shown in each of the following categories:

Application Platforms
1 7 (1.19%) SharePoint
2 1 (0.17%) Oracle Workflow
2 1 (0.17%) SAS
Applications
1 83 (14.09%) Microsoft Excel
2 35 (5.94%) Microsoft Office
3 17 (2.89%) Microsoft PowerPoint
4 4 (0.68%) MS Visio
4 4 (0.68%) Spreadsheet
5 2 (0.34%) Trello
Business Applications
1 11 (1.87%) NetSuite
2 5 (0.85%) Oracle Assets
2 5 (0.85%) Oracle General Ledger
2 5 (0.85%) Oracle iProcurement
2 5 (0.85%) Oracle Payables
2 5 (0.85%) SAP S/4HANA
3 4 (0.68%) Dynamics CRM
3 4 (0.68%) Elite 3E
3 4 (0.68%) Oracle E-Business Tax
3 4 (0.68%) SAP IS-U
4 3 (0.51%) Oracle AGIS
4 3 (0.51%) Oracle Financials
5 2 (0.34%) Carpe Diem
5 2 (0.34%) Oracle EBS R12
5 2 (0.34%) Oracle ERP
5 2 (0.34%) Oracle Receivables
5 2 (0.34%) SAP BPC
5 2 (0.34%) SAP FSCM
5 2 (0.34%) SAP MDG
5 2 (0.34%) SAP SD
Cloud Services
1 100 (16.98%) Azure
2 78 (13.24%) AWS
3 66 (11.21%) Azure DevOps
4 65 (11.04%) GCP
5 28 (4.75%) Microsoft 365
6 21 (3.57%) Power Platform
7 13 (2.21%) Serverless
8 6 (1.02%) Matillion
8 6 (1.02%) SaaS
8 6 (1.02%) Snowflake
8 6 (1.02%) Twilio
9 5 (0.85%) Amazon SQS
9 5 (0.85%) AWS Lambda
9 5 (0.85%) AWS Step Functions
10 4 (0.68%) GitHub
11 2 (0.34%) Adobe Creative Cloud
11 2 (0.34%) Figma
11 2 (0.34%) Salesforce Sales Cloud
11 2 (0.34%) WhatsApp
12 1 (0.17%) Salesforce Service Cloud
Communications & Networking
1 26 (4.41%) Internet
2 19 (3.23%) Broadband
3 18 (3.06%) Firewall
4 17 (2.89%) VPN
5 16 (2.72%) VLAN
6 14 (2.38%) SAN
7 8 (1.36%) VoIP
8 6 (1.02%) PBX
9 5 (0.85%) LAN
10 2 (0.34%) BGP
10 2 (0.34%) DHCP
10 2 (0.34%) EIGRP
10 2 (0.34%) Ethernet
10 2 (0.34%) FTP
10 2 (0.34%) HTTPS
10 2 (0.34%) Intranet
10 2 (0.34%) MPLS
10 2 (0.34%) OSPF
10 2 (0.34%) SNMP
10 2 (0.34%) WAN
Database & Business Intelligence
1 66 (11.21%) BigQuery
1 66 (11.21%) Data Warehouse
1 66 (11.21%) Looker
2 22 (3.74%) SQL Server
3 21 (3.57%) Power BI
4 13 (2.21%) Data Lake
4 13 (2.21%) SQL Server Reporting Services
5 12 (2.04%) SQL Server Integration Services
6 7 (1.19%) Metadata
7 6 (1.02%) NoSQL
7 6 (1.02%) Qlik Sense
8 5 (0.85%) DynamoDB
8 5 (0.85%) QlikView
9 4 (0.68%) Tableau
10 3 (0.51%) Oracle Reports
11 2 (0.34%) MySQL
12 1 (0.17%) Data Vault
12 1 (0.17%) EDRMS
Development Applications
1 12 (2.04%) JIRA
2 3 (0.51%) Selenium
3 2 (0.34%) Git
3 2 (0.34%) LSMW
3 2 (0.34%) Vite
4 1 (0.17%) Toad
4 1 (0.17%) Visual Studio
General
1 331 (56.20%) Social Skills
2 267 (45.33%) Finance
3 127 (21.56%) Analytical Skills
4 113 (19.19%) Inclusion and Diversity
5 66 (11.21%) Presentation Skills
6 57 (9.68%) Retail
7 47 (7.98%) Telecoms
8 38 (6.45%) Marketing
9 33 (5.60%) Local Government
9 33 (5.60%) Public Sector
10 21 (3.57%) Back Office
11 18 (3.06%) Law
12 16 (2.72%) Legal
12 16 (2.72%) Organisational Skills
13 15 (2.55%) Manufacturing
14 11 (1.87%) General Ledger
15 9 (1.53%) Banking
16 8 (1.36%) Front Office
16 8 (1.36%) Games
16 8 (1.36%) Influencing Skills
Job Titles
1 67 (11.38%) Data Manager
2 65 (11.04%) Engineering Manager
3 63 (10.70%) Audit Manager
4 49 (8.32%) Analyst
5 41 (6.96%) Quantity Surveyor
6 39 (6.62%) Project Manager
7 35 (5.94%) Senior
8 33 (5.60%) Architect
9 20 (3.40%) Developer
10 17 (2.89%) IT Manager
11 16 (2.72%) Systems Analyst
12 15 (2.55%) Administrator
12 15 (2.55%) Coordinator
13 14 (2.38%) Infrastructure Architect
14 13 (2.21%) Service Manager
15 12 (2.04%) Associate Director
15 12 (2.04%) Charles River Analyst
15 12 (2.04%) Lead
15 12 (2.04%) Senior Manager
16 11 (1.87%) Consultant
Libraries, Frameworks & Software Standards
1 8 (1.36%) Web Services
2 4 (0.68%) .NET
2 4 (0.68%) ASP.NET
2 4 (0.68%) React
2 4 (0.68%) Restlet
3 3 (0.51%) HTML
3 3 (0.51%) JSON
4 2 (0.34%) AWS CDK
4 2 (0.34%) CakePHP
4 2 (0.34%) CSS
4 2 (0.34%) Express.js
4 2 (0.34%) Laravel
4 2 (0.34%) Node.js
4 2 (0.34%) Playwright
4 2 (0.34%) Redux
4 2 (0.34%) REST
4 2 (0.34%) Ruby on Rails
4 2 (0.34%) Sass
4 2 (0.34%) Tailwind CSS
4 2 (0.34%) Vue
Miscellaneous
1 155 (26.32%) Self-Motivation
2 90 (15.28%) Video Conferencing
3 88 (14.94%) Digital Signage
3 88 (14.94%) Video\Live Streaming
4 67 (11.38%) Product Ownership
5 32 (5.43%) Housing Association
5 32 (5.43%) NHS
6 24 (4.07%) Data Centre
7 23 (3.90%) Management Information System
8 20 (3.40%) Reinsurance
9 16 (2.72%) Public Cloud
10 14 (2.38%) Hedge funds
10 14 (2.38%) Replication
11 13 (2.21%) Life Science
12 12 (2.04%) Fixed Income
13 7 (1.19%) Enterprise Software
13 7 (1.19%) Team-Oriented Environment
14 6 (1.02%) Blog
14 6 (1.02%) Onboarding
15 4 (0.68%) Renewable Energy
Operating Systems
1 21 (3.57%) Windows
2 19 (3.23%) Linux
3 14 (2.38%) SUSE
3 14 (2.38%) Ubuntu
3 14 (2.38%) Windows Server
3 14 (2.38%) Windows Server 2012
4 1 (0.17%) Red Hat Enterprise Linux
4 1 (0.17%) Unix
Processes & Methodologies
1 225 (38.20%) Problem-Solving
2 133 (22.58%) Customer Service
3 130 (22.07%) Project Management
4 123 (20.88%) Agile
5 109 (18.51%) Business Development
6 103 (17.49%) Presales
7 101 (17.15%) Logistics
8 91 (15.45%) Coaching
8 91 (15.45%) Service Management
9 88 (14.94%) Preventative Maintenance
10 84 (14.26%) Line Management
11 80 (13.58%) People Management
12 79 (13.41%) Scrum
13 78 (13.24%) Data Modelling
14 75 (12.73%) Business Strategy
14 75 (12.73%) Performance Management
15 72 (12.22%) ETL
16 69 (11.71%) DevOps
17 67 (11.38%) Backlog Management
17 67 (11.38%) CI/CD
Programming Languages
1 54 (9.17%) SQL
2 14 (2.38%) PowerShell
3 13 (2.21%) T-SQL
4 7 (1.19%) Java
4 7 (1.19%) JavaScript
5 6 (1.02%) Kotlin
6 4 (0.68%) ABAP
6 4 (0.68%) C#
6 4 (0.68%) Python
6 4 (0.68%) Shell Script
7 3 (0.51%) Perl
7 3 (0.51%) VBA
8 2 (0.34%) PHP
8 2 (0.34%) R
8 2 (0.34%) Ruby
8 2 (0.34%) TypeScript
9 1 (0.17%) Apex Code
9 1 (0.17%) C
9 1 (0.17%) PL/SQL
9 1 (0.17%) SOQL
Qualifications
1 135 (22.92%) ACCA
2 46 (7.81%) Degree
3 43 (7.30%) CIMA
4 26 (4.41%) Computer Science Degree
5 16 (2.72%) Microsoft Certification
6 14 (2.38%) MCSA
6 14 (2.38%) MCSE
6 14 (2.38%) VMware Certified Professional (VCP)
7 11 (1.87%) DBS Check
8 9 (1.53%) Security Cleared
9 4 (0.68%) SAP Certification
9 4 (0.68%) SC Cleared
10 2 (0.34%) Azure Certification
10 2 (0.34%) CCNP
10 2 (0.34%) Cisco Certification
10 2 (0.34%) Postgraduate
11 1 (0.17%) AAT
11 1 (0.17%) BPSS Clearance
11 1 (0.17%) ITIL Certification
Quality Assurance & Compliance
1 90 (15.28%) SLA
2 77 (13.07%) IFRS
3 76 (12.90%) GAAP
4 67 (11.38%) QA
5 11 (1.87%) GDPR
6 8 (1.36%) Data Quality
7 7 (1.19%) Accessibility
8 6 (1.02%) GMP
9 4 (0.68%) PMO
10 3 (0.51%) Sarbanes-Oxley
11 2 (0.34%) ISO/IEC 27001
System Software
1 20 (3.40%) Active Directory
2 14 (2.38%) vCloud
2 14 (2.38%) VMware Infrastructure
2 14 (2.38%) vSphere
3 2 (0.34%) Terminal Services
4 1 (0.17%) Virtual Machines
Systems Management
1 2 (0.34%) FortiGate
1 2 (0.34%) Microsoft Intune
1 2 (0.34%) SolarWinds Orion
Vendors
1 104 (17.66%) Microsoft
2 92 (15.62%) CA
3 66 (11.21%) Google
4 41 (6.96%) NEC
4 41 (6.96%) Virgin Media
5 18 (3.06%) Openreach
6 17 (2.89%) VMware
7 16 (2.72%) Salesforce
8 15 (2.55%) SAP
9 14 (2.38%) Fujitsu
9 14 (2.38%) HP
9 14 (2.38%) Veeam
10 12 (2.04%) Charles River
11 10 (1.70%) MuleSoft
11 10 (1.70%) ServiceNow
12 7 (1.19%) Oracle
13 6 (1.02%) Databricks
13 6 (1.02%) Mitel
13 6 (1.02%) Verint
14 5 (0.85%) Citrix