Product Ownership Jobs in London

Product Ownership
England > London

The table below looks at the prevalence of the term Product Ownership in permanent job vacancies in London. Included is a benchmarking guide to the salaries offered in vacancies that cited Product Ownership over the 6 months leading up to 30 May 2025, comparing them to the same period in the previous two years.

6 months to
30 May 2025
Same period 2024 Same period 2023
Rank 95 109 63
Rank change year-on-year +14 -46 -5
Permanent jobs citing Product Ownership 433 652 1,575
As % of all permanent jobs advertised in London 3.41% 2.72% 4.81%
As % of the Miscellaneous category 7.68% 6.75% 10.37%
Number of salaries quoted 208 483 1,044
10th Percentile £52,500 £47,500 £46,570
25th Percentile £60,000 £59,988 £56,250
Median annual salary (50th Percentile) £78,750 £75,450 £70,000
Median % change year-on-year +4.37% +7.79% -3.45%
75th Percentile £100,000 £95,000 £87,500
90th Percentile £124,000 £107,500 £108,375
England median annual salary £70,000 £62,500 £65,000
% change year-on-year +12.00% -3.85% +3.17%

All Generic Skills
London

Product Ownership falls under the General and Transferable Skills category. For comparison with the information above, the following table provides summary statistics for all permanent job vacancies requiring generic IT skills in London.

Permanent vacancies with a requirement for generic IT skills 5,640 9,664 15,186
As % of all permanent jobs advertised in London 44.44% 40.31% 46.33%
Number of salaries quoted 3,014 6,778 10,288
10th Percentile £41,250 £37,500 £44,142
25th Percentile £56,250 £51,250 £56,250
Median annual salary (50th Percentile) £80,000 £75,000 £76,391
Median % change year-on-year +6.67% -1.82% +1.85%
75th Percentile £110,000 £100,000 £100,000
90th Percentile £136,250 £130,000 £123,750
England median annual salary £60,000 £55,000 £65,000
% change year-on-year +9.09% -15.38% +4.00%

Product Ownership
Job Vacancy Trend in London

Job postings citing Product Ownership as a proportion of all IT jobs advertised in London.
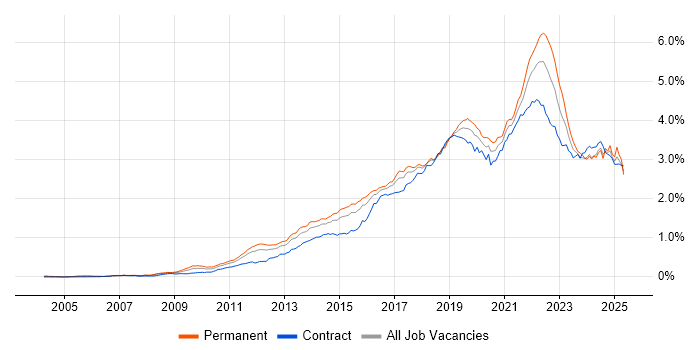
Job vacancy trend for Product Ownership in London

Product Ownership
Salary Trend in London

3-month moving average salary quoted in jobs citing Product Ownership in London.

Salary trend for Product Ownership in London

Product Ownership
Salary Histogram in London

Salary distribution for jobs citing Product Ownership in London over the 6 months to 30 May 2025.

Salary histogram for Product Ownership in London

Product Ownership
Job Locations in London

The table below looks at the demand and provides a guide to the median salaries quoted in IT jobs citing Product Ownership within the London region over the 6 months to 30 May 2025. The 'Rank Change' column provides an indication of the change in demand within each location based on the same 6 month period last year.

Location Rank Change
on Same Period
Last Year
Matching
Permanent
IT Job Ads
Median Salary
Past 6 Months
Median Salary
% Change
on Same Period
Last Year
Live
Jobs
Central London +26 77 £80,000 +6.67% 53
South London -11 20 - - 2
West London +29 16 £42,750 -25.65% 90
East London -11 9 £47,500 - 10
North London - 7 - -
Product Ownership
England

Product Ownership
Co-occurring Skills and Capabilities in London by Category

The follow tables expand on the table above by listing co-occurrences grouped by category. The same employment type, locality and period is covered with up to 20 co-occurrences shown in each of the following categories:

Application Platforms
1 36 (8.31%) Confluence
2 11 (2.54%) Apache Airflow
2 11 (2.54%) Apache Spark
3 5 (1.15%) CMS
3 5 (1.15%) SharePoint
4 3 (0.69%) Drupal
5 1 (0.23%) Apache
5 1 (0.23%) Microsoft Exchange
5 1 (0.23%) nginx
5 1 (0.23%) Oracle Workflow
5 1 (0.23%) Sitecore CMS
5 1 (0.23%) Solana
5 1 (0.23%) WordPress
Applications
1 28 (6.47%) Microsoft Office
2 7 (1.62%) Adobe XD
3 5 (1.15%) Trello
4 4 (0.92%) MS Visio
5 3 (0.69%) UserZoom
6 2 (0.46%) Microsoft Excel
7 1 (0.23%) Microsoft PowerPoint
7 1 (0.23%) Microsoft Project
Business Applications
1 13 (3.00%) Dynamics CRM
2 4 (0.92%) IBM Planning Analytics
3 2 (0.46%) NetSuite
3 2 (0.46%) Payment Gateway
3 2 (0.46%) Shopify
4 1 (0.23%) Carpe Diem
4 1 (0.23%) Elite 3E
4 1 (0.23%) Oracle Assets
4 1 (0.23%) Oracle EBS
4 1 (0.23%) Oracle EBS R12
4 1 (0.23%) Oracle Financials
4 1 (0.23%) Oracle General Ledger
4 1 (0.23%) Oracle Internet Expenses
4 1 (0.23%) Oracle iProcurement
4 1 (0.23%) Oracle Payables
4 1 (0.23%) Oracle Procure-to-Pay
4 1 (0.23%) Oracle Receivables
4 1 (0.23%) SAP ERP
4 1 (0.23%) SAP FI
4 1 (0.23%) Workday HCM
Cloud Services
1 82 (18.94%) Azure
2 71 (16.40%) AWS
3 36 (8.31%) GCP
3 36 (8.31%) Power Platform
4 31 (7.16%) Miro
5 24 (5.54%) SaaS
6 23 (5.31%) Figma
7 22 (5.08%) Asana
8 19 (4.39%) GitHub
9 18 (4.16%) Dynamics 365
9 18 (4.16%) Serverless
10 14 (3.23%) Azure DevOps
11 13 (3.00%) Azure Synapse Analytics
12 12 (2.77%) dbt
13 11 (2.54%) Cloud Computing
14 10 (2.31%) Dagster
14 10 (2.31%) Microsoft 365
14 10 (2.31%) PowerApps
15 9 (2.08%) Power Automate
16 7 (1.62%) ChatGPT
Communications & Networking
1 47 (10.85%) Broadband
2 12 (2.77%) HTTP
3 6 (1.39%) Firewall
4 4 (0.92%) DNS
4 4 (0.92%) Intranet
4 4 (0.92%) SD-WAN
4 4 (0.92%) WAN
5 1 (0.23%) BGP
5 1 (0.23%) Network Security
5 1 (0.23%) TCP/IP
5 1 (0.23%) Unified Communications
5 1 (0.23%) Value-Added Service
5 1 (0.23%) VPN
Database & Business Intelligence
1 32 (7.39%) Power BI
2 28 (6.47%) SQL Server
3 16 (3.70%) Data Warehouse
4 15 (3.46%) Data Lake
4 15 (3.46%) Tableau
5 12 (2.77%) Amazon Athena
6 11 (2.54%) Metadata
7 10 (2.31%) Apache Iceberg
7 10 (2.31%) Dremio
7 10 (2.31%) MySQL
7 10 (2.31%) NoSQL
7 10 (2.31%) Relational Database
8 9 (2.08%) Amazon Redshift
8 9 (2.08%) BigQuery
9 8 (1.85%) MongoDB
10 6 (1.39%) Big Data
10 6 (1.39%) Hadoop
11 4 (0.92%) Amazon QuickSight
11 4 (0.92%) DynamoDB
12 3 (0.69%) Amazon RDS
Development Applications
1 65 (15.01%) JIRA
2 13 (3.00%) Git
3 8 (1.85%) PowerBuilder
4 7 (1.62%) Axure RP
4 7 (1.62%) Balsamiq
5 6 (1.39%) GitLab
6 5 (1.15%) MSTest
6 5 (1.15%) NUnit
6 5 (1.15%) Selenium
7 4 (0.92%) Cypress.io
7 4 (0.92%) Jenkins
7 4 (0.92%) Postman
8 3 (0.69%) JMeter
8 3 (0.69%) Mocha
8 3 (0.69%) SoapUI
8 3 (0.69%) SpecFlow
9 2 (0.46%) Atlassian Bamboo
9 2 (0.46%) Bitbucket
9 2 (0.46%) Cucumber
9 2 (0.46%) Maven
General
1 170 (39.26%) Finance
2 155 (35.80%) Social Skills
3 79 (18.24%) Analytical Skills
4 61 (14.09%) Law
5 45 (10.39%) Marketing
6 39 (9.01%) Inclusion and Diversity
7 38 (8.78%) Banking
8 37 (8.55%) Influencing Skills
9 29 (6.70%) Games
10 28 (6.47%) Front Office
11 26 (6.00%) Retail
12 20 (4.62%) Advertising
13 15 (3.46%) Legal
13 15 (3.46%) Presentation Skills
14 13 (3.00%) Public Sector
15 11 (2.54%) Manufacturing
15 11 (2.54%) Publishing
16 8 (1.85%) Financial Institution
17 7 (1.62%) Documentation Skills
17 7 (1.62%) Electronics
Job Titles
1 89 (20.55%) Senior
2 75 (17.32%) Lead
2 75 (17.32%) Product Owner
3 58 (13.39%) Analyst
4 44 (10.16%) Developer
5 36 (8.31%) Senior Manager
6 35 (8.08%) Engineering Manager
7 28 (6.47%) Product Analyst
8 26 (6.00%) Data Engineer
8 26 (6.00%) Senior Service Manager
9 25 (5.77%) ServiceNow Manager
10 22 (5.08%) Business Analyst
11 21 (4.85%) Designer
11 21 (4.85%) Software Engineer
12 17 (3.93%) Architect
12 17 (3.93%) Senior Developer
13 14 (3.23%) Account Manager
13 14 (3.23%) Strategic Account Manager
14 13 (3.00%) Consultant
14 13 (3.00%) Product Manager
Libraries, Frameworks & Software Standards
1 44 (10.16%) React
2 28 (6.47%) .NET
3 23 (5.31%) REST
4 22 (5.08%) Kafka
5 16 (3.70%) CSS
6 14 (3.23%) HTML
7 13 (3.00%) RESTful
8 12 (2.77%) GraphQL
8 12 (2.77%) PySpark
9 10 (2.31%) NumPy
9 10 (2.31%) Pandas
9 10 (2.31%) SciPy
9 10 (2.31%) SOAP
10 9 (2.08%) AngularJS
10 9 (2.08%) JSON
10 9 (2.08%) Node.js
11 8 (1.85%) .NET Core
11 8 (1.85%) Web Services
12 7 (1.62%) Middleware
12 7 (1.62%) OAuth
Miscellaneous
1 47 (10.85%) Video\Live Streaming
2 32 (7.39%) FMCG
3 29 (6.70%) Self-Motivation
4 27 (6.24%) Cloud Native
5 26 (6.00%) Management Information System
6 24 (5.54%) Fixed Income
7 22 (5.08%) Over-the-Top Content
8 19 (4.39%) Equities
9 14 (3.23%) Digital Media
9 14 (3.23%) Marketing Technology
10 13 (3.00%) Reinsurance
11 12 (2.77%) Public Cloud
12 11 (2.54%) Data Structures
13 8 (1.85%) Virtual Team
14 7 (1.62%) Derivative
14 7 (1.62%) Foreign Exchange (FX)
14 7 (1.62%) Hedge funds
15 6 (1.39%) Greenfield Project
15 6 (1.39%) Private Cloud
16 5 (1.15%) Hackathon
Operating Systems
1 7 (1.62%) Android
2 6 (1.39%) Apple iOS
2 6 (1.39%) Unix
3 2 (0.46%) Linux
3 2 (0.46%) Windows
Processes & Methodologies
1 235 (54.27%) Agile
2 186 (42.96%) Roadmaps
3 93 (21.48%) Analytics
4 82 (18.94%) Stakeholder Management
5 81 (18.71%) Software Engineering
6 73 (16.86%) DevOps
7 69 (15.94%) CI/CD
8 67 (15.47%) Problem-Solving
9 64 (14.78%) Continuous Improvement
10 63 (14.55%) Scrum
11 62 (14.32%) User Experience
12 58 (13.39%) Project Management
13 57 (13.16%) Decision-Making
14 54 (12.47%) Product Management
15 50 (11.55%) CRM
15 50 (11.55%) Microservices
16 49 (11.32%) User Stories
17 46 (10.62%) Computer Science
18 45 (10.39%) Mentoring
19 43 (9.93%) Change Management
Programming Languages
1 66 (15.24%) Python
2 57 (13.16%) SQL
3 47 (10.85%) JavaScript
4 37 (8.55%) Java
5 32 (7.39%) C#
6 30 (6.93%) TypeScript
7 7 (1.62%) R
8 6 (1.39%) PHP
9 5 (1.15%) PowerShell
10 4 (0.92%) C
10 4 (0.92%) Shell Script
11 3 (0.69%) Apex Code
11 3 (0.69%) SOQL
11 3 (0.69%) T-SQL
12 2 (0.46%) Bash
12 2 (0.46%) Groovy
12 2 (0.46%) Kotlin
12 2 (0.46%) PL/SQL
12 2 (0.46%) Scala
12 2 (0.46%) Swift
Qualifications
1 86 (19.86%) Degree
2 37 (8.55%) Computer Science Degree
3 15 (3.46%) Security Cleared
4 8 (1.85%) SC Cleared
5 7 (1.62%) CSPO
6 5 (1.15%) Microsoft Certification
6 5 (1.15%) Numerate Degree
7 4 (0.92%) ISTQB
7 4 (0.92%) Master's Degree
8 3 (0.69%) ISTQB Foundation Certification
9 2 (0.46%) Azure Certification
9 2 (0.46%) CCA
9 2 (0.46%) DV Cleared
9 2 (0.46%) PMI Certification
10 1 (0.23%) AWS Certification
10 1 (0.23%) CBAP
10 1 (0.23%) CCNP
10 1 (0.23%) Cisco Certification
10 1 (0.23%) ITIL Certification
10 1 (0.23%) SnowPro
Quality Assurance & Compliance
1 32 (7.39%) QA
2 25 (5.77%) Accessibility
3 20 (4.62%) Data Quality
4 9 (2.08%) GDPR
5 7 (1.62%) WCAG
6 5 (1.15%) MiFID
7 4 (0.92%) SLA
8 3 (0.69%) ISO 20022
8 3 (0.69%) PMO
9 2 (0.46%) Cyber Essentials
9 2 (0.46%) ISO/IEC 27001
10 1 (0.23%) NIST
System Software
1 19 (4.39%) Docker
2 6 (1.39%) Active Directory
3 2 (0.46%) Virtual Desktop
4 1 (0.23%) Virtual Machines
Systems Management
1 38 (8.78%) Kubernetes
2 18 (4.16%) Terraform
3 5 (1.15%) Ansible
4 4 (0.92%) Argo
4 4 (0.92%) Grafana
4 4 (0.92%) Prometheus
5 3 (0.69%) Kustomize
5 3 (0.69%) Single Sign-On
6 2 (0.46%) FortiGate
7 1 (0.23%) Check_MK
7 1 (0.23%) Istio
7 1 (0.23%) Kibana
7 1 (0.23%) logstash
7 1 (0.23%) Opsgenie
7 1 (0.23%) Oracle RMAN
Vendors
1 89 (20.55%) Microsoft
2 40 (9.24%) Salesforce
3 29 (6.70%) ServiceNow
4 20 (4.62%) Databricks
4 20 (4.62%) Google
5 10 (2.31%) SAP
6 9 (2.08%) Adobe
7 6 (1.39%) Foundry
8 5 (1.15%) Oracle
9 4 (0.92%) Atlassian
9 4 (0.92%) IBM
9 4 (0.92%) Workday
10 3 (0.69%) Guidewire
10 3 (0.69%) Ping Identity
11 2 (0.46%) Pardot
11 2 (0.46%) Pega
12 1 (0.23%) Imperva
12 1 (0.23%) Palantir
12 1 (0.23%) Sitecore
12 1 (0.23%) Splunk