Presales Jobs in London

Presales
England > London

The following table provides summary statistics for permanent job vacancies advertised in London with a requirement for Presales skills. Included is a benchmarking guide to the salaries offered in vacancies that have cited Presales over the 6 months to 27 April 2024 with a comparison to the same period in the previous 2 years.

6 months to
27 Apr 2024
Same period 2023 Same period 2022
Rank 186 156 276
Rank change year-on-year -30 +120 -109
Permanent jobs citing Presales 402 812 985
As % of all permanent jobs advertised in London 1.71% 2.27% 1.51%
As % of the Processes & Methodologies category 1.87% 2.38% 1.56%
Number of salaries quoted 262 479 593
10th Percentile £53,750 £60,000 £51,250
25th Percentile £62,500 £70,000 £61,250
Median annual salary (50th Percentile) £80,000 £85,000 £80,000
Median % change year-on-year -5.88% +6.25% -
75th Percentile £96,250 £105,000 £100,000
90th Percentile £105,000 £123,400 £112,500
England median annual salary £59,000 £80,000 £70,000
% change year-on-year -26.25% +14.29% -

All Process and Methodology Skills
London

Presales is in the Processes and Methodologies category. The following table is for comparison with the above and provides summary statistics for all permanent job vacancies advertised in London with a requirement for process or methodology skills.

Permanent vacancies with a requirement for process or methodology skills 21,454 34,168 63,282
As % of all permanent jobs advertised in London 91.39% 95.40% 96.83%
Number of salaries quoted 15,999 24,428 34,404
10th Percentile £38,000 £43,750 £42,500
25th Percentile £52,250 £55,000 £53,750
Median annual salary (50th Percentile) £70,000 £75,000 £70,000
Median % change year-on-year -6.67% +7.14% -
75th Percentile £95,000 £95,000 £92,500
90th Percentile £115,000 £115,000 £111,250
England median annual salary £55,000 £62,500 £60,000
% change year-on-year -12.00% +4.17% +9.09%

Presales
Job Vacancy Trend in London

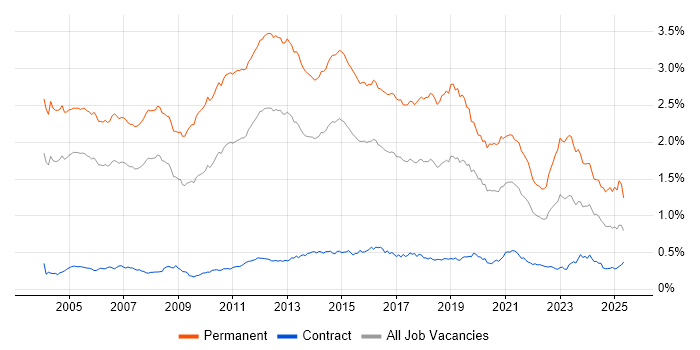
Job postings citing Presales as a proportion of all IT jobs advertised in London.

Job vacancy trend for Presales in London

Presales
Salary Trend in London

3-month moving average salary quoted in jobs citing Presales in London.

Salary trend for Presales in London

Presales
Salary Histogram in London

Salary distribution for jobs citing Presales in London over the 6 months to 27 April 2024.

Salary histogram for Presales in London

Presales
Job Locations in London

The table below looks at the demand and provides a guide to the median salaries quoted in IT jobs citing Presales within the London region over the 6 months to 27 April 2024. The 'Rank Change' column provides an indication of the change in demand within each location based on the same 6 month period last year.

Location Rank Change
on Same Period
Last Year
Matching
Permanent
IT Job Ads
Median Salary
Past 6 Months
Median Salary
% Change
on Same Period
Last Year
Live
Jobs
Central London +22 95 £83,250 +4.06% 18
East London +9 5 - - 5
South London -1 3 £72,500 +38.10%
West London -35 2 - - 4
Presales
England

Presales
Co-occurring Skills and Capabilities in London by Category

The follow tables expand on the table above by listing co-occurrences grouped by category. The same employment type, locality and period is covered with up to 20 co-occurrences shown in each of the following categories:

Application Platforms
1 21 (5.22%) SharePoint
2 8 (1.99%) Microsoft Exchange
3 3 (0.75%) Oracle Workflow
4 1 (0.25%) Confluence
Applications
1 3 (0.75%) Microsoft Office
Business Applications
1 29 (7.21%) Dynamics CRM
2 20 (4.98%) Remedy ITSM
3 9 (2.24%) Elite 3E
4 6 (1.49%) Oracle Payroll
5 5 (1.24%) SAP S/4HANA
6 2 (0.50%) Oracle EBS
6 2 (0.50%) SAP GRC
6 2 (0.50%) Shopify
7 1 (0.25%) Salesforce CRM
7 1 (0.25%) SAP MM
7 1 (0.25%) SAP PP
Cloud Services
1 126 (31.34%) Azure
2 72 (17.91%) Microsoft 365
3 51 (12.69%) Power Platform
4 49 (12.19%) Dynamics 365
5 44 (10.95%) AWS
6 32 (7.96%) SaaS
7 28 (6.97%) Azure DevOps
8 21 (5.22%) Azure Service Bus
9 16 (3.98%) Azure Cosmos DB
9 16 (3.98%) Azure Monitor
10 15 (3.73%) PowerApps
11 14 (3.48%) Power Automate
12 13 (3.23%) OCI
13 12 (2.99%) GCP
14 10 (2.49%) Azure Sentinel
15 9 (2.24%) Serverless
16 8 (1.99%) Entra ID
17 7 (1.74%) Cloud Computing
18 5 (1.24%) Azure Functions
18 5 (1.24%) Azure Logic Apps
Communications & Networking
1 41 (10.20%) WAN
2 37 (9.20%) LAN
3 35 (8.71%) SD-WAN
4 31 (7.71%) Wi-Fi
5 25 (6.22%) Firewall
6 23 (5.72%) VPN
7 20 (4.98%) Cisco ISE
8 16 (3.98%) SAN
9 14 (3.48%) VLAN
10 8 (1.99%) MPLS
10 8 (1.99%) SSL
11 7 (1.74%) BGP
11 7 (1.74%) IGRP
11 7 (1.74%) VPLS
11 7 (1.74%) VRRP
12 4 (1.00%) Network Security
13 3 (0.75%) Internet
13 3 (0.75%) Wireless
14 2 (0.50%) Ethernet
15 1 (0.25%) VoIP
Database & Business Intelligence
1 27 (6.72%) SQL Server
2 22 (5.47%) SQL Server Analysis Services
3 18 (4.48%) Power BI
4 9 (2.24%) Data Warehouse
4 9 (2.24%) MySQL
4 9 (2.24%) Relational Database
5 8 (1.99%) Data Lake
6 4 (1.00%) Azure SQL Database
7 2 (0.50%) Azure SQL Data Warehouse
8 1 (0.25%) Big Data
8 1 (0.25%) Delta Lake
8 1 (0.25%) PostgreSQL
8 1 (0.25%) SAP BW
8 1 (0.25%) SAP HANA
8 1 (0.25%) SQL Server Reporting Services
Development Applications
1 9 (2.24%) Visual Studio
2 5 (1.24%) Team Foundation Server
3 2 (0.50%) JIRA
General
1 131 (32.59%) Social Skills
2 68 (16.92%) Finance
3 38 (9.45%) Presentation Skills
4 30 (7.46%) Retail
5 28 (6.97%) Marketing
6 19 (4.73%) Analytical Skills
7 18 (4.48%) Back Office
8 16 (3.98%) Local Government
9 15 (3.73%) Inclusion and Diversity
9 15 (3.73%) Public Sector
10 14 (3.48%) Billing
10 14 (3.48%) Documentation Skills
11 12 (2.99%) Telecoms
12 9 (2.24%) Legal
12 9 (2.24%) Manufacturing
13 7 (1.74%) Law
14 6 (1.49%) Banking
15 5 (1.24%) Automotive
15 5 (1.24%) Pharmaceutical
16 3 (0.75%) Front Office
Job Titles
1 159 (39.55%) Architect
2 106 (26.37%) Solutions Architect
3 83 (20.65%) Consultant
3 83 (20.65%) Senior
4 42 (10.45%) Lead
5 38 (9.45%) Senior Architect
6 34 (8.46%) Senior Solutions Architect
7 25 (6.22%) Presales Solution Architect
7 25 (6.22%) Senior Consultant
8 23 (5.72%) Presales Consultant
8 23 (5.72%) Presales Engineer
9 22 (5.47%) Project Manager
10 20 (4.98%) WAN Engineer
11 18 (4.48%) ServiceNow Architect
12 17 (4.23%) Dynamics 365 Architect
13 15 (3.73%) Infrastructure Architect
13 15 (3.73%) Presales Manager
13 15 (3.73%) Solutions Consultant
14 14 (3.48%) Technical Consultant
15 12 (2.99%) Technical Architect
Libraries, Frameworks & Software Standards
1 27 (6.72%) Web Services
2 24 (5.97%) .NET
3 21 (5.22%) HTML
3 21 (5.22%) SOAP
3 21 (5.22%) XML
4 20 (4.98%) CSS
5 18 (4.48%) .NET Core
6 13 (3.23%) JSON
6 13 (3.23%) REST
7 10 (2.49%) LDAP
8 8 (1.99%) Ajax
9 6 (1.49%) AngularJS
10 4 (1.00%) React
10 4 (1.00%) Twitter Bootstrap
11 3 (0.75%) Node.js
12 2 (0.50%) JDBC
13 1 (0.25%) SAP Basis
Miscellaneous
1 46 (11.44%) Public Cloud
2 32 (7.96%) Data Centre
3 15 (3.73%) Management Information System
3 15 (3.73%) Replication
4 11 (2.74%) Self-Motivation
5 10 (2.49%) Legacy Systems
6 9 (2.24%) Virtual Team
7 8 (1.99%) CMDB
7 8 (1.99%) Onboarding
8 7 (1.74%) Client/Server
8 7 (1.74%) Hybrid Cloud
8 7 (1.74%) PKI
9 6 (1.49%) Enterprise Software
10 5 (1.24%) Blog
10 5 (1.24%) IoT
10 5 (1.24%) Private Cloud
11 4 (1.00%) Data Structures
11 4 (1.00%) FMCG
11 4 (1.00%) Mobile App
11 4 (1.00%) Social Media
Operating Systems
1 21 (5.22%) Windows
2 19 (4.73%) Linux
3 16 (3.98%) Windows Server
4 14 (3.48%) SUSE
4 14 (3.48%) Ubuntu
4 14 (3.48%) Windows Server 2012
5 1 (0.25%) Unix
Processes & Methodologies
1 77 (19.15%) Agile
2 73 (18.16%) Mentoring
2 73 (18.16%) Project Delivery
3 69 (17.16%) Project Management
4 68 (16.92%) Thought Leadership
5 59 (14.68%) Actionable Insight
6 57 (14.18%) Cybersecurity
6 57 (14.18%) Problem-Solving
7 48 (11.94%) DevOps
8 44 (10.95%) Artificial Intelligence
9 41 (10.20%) Continuous Improvement
10 39 (9.70%) CRM
10 39 (9.70%) Digital Transformation Programme
11 36 (8.96%) Customer Requirements
11 36 (8.96%) Software Delivery
12 33 (8.21%) Customer Engagement
13 31 (7.71%) Scrum
14 30 (7.46%) Roadmaps
15 29 (7.21%) Software Engineering
16 27 (6.72%) Machine Learning
Programming Languages
1 35 (8.71%) JavaScript
2 27 (6.72%) SQL
3 26 (6.47%) PowerShell
4 25 (6.22%) C#
5 16 (3.98%) Bicep
6 15 (3.73%) Python
7 9 (2.24%) Perl
8 4 (1.00%) TypeScript
9 2 (0.50%) R
Qualifications
1 90 (22.39%) Degree
2 49 (12.19%) Security Cleared
3 35 (8.71%) SC Cleared
4 29 (7.21%) Microsoft Certification
5 18 (4.48%) Azure Certification
5 18 (4.48%) Computer Science Degree
6 15 (3.73%) CREST Certified
6 15 (3.73%) VMware Certified Professional (VCP)
7 14 (3.48%) MCSA
7 14 (3.48%) MCSE
8 9 (2.24%) PMI Certification
8 9 (2.24%) PMP
9 5 (1.24%) Master's Degree
9 5 (1.24%) PCI QSA
10 4 (1.00%) AWS Certification
10 4 (1.00%) CISA
10 4 (1.00%) CISM
10 4 (1.00%) CISSP
10 4 (1.00%) ITIL Foundation Certificate
10 4 (1.00%) Oracle Certification
Quality Assurance & Compliance
1 28 (6.97%) QA
2 14 (3.48%) ISO/IEC 27001
3 8 (1.99%) GRC
3 8 (1.99%) NIST
4 6 (1.49%) Cyber Essentials
5 5 (1.24%) Accessibility
5 5 (1.24%) GAMP
5 5 (1.24%) GMP
5 5 (1.24%) PCI DSS
6 4 (1.00%) PMO
7 3 (0.75%) COBIT
7 3 (0.75%) NCSC
8 2 (0.50%) ISO 9001
9 1 (0.25%) GDPR
9 1 (0.25%) SOC 2
System Software
1 32 (7.96%) Active Directory
2 17 (4.23%) VMware Infrastructure
3 15 (3.73%) vCloud
3 15 (3.73%) vSphere
4 2 (0.50%) Virtual Desktop
5 1 (0.25%) Docker
5 1 (0.25%) NFS
Systems Management
1 14 (3.48%) Microsoft Intune
2 8 (1.99%) HP UCMDB
3 4 (1.00%) Active Directory Federation Services
4 3 (0.75%) OpenView
5 2 (0.50%) Kubernetes
5 2 (0.50%) RSA Archer
5 2 (0.50%) Single Sign-On
6 1 (0.25%) CASB
6 1 (0.25%) Nagios
6 1 (0.25%) ZABBIX
Vendors
1 135 (33.58%) Microsoft
2 45 (11.19%) HP
3 40 (9.95%) Cisco
4 36 (8.96%) Meraki
5 30 (7.46%) Fortinet
5 30 (7.46%) Oracle
6 26 (6.47%) ServiceNow
7 23 (5.72%) Aruba
7 23 (5.72%) Dell
8 20 (4.98%) BMC
8 20 (4.98%) Remedy
9 18 (4.48%) VMware
10 15 (3.73%) Veeam
11 14 (3.48%) Fujitsu
12 12 (2.99%) Adobe
12 12 (2.99%) Apple
13 10 (2.49%) Salesforce
13 10 (2.49%) Samsung
14 9 (2.24%) Google
15 8 (1.99%) SAP