Microservices Jobs in London

Microservices
England > London

The table below provides summary statistics for permanent job vacancies advertised in London requiring Microservices skills. It includes a benchmarking guide to the annual salaries offered in vacancies that cited Microservices over the 6 months leading up to 8 December 2024, comparing them to the same period in the previous two years.

6 months to
8 Dec 2024
Same period 2023 Same period 2022
Rank 59 42 27
Rank change year-on-year -17 -15 -5
Permanent jobs citing Microservices 896 1,089 3,993
As % of all permanent jobs advertised in London 4.97% 5.91% 8.54%
As % of the Processes & Methodologies category 5.32% 6.32% 8.91%
Number of salaries quoted 406 854 2,552
10th Percentile £49,691 £55,000 £56,250
25th Percentile £64,000 £66,250 £70,000
Median annual salary (50th Percentile) £85,000 £82,500 £85,000
Median % change year-on-year +3.03% -2.94% +3.03%
75th Percentile £110,000 £100,000 £107,500
90th Percentile £130,000 £120,000 £124,875
England median annual salary £70,000 £75,000 £80,000
% change year-on-year -6.67% -6.25% +10.34%

All Process and Methodology Skills
London

Microservices falls under the Processes and Methodologies category. For comparison with the information above, the following table provides summary statistics for all permanent job vacancies requiring process or methodology skills in London.

Permanent vacancies with a requirement for process or methodology skills 16,854 17,243 44,796
As % of all permanent jobs advertised in London 93.41% 93.63% 95.82%
Number of salaries quoted 8,969 13,801 30,668
10th Percentile £42,500 £42,000 £42,500
25th Percentile £56,250 £56,250 £55,000
Median annual salary (50th Percentile) £75,000 £75,000 £72,500
Median % change year-on-year - +3.45% +3.57%
75th Percentile £97,500 £95,000 £93,750
90th Percentile £120,000 £116,250 £112,500
England median annual salary £60,000 £60,000 £62,500
% change year-on-year - -4.00% +4.17%

Microservices
Job Vacancy Trend in London

Job postings citing Microservices as a proportion of all IT jobs advertised in London.
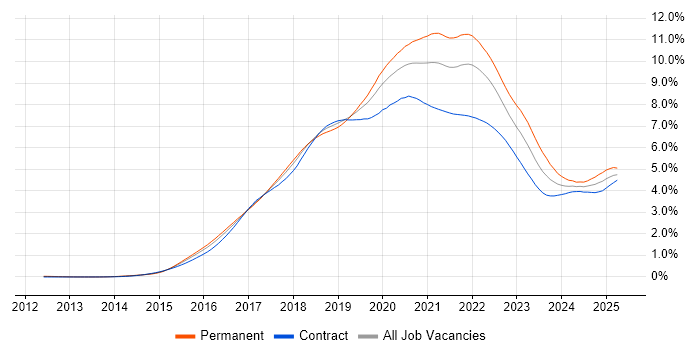
Job vacancy trend for Microservices in London

Microservices
Salary Trend in London

3-month moving average salary quoted in jobs citing Microservices in London.

Salary trend for Microservices in London

Microservices
Salary Histogram in London

Salary distribution for jobs citing Microservices in London over the 6 months to 8 December 2024.

Salary histogram for Microservices in London

Microservices
Job Locations in London

The table below looks at the demand and provides a guide to the median salaries quoted in IT jobs citing Microservices within the London region over the 6 months to 8 December 2024. The 'Rank Change' column provides an indication of the change in demand within each location based on the same 6 month period last year.

Location Rank Change
on Same Period
Last Year
Matching
Permanent
IT Job Ads
Median Salary
Past 6 Months
Median Salary
% Change
on Same Period
Last Year
Live
Jobs
Central London -12 185 £85,000 -1.45% 52
South London -28 41 £96,250 +37.50% 4
West London -28 5 £67,500 +20.00% 6
Microservices
England

Microservices
Co-occurring Skills and Capabilities in London by Category

The follow tables expand on the table above by listing co-occurrences grouped by category. The same employment type, locality and period is covered with up to 20 co-occurrences shown in each of the following categories:

Application Platforms
1 31 (3.46%) Confluence
2 18 (2.01%) Oracle SOA Suite
3 15 (1.67%) CMS
4 10 (1.12%) Apache
4 10 (1.12%) Apache Spark
5 9 (1.00%) OpenStack
6 6 (0.67%) JBoss
6 6 (0.67%) Red Hat Fuse
7 5 (0.56%) Apache Airflow
8 3 (0.33%) WordPress
9 2 (0.22%) Apache Pulsar
9 2 (0.22%) Tomcat
10 1 (0.11%) Adobe Experience Manager
10 1 (0.11%) DataSynapse
10 1 (0.11%) Drupal
10 1 (0.11%) Jupyter
10 1 (0.11%) Magnolia
10 1 (0.11%) nginx
Applications
1 13 (1.45%) Chatbot
2 6 (0.67%) Spreadsheet
3 5 (0.56%) Microsoft PowerPoint
4 2 (0.22%) MS Visio
5 1 (0.11%) Maya
5 1 (0.11%) Microsoft Office
Business Applications
1 17 (1.90%) Oracle EBS
2 13 (1.45%) Payment Gateway
3 8 (0.89%) Shopify
4 2 (0.22%) FLEXCUBE
4 2 (0.22%) Oracle BPM
4 2 (0.22%) Refinitiv Enterprise Platform
5 1 (0.11%) Dynamics CRM
5 1 (0.11%) R3 Corda
5 1 (0.11%) ReMetrica
5 1 (0.11%) SAP Hybris
Cloud Services
1 447 (49.89%) AWS
2 300 (33.48%) Azure
3 228 (25.45%) GCP
4 128 (14.29%) Serverless
5 76 (8.48%) AWS Lambda
6 64 (7.14%) Cloud Computing
7 52 (5.80%) Azure DevOps
7 52 (5.80%) SaaS
8 41 (4.58%) Amazon EKS
9 39 (4.35%) PaaS
10 34 (3.79%) Amazon SQS
11 33 (3.68%) Azure Functions
12 32 (3.57%) GitHub
12 32 (3.57%) IaaS
13 28 (3.13%) Amazon ECS
14 26 (2.90%) Amazon EC2
15 23 (2.57%) Amazon S3
15 23 (2.57%) GitHub Actions
16 20 (2.23%) Cloud Functions
17 18 (2.01%) OCI
Communications & Networking
1 141 (15.74%) Broadband
2 10 (1.12%) HTTP
3 8 (0.89%) Internet
4 6 (0.67%) VPN
5 5 (0.56%) Network Security
6 4 (0.45%) Firewall
7 2 (0.22%) DNS
7 2 (0.22%) Multicast
8 1 (0.11%) 3GPP
8 1 (0.11%) ATM
8 1 (0.11%) DAB
8 1 (0.11%) SD-WAN
8 1 (0.11%) TCP/IP
8 1 (0.11%) WAN
Database & Business Intelligence
1 134 (14.96%) Relational Database
2 125 (13.95%) MongoDB
3 113 (12.61%) NoSQL
4 105 (11.72%) MySQL
5 86 (9.60%) PostgreSQL
6 37 (4.13%) Big Data
7 34 (3.79%) SQL Server
8 30 (3.35%) Amazon Aurora
9 29 (3.24%) DynamoDB
10 26 (2.90%) Amazon Redshift
11 25 (2.79%) Amazon RDS
12 20 (2.23%) BigQuery
13 17 (1.90%) Oracle ODI
14 16 (1.79%) RDBMS
15 13 (1.45%) Elasticsearch
16 12 (1.34%) Data Warehouse
16 12 (1.34%) Metadata
17 10 (1.12%) Redis
18 9 (1.00%) Hadoop
19 8 (0.89%) Azure SQL Database
Development Applications
1 186 (20.76%) Git
2 105 (11.72%) GitLab
3 104 (11.61%) Jenkins
4 55 (6.14%) Maven
5 45 (5.02%) Mockito
6 34 (3.79%) JIRA
6 34 (3.79%) JUnit
7 29 (3.24%) Gradle
8 26 (2.90%) Sonatype Nexus
9 18 (2.01%) Cucumber
10 16 (1.79%) JMeter
11 13 (1.45%) Selenium
12 10 (1.12%) SonarQube
13 8 (0.89%) Crucible
13 8 (0.89%) Postman
14 7 (0.78%) TeamCity
15 4 (0.45%) DbUnit
15 4 (0.45%) Jasmine
15 4 (0.45%) jMock
15 4 (0.45%) SpecFlow
General
1 206 (22.99%) Social Skills
2 196 (21.88%) Finance
3 111 (12.39%) Banking
4 55 (6.14%) Analytical Skills
5 53 (5.92%) Games
6 43 (4.80%) Law
7 39 (4.35%) Inclusion and Diversity
8 38 (4.24%) Retail
9 29 (3.24%) Marketing
9 29 (3.24%) Public Sector
10 28 (3.13%) Presentation Skills
11 23 (2.57%) Manufacturing
11 23 (2.57%) Retail Banking
12 18 (2.01%) Legal
13 15 (1.67%) Back Office
13 15 (1.67%) Investment Banking
14 14 (1.56%) Front Office
15 13 (1.45%) Financial Institution
16 12 (1.34%) Organisational Skills
17 9 (1.00%) Public Speaking
Job Titles
1 237 (26.45%) Developer
2 219 (24.44%) Senior
3 180 (20.09%) Software Engineer
4 126 (14.06%) Architect
5 100 (11.16%) Java Developer
6 91 (10.16%) Lead
7 89 (9.93%) Senior Developer
8 83 (9.26%) Product Manager
9 82 (9.15%) Technical Manager
10 81 (9.04%) Technical Product Manager
11 74 (8.26%) Senior Software Engineer
12 54 (6.03%) Solutions Architect
13 47 (5.25%) Full-Stack Engineer
14 46 (5.13%) Java Engineer
15 42 (4.69%) Analyst
15 42 (4.69%) C# Developer
16 40 (4.46%) Cybersecurity Analyst
16 40 (4.46%) Development Analyst
16 40 (4.46%) Security Analyst
17 34 (3.79%) .NET Developer
Libraries, Frameworks & Software Standards
1 140 (15.63%) RESTful
2 136 (15.18%) React
3 130 (14.51%) Spring
4 126 (14.06%) .NET
5 124 (13.84%) Spring Boot
6 123 (13.73%) REST
7 116 (12.95%) Kafka
8 102 (11.38%) AngularJS
9 99 (11.05%) HTML
10 82 (9.15%) CSS
11 71 (7.92%) XML
12 59 (6.58%) .NET Core
13 53 (5.92%) Web Services
14 48 (5.36%) RabbitMQ
15 44 (4.91%) Node.js
16 37 (4.13%) JSON
17 33 (3.68%) OAuth
18 32 (3.57%) Vue
19 29 (3.24%) Flask
20 27 (3.01%) OAuth2
Miscellaneous
1 202 (22.54%) Cloud Native
2 121 (13.50%) Distributed Systems
3 115 (12.83%) Product Ownership
4 62 (6.92%) Greenfield Project
5 45 (5.02%) Onboarding
6 40 (4.46%) Cyber Threat
7 25 (2.79%) IoT
8 24 (2.68%) Enterprise Software
8 24 (2.68%) Public Cloud
9 23 (2.57%) Data Structures
10 20 (2.23%) Legacy Systems
10 20 (2.23%) Video\Live Streaming
11 19 (2.12%) Virtual Team
12 18 (2.01%) Blockchain
13 17 (1.90%) Hedge funds
14 16 (1.79%) Distributed Computing
15 15 (1.67%) Algorithms
15 15 (1.67%) Self-Motivation
16 13 (1.45%) Reinsurance
17 11 (1.23%) Mobile Games
Operating Systems
1 35 (3.91%) Linux
2 10 (1.12%) Windows
3 9 (1.00%) Android
3 9 (1.00%) Unix
4 8 (0.89%) Apple iOS
5 4 (0.45%) Red Hat Enterprise Linux
6 2 (0.22%) CentOS
6 2 (0.22%) Ubuntu
7 1 (0.11%) VMS
Processes & Methodologies
1 340 (37.95%) Software Engineering
2 334 (37.28%) CI/CD
3 329 (36.72%) Agile
4 312 (34.82%) DevOps
5 195 (21.76%) Mentoring
6 179 (19.98%) Containerisation
7 174 (19.42%) TDD
8 163 (18.19%) SDLC
9 161 (17.97%) Continuous Integration
10 150 (16.74%) Design Patterns
11 133 (14.84%) Full-Stack Development
12 131 (14.62%) Problem-Solving
13 127 (14.17%) Test Automation
14 110 (12.28%) Continuous Delivery
14 110 (12.28%) Event-Driven
15 107 (11.94%) Computer Science
16 100 (11.16%) BDD
17 89 (9.93%) Non-Functional Testing
18 88 (9.82%) Configuration Management
19 85 (9.49%) Unit Testing
Programming Languages
1 358 (39.96%) Java
2 244 (27.23%) Python
3 165 (18.42%) SQL
4 163 (18.19%) C#
5 132 (14.73%) JavaScript
6 80 (8.93%) Go
7 57 (6.36%) Bash
8 52 (5.80%) TypeScript
9 39 (4.35%) Kotlin
10 35 (3.91%) Scala
11 18 (2.01%) C
11 18 (2.01%) C++
11 18 (2.01%) Shell Script
12 13 (1.45%) PHP
13 11 (1.23%) PowerShell
14 8 (0.89%) Bicep
14 8 (0.89%) Ruby
14 8 (0.89%) Rust
15 6 (0.67%) Perl
15 6 (0.67%) R
Qualifications
1 120 (13.39%) Degree
2 86 (9.60%) Computer Science Degree
3 62 (6.92%) Security Cleared
4 56 (6.25%) SC Cleared
5 30 (3.35%) Master's Degree
6 19 (2.12%) AWS Certification
7 13 (1.45%) Azure Certification
8 10 (1.12%) Numerate Degree
9 8 (0.89%) BPSS Clearance
10 7 (0.78%) AWS Certified Solutions Architect
11 6 (0.67%) DV Cleared
12 2 (0.22%) AWS Certified Developer
12 2 (0.22%) NVQ Level 3
13 1 (0.11%) TOGAF Certification
Quality Assurance & Compliance
1 110 (12.28%) QA
2 17 (1.90%) Accessibility
3 16 (1.79%) Data Quality
4 14 (1.56%) GDPR
4 14 (1.56%) MiFID
5 12 (1.34%) SLA
6 7 (0.78%) HIPAA
7 4 (0.45%) PCI DSS
7 4 (0.45%) WCAG
8 3 (0.33%) SOC 2
9 1 (0.11%) GRC
9 1 (0.11%) HL7
9 1 (0.11%) ISO 20022
9 1 (0.11%) ISO/IEC 27001
9 1 (0.11%) SEPA
9 1 (0.11%) TARGET2
System Software
1 329 (36.72%) Docker
2 6 (0.67%) Virtual Machines
3 2 (0.22%) Active Directory
4 1 (0.11%) Apache Flume
4 1 (0.11%) Lustre
4 1 (0.11%) Slurm Workload Manager
4 1 (0.11%) VMware Infrastructure
Systems Management
1 342 (38.17%) Kubernetes
2 143 (15.96%) Terraform
3 29 (3.24%) Grafana
4 23 (2.57%) Kibana
5 22 (2.46%) Ansible
6 18 (2.01%) Prometheus
7 16 (1.79%) Progress Chef
8 13 (1.45%) Puppet
9 10 (1.12%) Argo
10 9 (1.00%) Istio
11 3 (0.33%) Single Sign-On
12 2 (0.22%) Consul
12 2 (0.22%) ITRS Geneos
12 2 (0.22%) logstash
12 2 (0.22%) MIIS
12 2 (0.22%) Thomson Reuters DACS
13 1 (0.11%) Karpenter
13 1 (0.11%) PingFederate
13 1 (0.11%) Podman
13 1 (0.11%) Rancher
Vendors
1 81 (9.04%) Google
2 55 (6.14%) Splunk
3 36 (4.02%) Microsoft
4 34 (3.79%) Oracle
5 31 (3.46%) SAP
6 18 (2.01%) Salesforce
7 14 (1.56%) Dynatrace
8 8 (0.89%) IBM
8 8 (0.89%) Trayport
9 7 (0.78%) ServiceNow
10 6 (0.67%) Adobe
11 4 (0.45%) Databricks
11 4 (0.45%) ION Trading
11 4 (0.45%) Okta
12 3 (0.33%) ForgeRock
12 3 (0.33%) Guidewire
12 3 (0.33%) New Relic
12 3 (0.33%) OpenAI
12 3 (0.33%) Ping Identity
12 3 (0.33%) WSO2