C Jobs in London

C
England > London

The table below provides summary statistics for permanent job vacancies advertised in London requiring C skills. It includes a benchmarking guide to the annual salaries offered in vacancies that cited C over the 6 months leading up to 26 July 2024, comparing them to the same period in the previous two years.

6 months to
26 Jul 2024
Same period 2023 Same period 2022
Rank 318 328 329
Rank change year-on-year +10 +1 -17
Permanent jobs citing C 164 248 971
As % of all permanent jobs advertised in London 0.79% 0.91% 1.29%
As % of the Programming Languages category 1.98% 1.96% 2.20%
Number of salaries quoted 133 167 274
10th Percentile £50,000 £41,000 £44,125
25th Percentile £60,000 £57,500 £61,250
Median annual salary (50th Percentile) £90,000 £70,000 £75,000
Median % change year-on-year +28.57% -6.67% +15.38%
75th Percentile £115,000 £83,750 £89,688
90th Percentile £122,500 £99,164 £118,500
England median annual salary £59,500 £62,500 £57,500
% change year-on-year -4.80% +8.70% +4.55%

All Programming Languages
London

C falls under the Programming Languages category. For comparison with the information above, the following table provides summary statistics for all permanent job vacancies requiring coding skills in London.

Permanent vacancies with a requirement for coding skills 8,288 12,679 44,055
As % of all permanent jobs advertised in London 39.96% 46.75% 58.73%
Number of salaries quoted 6,178 10,658 18,987
10th Percentile £48,000 £48,750 £46,250
25th Percentile £61,250 £60,000 £56,250
Median annual salary (50th Percentile) £82,500 £80,000 £75,000
Median % change year-on-year +3.13% +6.67% +7.14%
75th Percentile £105,000 £100,000 £95,000
90th Percentile £135,000 £125,000 £115,000
England median annual salary £60,000 £65,000 £62,500
% change year-on-year -7.69% +4.00% +8.70%

C
Job Vacancy Trend in London

Job postings citing C as a proportion of all IT jobs advertised in London.
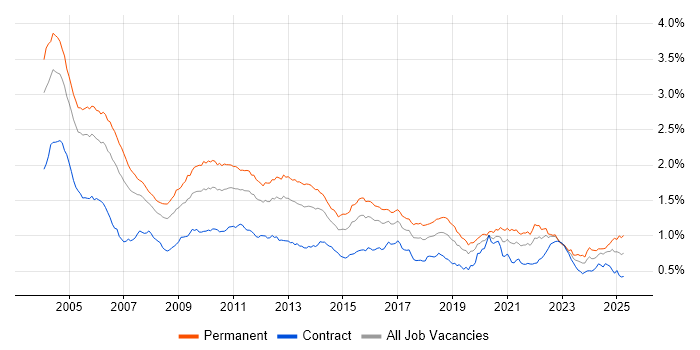
Job vacancy trend for C in London

C
Salary Trend in London

3-month moving average salary quoted in jobs citing C in London.

Salary trend for C in London

C
Salary Histogram in London

Salary distribution for jobs citing C in London over the 6 months to 26 July 2024.

Salary histogram for C in London

C
Job Locations in London

The table below looks at the demand and provides a guide to the median salaries quoted in IT jobs citing C within the London region over the 6 months to 26 July 2024. The 'Rank Change' column provides an indication of the change in demand within each location based on the same 6 month period last year.

Location Rank Change
on Same Period
Last Year
Matching
Permanent
IT Job Ads
Median Salary
Past 6 Months
Median Salary
% Change
on Same Period
Last Year
Live
Jobs
Central London +26 13 £90,000 +24.14% 2
West London -16 2 £56,250 +12.50% 4
South London -30 2 £57,500 +27.78% 2
East London - 2 £55,000 - 3
C
England

C
Co-occurring Skills and Capabilities in London by Category

The follow tables expand on the table above by listing co-occurrences grouped by category. The same employment type, locality and period is covered with up to 20 co-occurrences shown in each of the following categories:

Application Platforms
1 11 (6.71%) Apache Spark
2 2 (1.22%) Apache
3 1 (0.61%) nginx
3 1 (0.61%) SAS
Business Applications
1 2 (1.22%) Teamcenter
Cloud Services
1 18 (10.98%) AWS
2 11 (6.71%) Azure
3 6 (3.66%) GCP
4 5 (3.05%) Serverless
5 4 (2.44%) AWS Lambda
5 4 (2.44%) Azure DevOps
5 4 (2.44%) Cohesity
5 4 (2.44%) IaaS
6 2 (1.22%) Amazon EC2
6 2 (1.22%) WhatsApp
7 1 (0.61%) Amazon EKS
7 1 (0.61%) Amazon S3
7 1 (0.61%) Amazon SageMaker
7 1 (0.61%) AWS CloudFormation
7 1 (0.61%) Datadog
7 1 (0.61%) Dynamics 365
7 1 (0.61%) GitHub
7 1 (0.61%) Microsoft 365
Communications & Networking
1 11 (6.71%) TCP/IP
2 4 (2.44%) SAN
3 3 (1.83%) Multicast
4 2 (1.22%) Bluetooth
4 2 (1.22%) Ethernet
4 2 (1.22%) HTTP
4 2 (1.22%) HTTPS
4 2 (1.22%) RS-232
4 2 (1.22%) SSL
5 1 (0.61%) DNS
5 1 (0.61%) Firewall
5 1 (0.61%) Internet
5 1 (0.61%) NAS
5 1 (0.61%) Network Security
5 1 (0.61%) Reverse Proxy
5 1 (0.61%) SSH
5 1 (0.61%) Wireless
Database & Business Intelligence
1 9 (5.49%) PostgreSQL
2 6 (3.66%) Apache Cassandra
3 5 (3.05%) Amazon Aurora
3 5 (3.05%) MongoDB
3 5 (3.05%) RDBMS
3 5 (3.05%) Relational Database
4 4 (2.44%) NoSQL
5 3 (1.83%) Amazon Redshift
5 3 (1.83%) Redis
5 3 (1.83%) TimescaleDB
6 2 (1.22%) Metadata
7 1 (0.61%) Amazon RDS
7 1 (0.61%) Big Data
7 1 (0.61%) KDB
7 1 (0.61%) SQL Server
Development Applications
1 11 (6.71%) Git
2 7 (4.27%) Jenkins
3 6 (3.66%) GitLab
4 2 (1.22%) DTrace
4 2 (1.22%) GDB
5 1 (0.61%) JIRA
5 1 (0.61%) TeamCity
General
1 24 (14.63%) Social Skills
2 20 (12.20%) Finance
3 12 (7.32%) Analytical Skills
4 8 (4.88%) Games
5 7 (4.27%) Electronics
6 5 (3.05%) Legal
7 4 (2.44%) Front Office
7 4 (2.44%) Law
7 4 (2.44%) Retail
8 2 (1.22%) Inclusion and Diversity
8 2 (1.22%) Music Industry
8 2 (1.22%) Telecoms
9 1 (0.61%) Automotive
9 1 (0.61%) Banking
9 1 (0.61%) Influencing Skills
9 1 (0.61%) Investment Banking
9 1 (0.61%) Marketing
9 1 (0.61%) Organisational Skills
9 1 (0.61%) Pharmaceutical
9 1 (0.61%) Tech for Good
Job Titles
1 73 (44.51%) Software Engineer
2 46 (28.05%) Senior
3 41 (25.00%) Cloud Engineer
4 40 (24.39%) Cloud Native Engineer
4 40 (24.39%) Cloud Software Engineer
5 33 (20.12%) Developer
6 32 (19.51%) Senior Software Engineer
7 31 (18.90%) Lead
8 24 (14.63%) Lead Software Engineer
9 20 (12.20%) Lead Cloud Engineer
9 20 (12.20%) Senior Cloud Engineer
10 15 (9.15%) C++ Developer
11 14 (8.54%) Low Latency C++ Developer
12 11 (6.71%) Architect
12 11 (6.71%) C Developer
13 10 (6.10%) C++ Software Engineer
14 9 (5.49%) Technical Architect
15 8 (4.88%) Security Architect
15 8 (4.88%) Security Technical Architect
16 7 (4.27%) Java Developer
Libraries, Frameworks & Software Standards
1 11 (6.71%) .NET
2 7 (4.27%) HTML
2 7 (4.27%) Node.js
3 6 (3.66%) CSS
3 6 (3.66%) PyTorch
4 5 (3.05%) DirectX
4 5 (3.05%) OpenGL
4 5 (3.05%) React
5 4 (2.44%) ASP.NET Web API
5 4 (2.44%) Qt
5 4 (2.44%) Redux
5 4 (2.44%) TensorFlow
6 3 (1.83%) ActiveMQ
6 3 (1.83%) Bazel
6 3 (1.83%) Flask
6 3 (1.83%) jQuery
6 3 (1.83%) Plotly
6 3 (1.83%) Unreal Engine
6 3 (1.83%) Web Services
7 2 (1.22%) XML
Miscellaneous
1 53 (32.32%) Distributed Systems
2 41 (25.00%) Legacy Code
3 40 (24.39%) Cloud Native
4 11 (6.71%) Algorithms
4 11 (6.71%) IoT
5 10 (6.10%) PKI
6 9 (5.49%) FPGA
6 9 (5.49%) Greenfield Project
7 7 (4.27%) Data Structures
7 7 (4.27%) Foreign Exchange (FX)
8 5 (3.05%) 3D Graphics
8 5 (3.05%) Client/Server
8 5 (3.05%) Embedded Systems
8 5 (3.05%) Virtual Team
9 4 (2.44%) Clustering
9 4 (2.44%) Device Driver
9 4 (2.44%) Ray Tracing
10 3 (1.83%) ARM Cortex
11 2 (1.22%) Legacy Systems
11 2 (1.22%) Linux Command Line
Operating Systems
1 93 (56.71%) Linux
2 17 (10.37%) Windows
3 13 (7.93%) Android
4 8 (4.88%) Apple iOS
4 8 (4.88%) Unix
5 5 (3.05%) Ubuntu
6 4 (2.44%) Windows Server
6 4 (2.44%) Windows Server 2012
7 1 (0.61%) AIX
7 1 (0.61%) Debian
7 1 (0.61%) Embedded Linux
7 1 (0.61%) FreeRTOS
7 1 (0.61%) Mac OS
7 1 (0.61%) VxWorks
Processes & Methodologies
1 86 (52.44%) Software Engineering
2 31 (18.90%) Computer Science
3 30 (18.29%) Problem-Solving
4 23 (14.02%) Agile
5 19 (11.59%) Low Latency
6 18 (10.98%) Machine Learning
7 15 (9.15%) DevOps
8 14 (8.54%) CI/CD
8 14 (8.54%) Multithreading
9 13 (7.93%) Artificial Intelligence
9 13 (7.93%) Mathematics
10 12 (7.32%) Cryptography
10 12 (7.32%) Microservices
11 11 (6.71%) Cybersecurity
12 10 (6.10%) SDLC
13 9 (5.49%) Analytics
13 9 (5.49%) Data Cleansing
13 9 (5.49%) Data Science
13 9 (5.49%) Deep Learning
13 9 (5.49%) Statistics
Programming Languages
1 113 (68.90%) C++
2 57 (34.76%) Go
3 54 (32.93%) Python
4 48 (29.27%) Rust
5 33 (20.12%) Java
6 23 (14.02%) SQL
7 15 (9.15%) C#
8 13 (7.93%) JavaScript
9 8 (4.88%) PowerShell
10 6 (3.66%) Bash
10 6 (3.66%) PHP
11 4 (2.44%) Perl
11 4 (2.44%) Shell Script
12 3 (1.83%) Kotlin
13 2 (1.22%) MATLAB
13 2 (1.22%) OCaml
13 2 (1.22%) R
13 2 (1.22%) Ruby
13 2 (1.22%) SystemTap
14 1 (0.61%) ActionScript 2.0
Qualifications
1 34 (20.73%) Degree
2 7 (4.27%) Computer Science Degree
3 6 (3.66%) Master's Degree
3 6 (3.66%) PhD
4 2 (1.22%) MCAD
4 2 (1.22%) Microsoft Certification
4 2 (1.22%) Security Cleared
Quality Assurance & Compliance
1 3 (1.83%) Data Quality
2 2 (1.22%) QA
3 1 (0.61%) Accessibility
3 1 (0.61%) JTAG
System Software
1 10 (6.10%) Docker
2 9 (5.49%) Virtual Machines
3 7 (4.27%) Virtual Servers
3 7 (4.27%) VMware ESXi
4 6 (3.66%) Ceph
5 5 (3.05%) Firmware
6 4 (2.44%) Active Directory
6 4 (2.44%) Microsoft Virtual Server
6 4 (2.44%) VMware Infrastructure
6 4 (2.44%) vSphere
7 3 (1.83%) Hyper-V
7 3 (1.83%) KVM
8 2 (1.22%) Embedded Firmware
9 1 (0.61%) XenApp
Systems Management
1 51 (31.10%) Kubernetes
2 9 (5.49%) Terraform
3 8 (4.88%) Ansible
4 6 (3.66%) Knative
5 4 (2.44%) SCCM
5 4 (2.44%) SCOM
5 4 (2.44%) SCOrch
6 2 (1.22%) Grafana
6 2 (1.22%) Progress Chef
6 2 (1.22%) Puppet
7 1 (0.61%) Kibana
7 1 (0.61%) Nagios
7 1 (0.61%) Packer
7 1 (0.61%) Prometheus
7 1 (0.61%) SELinux
7 1 (0.61%) Single Sign-On
Vendors
1 12 (7.32%) Microsoft
2 8 (4.88%) Google
3 4 (2.44%) Cisco
3 4 (2.44%) NetApp
3 4 (2.44%) VMware
4 3 (1.83%) Apple
4 3 (1.83%) Commvault
4 3 (1.83%) NVIDIA
5 2 (1.22%) Oracle
5 2 (1.22%) Red Hat
6 1 (0.61%) Cadence
6 1 (0.61%) Citrix
6 1 (0.61%) F5
6 1 (0.61%) IBM
6 1 (0.61%) IBM Sterling
6 1 (0.61%) Imperva
6 1 (0.61%) New Relic
6 1 (0.61%) Perforce
6 1 (0.61%) Salesforce
6 1 (0.61%) Splunk