SAP Job Trends in London

SAP
England > London

The table below provides summary statistics for permanent job vacancies advertised in London requiring knowledge or experience of SAP products and/or services. It includes a benchmarking guide to the annual salaries offered in vacancies that cited SAP over the 6 months leading up to 22 November 2025, comparing them to the same period in the previous two years.

The figures below represent the IT labour market in general and are not representative of salaries within SAP SE.

6 months to
22 Nov 2025
Same period 2024 Same period 2023
Rank 98 138 126
Rank change year-on-year +40 -12 +43
Permanent jobs citing SAP 413 420 464
As % of all permanent jobs in London 3.19% 2.38% 2.45%
As % of the Vendors category 7.70% 6.20% 6.10%
Number of salaries quoted 217 214 343
10th Percentile £45,750 £53,750 £47,500
25th Percentile £60,000 £72,500 £58,750
Median annual salary (50th Percentile) £75,000 £90,000 £75,000
Median % change year-on-year -16.67% +20.00% -6.25%
75th Percentile £90,000 £101,250 £92,500
90th Percentile £100,000 £111,750 £102,500
England median annual salary £61,750 £70,000 £62,500
% change year-on-year -11.79% +12.00% -3.85%

All Vendors
London

SAP falls under the Vendor Products and Services category. For comparison with the information above, the following table provides summary statistics for all permanent job vacancies requiring knowledge or experience of all vendor products and services in London.

Permanent vacancies with a requirement for knowledge or experience of vendor products and services 5,361 6,774 7,603
As % of all permanent jobs advertised in London 41.38% 38.44% 40.15%
Number of salaries quoted 3,403 4,038 5,977
10th Percentile £34,000 £40,000 £36,250
25th Percentile £46,250 £52,500 £52,000
Median annual salary (50th Percentile) £70,000 £72,200 £69,447
Median % change year-on-year -3.05% +3.96% +0.91%
75th Percentile £87,500 £90,000 £87,500
90th Percentile £106,250 £112,500 £106,250
England median annual salary £51,000 £57,500 £55,000
% change year-on-year -11.30% +4.55% -4.35%

SAP
Job Vacancy Trend in London

Historical trend showing the proportion of permanent IT job postings citing SAP relative to all permanent IT jobs advertised in London.
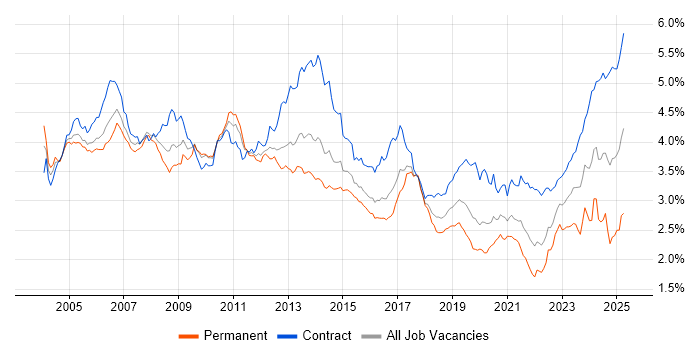
SAP job vacancy trend in London

SAP
Salary Trend in London

Salary distribution trend for jobs in London citing SAP.

Salary distribution trend for jobs in London citing SAP

SAP
Salary Histogram in London

Salary distribution for jobs citing SAP in London over the 6 months to 22 November 2025.

Salary histogram for SAP in London

SAP
Job Locations in London

The table below looks at the demand and provides a guide to the median salaries quoted in IT jobs citing SAP within the London region over the 6 months to 22 November 2025. The 'Rank Change' column provides an indication of the change in demand within each location based on the same 6 month period last year.

Location Rank Change
on Same Period
Last Year
Matching
Permanent
IT Job Ads
Median Salary
Past 6 Months
Median Salary
% Change
on Same Period
Last Year
Live
Jobs
Central London +34 39 £77,500 -8.82% 109
West London -2 7 £65,000 +8.33% 6
North London +6 2 £80,000 - 3
East London -13 1 £70,000 -17.65% 2
SAP
England

SAP
Co-Occurring Skills & Capabilities in London by Category

The following tables expand on the one above by listing co-occurrences grouped by category. They cover the same employment type, locality and period, with up to 20 co-occurrences shown in each category:

Application Platforms
1 15 (3.63%) Apache Spark
2 8 (1.94%) Confluence
3 4 (0.97%) Anypoint
4 3 (0.73%) Apache Airflow
5 1 (0.24%) Apache
5 1 (0.24%) CMS
5 1 (0.24%) Jupyter
5 1 (0.24%) Microsoft Exchange
5 1 (0.24%) Oracle Workflow
5 1 (0.24%) SAS
Applications
1 32 (7.75%) Maya
2 24 (5.81%) Microsoft Excel
3 5 (1.21%) Microsoft Office
3 5 (1.21%) Microsoft Project
3 5 (1.21%) MS Visio
4 4 (0.97%) Microsoft PowerPoint
Business Applications
1 163 (39.47%) SAP S/4HANA
2 37 (8.96%) SAP FI
3 36 (8.72%) SAP CO
3 36 (8.72%) SAP FI/CO
4 29 (7.02%) SAP IBP
5 15 (3.63%) Dynamics CRM
6 13 (3.15%) SAP FSCM
7 12 (2.91%) SAP IS-U
8 9 (2.18%) NetSuite
9 8 (1.94%) SAP FS
9 8 (1.94%) SAP MDG
9 8 (1.94%) SAP MM
9 8 (1.94%) SAP SCM
10 7 (1.69%) SAP CX
10 7 (1.69%) SAP ERP
11 5 (1.21%) SAP PP
11 5 (1.21%) SAP QM
11 5 (1.21%) Shopify
12 4 (0.97%) SAP HCM
12 4 (0.97%) SAP Oil and Gas
Cloud Services
1 58 (14.04%) Azure
2 44 (10.65%) AWS
3 31 (7.51%) GCP
4 29 (7.02%) Power Platform
5 17 (4.12%) Boomi
5 17 (4.12%) SuccessFactors
6 14 (3.39%) Azure Synapse Analytics
6 14 (3.39%) Salesforce Commerce Cloud
7 12 (2.91%) Microsoft 365
8 10 (2.42%) Dynamics 365
8 10 (2.42%) SaaS
9 8 (1.94%) IaaS
9 8 (1.94%) PaaS
10 7 (1.69%) Azure DevOps
11 5 (1.21%) GitHub
11 5 (1.21%) Power Automate
11 5 (1.21%) Serverless
12 4 (0.97%) GitHub Actions
12 4 (0.97%) iPaaS
12 4 (0.97%) Workato
Communications & Networking
1 9 (2.18%) Network Security
2 3 (0.73%) Firewall
3 2 (0.48%) DHCP
3 2 (0.48%) DNS
3 2 (0.48%) TCP/IP
3 2 (0.48%) VPN
4 1 (0.24%) HTTP
4 1 (0.24%) LAN
4 1 (0.24%) LTE
4 1 (0.24%) WAN
4 1 (0.24%) WebEx
4 1 (0.24%) Wireshark
Database & Business Intelligence
1 35 (8.47%) Data Warehouse
2 30 (7.26%) SAP BW
3 28 (6.78%) NoSQL
4 27 (6.54%) Power BI
5 22 (5.33%) Data Lake
6 18 (4.36%) Tableau
7 17 (4.12%) Amazon Redshift
8 16 (3.87%) Relational Database
8 16 (3.87%) SAP Data Services
9 15 (3.63%) Big Data
10 14 (3.39%) BusinessObjects
10 14 (3.39%) Metadata
11 13 (3.15%) Hadoop
12 12 (2.91%) PostgreSQL
13 11 (2.66%) RDBMS
14 8 (1.94%) SQL Server
15 6 (1.45%) SAP HANA
16 5 (1.21%) MongoDB
17 4 (0.97%) MySQL
18 3 (0.73%) Crystal Reports
Development Applications
1 36 (8.72%) JIRA
2 7 (1.69%) ER Studio
3 5 (1.21%) Jenkins
4 4 (0.97%) Postman
4 4 (0.97%) SoapUI
5 3 (0.73%) Cucumber
5 3 (0.73%) eCATT
5 3 (0.73%) GitLab
5 3 (0.73%) JMeter
5 3 (0.73%) LoadRunner
5 3 (0.73%) Selenium
6 1 (0.24%) CMake
6 1 (0.24%) Fiddler
6 1 (0.24%) Git
6 1 (0.24%) LSMW
6 1 (0.24%) MSBuild
General
1 246 (59.56%) Finance
2 187 (45.28%) Social Skills
3 115 (27.85%) Analytical Skills
4 111 (26.88%) Marketing
5 110 (26.63%) Manufacturing
6 102 (24.70%) Public Sector
7 84 (20.34%) Telecoms
8 79 (19.13%) Law
9 76 (18.40%) Electronics
10 41 (9.93%) Games
11 38 (9.20%) Presentation Skills
12 33 (7.99%) Retail
13 20 (4.84%) Legal
14 19 (4.60%) Banking
15 16 (3.87%) Influencing Skills
16 13 (3.15%) Automotive
16 13 (3.15%) Pharmaceutical
17 12 (2.91%) Organisational Skills
18 11 (2.66%) French Language
19 8 (1.94%) Dutch Language
Job Titles
1 94 (22.76%) Consultant
2 89 (21.55%) Senior
3 75 (18.16%) SAP Consultant
4 70 (16.95%) Lead
5 67 (16.22%) Architect
6 33 (7.99%) Senior Consultant
7 31 (7.51%) IT Architect
8 29 (7.02%) SAP Architect
9 28 (6.78%) SAP Manager
10 27 (6.54%) Senior SAP Consultant
11 22 (5.33%) IT Manager
11 22 (5.33%) Senior Architect
12 20 (4.84%) Developer
12 20 (4.84%) SAP Financial Consultant
13 18 (4.36%) IT Operations Manager
13 18 (4.36%) Operations Manager
13 18 (4.36%) Software Engineer
14 17 (4.12%) IT Support
14 17 (4.12%) IT Support Manager
14 17 (4.12%) Support Manager
Libraries, Frameworks & Software Standards
1 29 (7.02%) SAP Fiori
2 21 (5.08%) Middleware
3 19 (4.60%) REST
4 16 (3.87%) Kafka
5 13 (3.15%) FastAPI
6 12 (2.91%) Flask
7 7 (1.69%) RESTful
8 6 (1.45%) Node.js
9 5 (1.21%) SOAP
9 5 (1.21%) Web Services
10 4 (0.97%) JSON
10 4 (0.97%) SAPUI5
10 4 (0.97%) XML
11 3 (0.73%) IDoc
11 3 (0.73%) Oracle Fusion
11 3 (0.73%) Spring
11 3 (0.73%) Spring Boot
12 2 (0.48%) OAuth
12 2 (0.48%) RabbitMQ
12 2 (0.48%) SAP PI
Miscellaneous
1 51 (12.35%) Enterprise Software
2 20 (4.84%) Cloud Native
3 19 (4.60%) Analytical Mindset
3 19 (4.60%) FMCG
4 16 (3.87%) Product Ownership
5 15 (3.63%) Onboarding
6 9 (2.18%) Public Cloud
7 8 (1.94%) PMI
7 8 (1.94%) Reinsurance
8 7 (1.69%) Tandem
8 7 (1.69%) Virtual Team
9 6 (1.45%) Data Structures
9 6 (1.45%) Greenfield Project
10 5 (1.21%) IoT
10 5 (1.21%) Management Information System
10 5 (1.21%) Self-Motivation
11 4 (0.97%) Augmented Reality
11 4 (0.97%) Data Protection Act
11 4 (0.97%) Low-Code
12 3 (0.73%) Distributed Systems
Operating Systems
1 14 (3.39%) Windows
2 8 (1.94%) Linux
2 8 (1.94%) Unix
3 6 (1.45%) Windows Server
4 2 (0.48%) Mac OS
5 1 (0.24%) Windows 10
Processes & Methodologies
1 139 (33.66%) Business Intelligence
2 114 (27.60%) ERP
3 110 (26.63%) Problem-Solving
4 97 (23.49%) Analytics
5 85 (20.58%) Agile
6 84 (20.34%) Project Management
7 82 (19.85%) Programme Management
8 78 (18.89%) Digital Marketing
9 70 (16.95%) Stakeholder Management
10 67 (16.22%) Roadmaps
11 62 (15.01%) Cybersecurity
12 60 (14.53%) Stakeholder Engagement
13 56 (13.56%) Risk Management
14 55 (13.32%) Business Strategy
14 55 (13.32%) Project Delivery
15 51 (12.35%) Logistics
16 50 (12.11%) CI/CD
16 50 (12.11%) Decision-Making
16 50 (12.11%) Migration
17 46 (11.14%) AI
Programming Languages
1 59 (14.29%) SQL
2 44 (10.65%) Python
3 14 (3.39%) TypeScript
4 13 (3.15%) ABAP
5 11 (2.66%) C#
5 11 (2.66%) Java
6 9 (2.18%) JavaScript
7 8 (1.94%) C++
7 8 (1.94%) R
8 5 (1.21%) Shell Script
9 4 (0.97%) Bash
9 4 (0.97%) PowerShell
9 4 (0.97%) VBA
10 3 (0.73%) Groovy
11 2 (0.48%) C
12 1 (0.24%) Bicep
12 1 (0.24%) MATLAB
12 1 (0.24%) VB.NET
Qualifications
1 78 (18.89%) Degree
2 44 (10.65%) Security Cleared
3 39 (9.44%) PMI Certification
4 31 (7.51%) PMP
5 26 (6.30%) SAP Certification
6 24 (5.81%) SC Cleared
7 18 (4.36%) CISSP
7 18 (4.36%) DV Cleared
8 16 (3.87%) ACCA
9 13 (3.15%) Master's Degree
10 12 (2.91%) CIMA
11 7 (1.69%) MBA
12 6 (1.45%) Azure Certification
13 5 (1.21%) CISA
13 5 (1.21%) Computer Science Degree
14 3 (0.73%) AWS Certification
15 2 (0.48%) ISTQB
15 2 (0.48%) MCSE
15 2 (0.48%) Microsoft Certification
16 1 (0.24%) CAPM
Quality Assurance & Compliance
1 65 (15.74%) QA
2 31 (7.51%) GDPR
3 22 (5.33%) Data Quality
4 19 (4.60%) Cyber Essentials
4 19 (4.60%) IFRS
5 18 (4.36%) Cyber Essentials PLUS
6 10 (2.42%) IFRS 17
6 10 (2.42%) Solvency II
7 8 (1.94%) GAAP
8 6 (1.45%) GRC
8 6 (1.45%) ISO 9001
8 6 (1.45%) PMO
8 6 (1.45%) Sarbanes-Oxley
9 3 (0.73%) ITGC
9 3 (0.73%) NIST
10 2 (0.48%) Accessibility
10 2 (0.48%) GxP
10 2 (0.48%) ISO/IEC 27001
10 2 (0.48%) PCI DSS
11 1 (0.24%) MiFID
System Software
1 19 (4.60%) Docker
2 8 (1.94%) Active Directory
3 2 (0.48%) Hyper-V
3 2 (0.48%) VMware Infrastructure
4 1 (0.24%) IAG
4 1 (0.24%) Virtual Desktop
Systems Management
1 19 (4.60%) Kubernetes
2 15 (3.63%) Terraform
3 2 (0.48%) Prometheus
3 2 (0.48%) Single Sign-On
4 1 (0.24%) Active Directory Federation Services
4 1 (0.24%) Ansible
Vendors
1 57 (13.80%) Oracle
2 53 (12.83%) Microsoft
3 29 (7.02%) Salesforce
4 23 (5.57%) Ariba
5 20 (4.84%) Workday
6 19 (4.60%) MuleSoft
7 17 (4.12%) Dell
7 17 (4.12%) Google
8 16 (3.87%) Databricks
9 14 (3.39%) Adobe
9 14 (3.39%) ServiceNow
10 10 (2.42%) IFS
11 9 (2.18%) Palantir
12 8 (1.94%) Duck Creek
12 8 (1.94%) Epicor
12 8 (1.94%) Guidewire
13 5 (1.21%) Cisco
13 5 (1.21%) IBM
13 5 (1.21%) Informatica
13 5 (1.21%) Talend