Roadmaps Jobs in London

Roadmaps
England > London

The following table provides summary statistics for permanent job vacancies advertised in London with a requirement for Roadmaps skills. Included is a benchmarking guide to the salaries offered in vacancies that have cited Roadmaps over the 6 months to 2 December 2023 with a comparison to the same period in the previous 2 years.

6 months to
2 Dec 2023
Same period 2022 Same period 2021
Rank 25 21 29
Rank change year-on-year -4 +8 +14
Permanent jobs citing Roadmaps 1,570 4,721 4,671
As % of all permanent jobs advertised in London 8.45% 9.88% 9.03%
As % of the Processes & Methodologies category 9.03% 10.32% 9.39%
Number of salaries quoted 1,224 2,979 2,762
10th Percentile £56,219 £52,500 £51,250
25th Percentile £66,250 £64,643 £62,500
Median annual salary (50th Percentile) £85,000 £82,500 £77,500
Median % change year-on-year +3.03% +6.45% +3.33%
75th Percentile £107,500 £100,000 £97,500
90th Percentile £122,500 £120,000 £115,000
England median annual salary £75,000 £72,500 £70,000
% change year-on-year +3.45% +3.57% +7.69%

All Process and Methodology Skills
London

Roadmaps is in the Processes and Methodologies category. The following table is for comparison with the above and provides summary statistics for all permanent job vacancies advertised in London with a requirement for process or methodology skills.

Permanent vacancies with a requirement for process or methodology skills 17,388 45,752 49,722
As % of all permanent jobs advertised in London 93.57% 95.77% 96.16%
Number of salaries quoted 13,928 31,097 33,354
10th Percentile £42,000 £42,500 £42,180
25th Percentile £56,242 £55,000 £53,250
Median annual salary (50th Percentile) £75,000 £72,500 £70,000
Median % change year-on-year +3.45% +3.57% -
75th Percentile £95,000 £93,750 £90,000
90th Percentile £116,250 £112,500 £109,250
England median annual salary £60,000 £62,500 £60,000
% change year-on-year -4.00% +4.17% +9.09%

Roadmaps
Job Vacancy Trend in London

Job postings citing Roadmaps as a proportion of all IT jobs advertised in London.
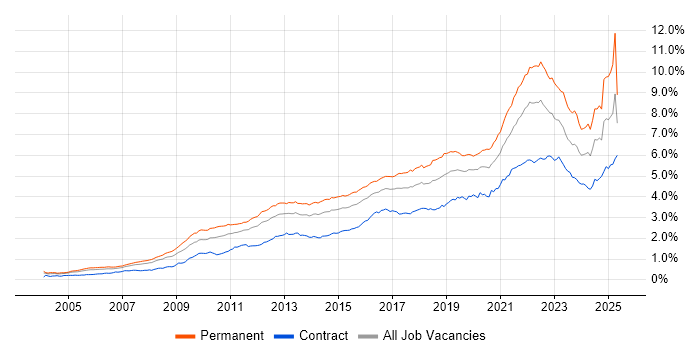
Job vacancy trend for Roadmaps in London

Roadmaps
Salary Trend in London

3-month moving average salary quoted in jobs citing Roadmaps in London.

Salary trend for Roadmaps in London

Roadmaps
Salary Histogram in London

Salary distribution for jobs citing Roadmaps in London over the 6 months to 2 December 2023.

Salary histogram for Roadmaps in London

Roadmaps
Job Locations in London

The table below looks at the demand and provides a guide to the median salaries quoted in IT jobs citing Roadmaps within the London region over the 6 months to 2 December 2023. The 'Rank Change' column provides an indication of the change in demand within each location based on the same 6 month period last year.

Location Rank Change
on Same Period
Last Year
Matching
Permanent
IT Job Ads
Median Salary
Past 6 Months
Median Salary
% Change
on Same Period
Last Year
Live
Jobs
Central London -4 269 £85,000 - 98
West London +13 32 £77,500 - 31
South London +15 24 £72,500 +11.54% 10
East London -3 16 £105,000 +44.83% 70
North London -13 4 £97,500 +14.71% 2
Roadmaps
England

Roadmaps
Co-occurring Skills and Capabilities in London by Category

The follow tables expand on the table above by listing co-occurrences grouped by category. The same employment type, locality and period is covered with up to 20 co-occurrences shown in each of the following categories:

Application Platforms
1 57 (3.63%) SharePoint
2 24 (1.53%) Confluence
3 15 (0.96%) CMS
4 9 (0.57%) Apache
5 6 (0.38%) Apache Spark
6 5 (0.32%) nginx
7 4 (0.25%) IIS
8 3 (0.19%) Apache Airflow
8 3 (0.19%) Oracle SOA Suite
8 3 (0.19%) WordPress
9 2 (0.13%) Adobe Experience Manager
9 2 (0.13%) Appian
9 2 (0.13%) Camunda
9 2 (0.13%) Drupal
9 2 (0.13%) Hedera
9 2 (0.13%) Moodle
9 2 (0.13%) MS Exchange
9 2 (0.13%) Oracle Workflow
10 1 (0.064%) OpenStack
10 1 (0.064%) WebSphere
Applications
1 47 (2.99%) Microsoft Office
2 16 (1.02%) Microsoft Excel
3 14 (0.89%) MS Visio
4 13 (0.83%) Microsoft PowerPoint
4 13 (0.83%) Microsoft Project
5 6 (0.38%) Chatbot
6 4 (0.25%) AutoCAD
6 4 (0.25%) Sketch
7 3 (0.19%) InVision
8 2 (0.13%) Adobe Creative Suite
8 2 (0.13%) Trello
Business Applications
1 41 (2.61%) Dynamics CRM
2 37 (2.36%) Endur
3 33 (2.10%) SAP S/4HANA
4 10 (0.64%) Distributed Ledger
5 6 (0.38%) SAP Business One
5 6 (0.38%) SAP CRM
5 6 (0.38%) SAP CX
5 6 (0.38%) SAP ERP
6 5 (0.32%) SAP GTS
6 5 (0.32%) SAP SCM
6 5 (0.32%) SAP SD
6 5 (0.32%) SAP WM
6 5 (0.32%) Workday HCM
7 4 (0.25%) HFM
7 4 (0.25%) Oracle ERP
7 4 (0.25%) SAP MM
7 4 (0.25%) SAP PM
8 3 (0.19%) Magento
8 3 (0.19%) Oracle Applications
8 3 (0.19%) Salesforce CRM
Cloud Services
1 417 (26.56%) Azure
2 215 (13.69%) AWS
3 159 (10.13%) SaaS
4 148 (9.43%) GCP
5 114 (7.26%) Microsoft 365
6 113 (7.20%) Power Platform
7 87 (5.54%) PaaS
8 82 (5.22%) IaaS
9 64 (4.08%) Azure DevOps
10 50 (3.18%) Serverless
11 46 (2.93%) Entra ID
12 40 (2.55%) Dynamics 365
13 37 (2.36%) GitHub
14 33 (2.10%) Azure Functions
15 25 (1.59%) Azure Service Bus
16 18 (1.15%) Azure Data Factory
16 18 (1.15%) dbt
17 16 (1.02%) Azure Cosmos DB
17 16 (1.02%) Azure Logic Apps
17 16 (1.02%) Azure Sentinel
Communications & Networking
1 52 (3.31%) Firewall
2 37 (2.36%) Network Security
3 36 (2.29%) WAN
4 35 (2.23%) Internet
5 34 (2.17%) DNS
6 33 (2.10%) LAN
7 26 (1.66%) VPN
8 19 (1.21%) SD-WAN
8 19 (1.21%) Wireless
9 17 (1.08%) DHCP
10 15 (0.96%) MPLS
11 13 (0.83%) TCP/IP
11 13 (0.83%) Unified Communications
12 12 (0.76%) Wi-Fi
13 11 (0.70%) NetScaler
14 10 (0.64%) Cisco IOS
15 9 (0.57%) WLAN
16 8 (0.51%) NX-OS
17 7 (0.45%) OSPF
17 7 (0.45%) SAN
Database & Business Intelligence
1 80 (5.10%) SQL Server
2 65 (4.14%) Data Warehouse
3 62 (3.95%) Power BI
4 45 (2.87%) NoSQL
5 43 (2.74%) Data Lake
6 36 (2.29%) Tableau
7 30 (1.91%) Metadata
8 29 (1.85%) Azure SQL Database
9 28 (1.78%) Relational Database
10 22 (1.40%) RDBMS
11 14 (0.89%) Data Mining
11 14 (0.89%) SQL Server Integration Services
12 13 (0.83%) Big Data
12 13 (0.83%) MongoDB
12 13 (0.83%) MySQL
12 13 (0.83%) Redis
13 12 (0.76%) Amazon QuickSight
14 11 (0.70%) PostgreSQL
15 9 (0.57%) SQL Server Reporting Services
16 7 (0.45%) BigQuery
Development Applications
1 47 (2.99%) JIRA
2 27 (1.72%) Git
3 25 (1.59%) Jenkins
4 23 (1.46%) Cypress.io
5 7 (0.45%) GitLab
6 6 (0.38%) Visual Studio
7 5 (0.32%) Bitbucket
7 5 (0.32%) ERwin
8 3 (0.19%) Atlassian Bamboo
8 3 (0.19%) Gradle
8 3 (0.19%) SQL Server Management Studio (SSMS)
8 3 (0.19%) Visual Studio Team System
9 2 (0.13%) Artifactory
9 2 (0.13%) Capybara
9 2 (0.13%) Cucumber
9 2 (0.13%) JUnit
9 2 (0.13%) Postman
9 2 (0.13%) Snyk
9 2 (0.13%) SonarQube
9 2 (0.13%) Subversion
General
1 536 (34.14%) Finance
2 400 (25.48%) Social Skills
3 187 (11.91%) Analytical Skills
4 137 (8.73%) Banking
5 136 (8.66%) Inclusion and Diversity
6 130 (8.28%) Marketing
7 123 (7.83%) Retail
8 61 (3.89%) Front Office
9 59 (3.76%) Law
10 48 (3.06%) Legal
11 46 (2.93%) Influencing Skills
12 40 (2.55%) Presentation Skills
13 34 (2.17%) Games
13 34 (2.17%) Telecoms
14 33 (2.10%) Back Office
14 33 (2.10%) Public Sector
15 31 (1.97%) Publishing
16 27 (1.72%) Investment Banking
17 23 (1.46%) Financial Institution
18 19 (1.21%) Manufacturing
Job Titles
1 387 (24.65%) Architect
2 218 (13.89%) Senior
3 201 (12.80%) Lead
4 138 (8.79%) Product Owner
5 133 (8.47%) Product Manager
6 123 (7.83%) Solutions Architect
7 116 (7.39%) Analyst
8 100 (6.37%) Developer
9 82 (5.22%) Enterprise Architect
10 66 (4.20%) Business Analyst
11 65 (4.14%) IT Manager
12 58 (3.69%) Senior Manager
13 53 (3.38%) Data Architect
14 52 (3.31%) Consultant
15 46 (2.93%) Software Engineer
16 39 (2.48%) Business Manager
16 39 (2.48%) Full Stack Developer
17 34 (2.17%) Senior Architect
18 32 (2.04%) Technical Architect
19 31 (1.97%) Data Manager
Libraries, Frameworks & Software Standards
1 102 (6.50%) React
2 74 (4.71%) .NET
3 72 (4.59%) Node.js
4 57 (3.63%) REST
5 38 (2.42%) CSS
6 36 (2.29%) Web Services
7 29 (1.85%) HTML
8 26 (1.66%) Redux
8 26 (1.66%) RESTful
9 25 (1.59%) JSON
10 21 (1.34%) Kafka
11 15 (0.96%) OpenID
11 15 (0.96%) XML
12 14 (0.89%) AngularJS
12 14 (0.89%) EDI
12 14 (0.89%) Middleware
12 14 (0.89%) Next.js
13 13 (0.83%) JWT
13 13 (0.83%) Vue
14 12 (0.76%) React Native
Miscellaneous
1 247 (15.73%) Product Ownership
2 60 (3.82%) Public Cloud
3 59 (3.76%) Data Centre
4 54 (3.44%) Fixed Income
5 48 (3.06%) Virtual Team
6 37 (2.36%) Blockchain
6 37 (2.36%) Enterprise Software
6 37 (2.36%) Greenfield Project
7 35 (2.23%) Derivative
8 33 (2.10%) Cloud Native
8 33 (2.10%) Management Information System
8 33 (2.10%) Onboarding
9 31 (1.97%) Foreign Exchange (FX)
10 30 (1.91%) Hedge funds
10 30 (1.91%) IoT
11 29 (1.85%) Equities
12 23 (1.46%) Mobile App
13 21 (1.34%) Data Structures
13 21 (1.34%) Hybrid Cloud
13 21 (1.34%) Mainframe
Operating Systems
1 76 (4.84%) Windows
2 41 (2.61%) Apple iOS
3 36 (2.29%) Linux
4 30 (1.91%) Windows Server
5 18 (1.15%) Android
6 17 (1.08%) Unix
7 13 (0.83%) Ubuntu
8 12 (0.76%) AIX
9 11 (0.70%) Red Hat Enterprise Linux
10 6 (0.38%) Windows Server 2012
11 5 (0.32%) Mac OS
11 5 (0.32%) Windows 10
12 4 (0.25%) VMS
13 3 (0.19%) Data ONTAP
13 3 (0.19%) HPUX
13 3 (0.19%) Solaris
14 2 (0.13%) Windows Server 2016
15 1 (0.064%) Windows Server 2008
Processes & Methodologies
1 642 (40.89%) Agile
2 328 (20.89%) Strategic Roadmap
3 279 (17.77%) Product Roadmap
4 232 (14.78%) Technology Roadmap
5 203 (12.93%) DevOps
6 183 (11.66%) Problem-Solving
6 183 (11.66%) Stakeholder Management
7 179 (11.40%) Analytics
8 175 (11.15%) Scrum
9 164 (10.45%) IT Strategy
10 152 (9.68%) Mentoring
10 152 (9.68%) User Experience
11 142 (9.04%) Technology Strategy
12 134 (8.54%) Enterprise Architecture
13 132 (8.41%) Artificial Intelligence
13 132 (8.41%) Software Engineering
14 128 (8.15%) Machine Learning
15 123 (7.83%) Data Modelling
15 123 (7.83%) User Stories
16 119 (7.58%) Project Management
Programming Languages
1 177 (11.27%) SQL
2 144 (9.17%) Python
3 97 (6.18%) JavaScript
4 88 (5.61%) Java
5 75 (4.78%) C#
6 65 (4.14%) TypeScript
7 56 (3.57%) PowerShell
8 26 (1.66%) Bash
9 22 (1.40%) VB
10 12 (0.76%) Kotlin
11 11 (0.70%) PHP
12 9 (0.57%) Search Processing Language
13 8 (0.51%) R
14 7 (0.45%) Go
15 6 (0.38%) Kusto Query Language
15 6 (0.38%) T-SQL
16 4 (0.25%) C++
16 4 (0.25%) VB.NET
17 3 (0.19%) Perl
17 3 (0.19%) XAML
Qualifications
1 164 (10.45%) Degree
2 38 (2.42%) Security Cleared
3 25 (1.59%) Cisco Certification
4 24 (1.53%) CISSP
5 23 (1.46%) Master's Degree
6 19 (1.21%) Computer Science Degree
7 17 (1.08%) SC Cleared
8 16 (1.02%) AWS Certification
9 15 (0.96%) CCNP
10 14 (0.89%) ITIL Certification
11 11 (0.70%) Microsoft Certification
11 11 (0.70%) TOGAF Certification
12 10 (0.64%) CISM
13 9 (0.57%) (ISC)2 CCSP
13 9 (0.57%) CCSP
14 8 (0.51%) PMI Certification
15 7 (0.45%) AWS Certified Solutions Architect
16 6 (0.38%) Azure Certification
16 6 (0.38%) CISA
17 5 (0.32%) PMP
Quality Assurance & Compliance
1 69 (4.39%) Data Quality
2 40 (2.55%) ISO/IEC 27001
2 40 (2.55%) QA
3 27 (1.72%) Cyber Essentials
4 23 (1.46%) GDPR
4 23 (1.46%) SLA
5 19 (1.21%) PCI DSS
6 16 (1.02%) Accessibility
6 16 (1.02%) Cyber Essentials PLUS
7 14 (0.89%) PMO
8 12 (0.76%) NIST
9 8 (0.51%) EMIR
9 8 (0.51%) MiFID
10 6 (0.38%) GAAP
10 6 (0.38%) ISO 9000
10 6 (0.38%) Sarbanes-Oxley
11 4 (0.25%) COBIT
12 2 (0.13%) Actionable Recommendations
12 2 (0.13%) GxP
12 2 (0.13%) WCAG
System Software
1 74 (4.71%) Active Directory
2 40 (2.55%) Docker
3 30 (1.91%) VMware Infrastructure
4 13 (0.83%) Virtual Machines
5 9 (0.57%) Virtual Desktop
6 6 (0.38%) IAG
7 4 (0.25%) Hyper-V
7 4 (0.25%) VMware ESXi
8 3 (0.19%) Forefront TMG
8 3 (0.19%) ISA Server
8 3 (0.19%) vSphere
9 2 (0.13%) Squid
9 2 (0.13%) Virtual Servers
10 1 (0.064%) BitLocker
10 1 (0.064%) Firmware
10 1 (0.064%) Microsoft Virtual Server
10 1 (0.064%) NFS
10 1 (0.064%) Varnish
10 1 (0.064%) VMware NSX
Systems Management
1 72 (4.59%) Kubernetes
2 43 (2.74%) Terraform
3 41 (2.61%) Microsoft Intune
4 22 (1.40%) SCCM
5 20 (1.27%) Ansible
6 10 (0.64%) Active Directory Federation Services
6 10 (0.64%) Cisco CUCM
7 9 (0.57%) Single Sign-On
8 6 (0.38%) Jamf Pro
9 5 (0.32%) Stealthwatch
10 4 (0.25%) NetBackup
10 4 (0.25%) WebSphere Cast Iron
11 3 (0.19%) vCenter Server
12 2 (0.13%) Backup Exec
12 2 (0.13%) Microsoft Data Protection Manager
12 2 (0.13%) SysTrack
13 1 (0.064%) Puppet
13 1 (0.064%) Salt
13 1 (0.064%) SCOM
13 1 (0.064%) ZABBIX
Vendors
1 276 (17.58%) Microsoft
2 66 (4.20%) SAP
3 64 (4.08%) Oracle
4 59 (3.76%) Google
5 52 (3.31%) Cisco
6 49 (3.12%) Salesforce
7 39 (2.48%) VMware
8 29 (1.85%) Palo Alto
9 23 (1.46%) Databricks
10 22 (1.40%) ServiceNow
11 21 (1.34%) OpenLink
12 19 (1.21%) Sybase
12 19 (1.21%) TIBCO
13 18 (1.15%) Splunk
14 16 (1.02%) F5
14 16 (1.02%) Informatica
15 13 (0.83%) Fortinet
16 12 (0.76%) Aruba
16 12 (0.76%) Meraki
16 12 (0.76%) Riverbed