Customer Requirements Jobs in the South East

Customer Requirements
England > South East

The table below provides summary statistics for permanent job vacancies advertised in the South East requiring Customer Requirements skills. It includes a benchmarking guide to the annual salaries offered in vacancies that cited Customer Requirements over the 6 months leading up to 26 July 2024, comparing them to the same period in the previous two years.

6 months to
26 Jul 2024
Same period 2023 Same period 2022
Rank 93 135 168
Rank change year-on-year +42 +33 +39
Permanent jobs citing Customer Requirements 405 290 490
As % of all permanent jobs advertised in the South East 2.68% 2.50% 2.22%
As % of the Processes & Methodologies category 3.29% 2.64% 2.33%
Number of salaries quoted 183 93 250
10th Percentile £32,000 £32,000 £29,938
25th Percentile £42,500 £36,713 £43,500
Median annual salary (50th Percentile) £45,680 £50,000 £53,850
Median % change year-on-year -8.64% -7.15% +0.19%
75th Percentile £61,250 £67,500 £65,000
90th Percentile £69,500 £87,500 £75,000
England median annual salary £50,000 £55,000 £55,000
% change year-on-year -9.09% - -4.35%

All Process and Methodology Skills
South East

Customer Requirements falls under the Processes and Methodologies category. For comparison with the information above, the following table provides summary statistics for all permanent job vacancies requiring process or methodology skills in the South East.

Permanent vacancies with a requirement for process or methodology skills 12,301 10,994 21,004
As % of all permanent jobs advertised in the South East 81.50% 94.87% 95.19%
Number of salaries quoted 8,138 7,007 11,964
10th Percentile £29,000 £30,500 £31,250
25th Percentile £38,620 £41,250 £41,250
Median annual salary (50th Percentile) £50,000 £55,000 £55,000
Median % change year-on-year -9.09% - +8.01%
75th Percentile £65,000 £71,250 £71,250
90th Percentile £80,000 £85,000 £82,500
England median annual salary £55,000 £62,000 £60,000
% change year-on-year -11.29% +3.33% +4.35%

Customer Requirements
Job Vacancy Trend in the South East

Job postings citing Customer Requirements as a proportion of all IT jobs advertised in the South East.
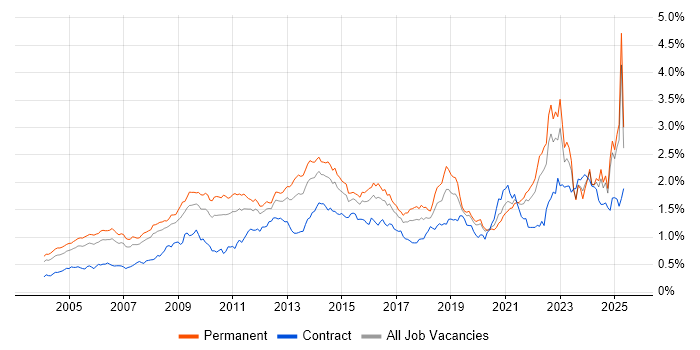
Job vacancy trend for Customer Requirements in the South East

Customer Requirements
Salary Trend in the South East

3-month moving average salary quoted in jobs citing Customer Requirements in the South East.

Salary trend for Customer Requirements in the South East

Customer Requirements
Salary Histogram in the South East

Salary distribution for jobs citing Customer Requirements in the South East over the 6 months to 26 July 2024.

Salary histogram for Customer Requirements in the South East

Customer Requirements
Job Locations in the South East

The table below looks at the demand and provides a guide to the median salaries quoted in IT jobs citing Customer Requirements within the South East region over the 6 months to 26 July 2024. The 'Rank Change' column provides an indication of the change in demand within each location based on the same 6 month period last year.

Location Rank Change
on Same Period
Last Year
Matching
Permanent
IT Job Ads
Median Salary
Past 6 Months
Median Salary
% Change
on Same Period
Last Year
Live
Jobs
Thames Valley +76 250 £45,000 -18.18% 32
Oxfordshire +25 125 £54,500 +9.00% 10
Buckinghamshire +65 97 £45,000 -47.06% 11
Hampshire +17 84 £54,250 +17.93% 29
Surrey -13 41 £45,680 -29.72% 7
Berkshire -9 28 £62,500 +19.05% 11
Kent -60 12 £32,500 -27.78% 7
West Sussex +8 6 £40,000 -20.00% 7
Isle of Wight - 5 £42,500 -
Middlesex - 4 - -
Sussex - 2 - - 1
East Sussex +19 1 - -
Customer Requirements
England

Customer Requirements
Co-occurring Skills and Capabilities in the South East by Category

The follow tables expand on the table above by listing co-occurrences grouped by category. The same employment type, locality and period is covered with up to 20 co-occurrences shown in each of the following categories:

Application Platforms
1 7 (1.73%) Kinematics
1 7 (1.73%) Microsoft Exchange
2 6 (1.48%) SharePoint
3 4 (0.99%) Apache
3 4 (0.99%) SAS
4 1 (0.25%) JBoss
4 1 (0.25%) WildFly
Applications
1 192 (47.41%) Microsoft Excel
2 142 (35.06%) Microsoft Office
3 6 (1.48%) InVision
3 6 (1.48%) Sketch
3 6 (1.48%) Spreadsheet
4 5 (1.23%) OrCAD
5 4 (0.99%) Microsoft PowerPoint
5 4 (0.99%) MS Visio
6 3 (0.74%) Simulink
6 3 (0.74%) Stateflow
Business Applications
1 4 (0.99%) SAP WM
1 4 (0.99%) Unit4 Business World
2 3 (0.74%) Oracle ERP
3 1 (0.25%) SAP S/4HANA
Cloud Services
1 22 (5.43%) SaaS
2 20 (4.94%) Microsoft 365
3 11 (2.72%) Azure
4 7 (1.73%) AWS
5 6 (1.48%) Entra ID
6 4 (0.99%) Azure DevOps
6 4 (0.99%) Power Platform
7 2 (0.49%) AWS CloudFormation
7 2 (0.49%) Figma
8 1 (0.25%) Cloud Computing
8 1 (0.25%) GCP
8 1 (0.25%) Google Workspace
8 1 (0.25%) SAP Fieldglass
Communications & Networking
1 24 (5.93%) Internet
2 14 (3.46%) Firewall
3 7 (1.73%) RFID
4 6 (1.48%) Intranet
4 6 (1.48%) WAN
5 5 (1.23%) 4G
5 5 (1.23%) DNS
5 5 (1.23%) TCP/IP
5 5 (1.23%) Unified Communications
5 5 (1.23%) Wi-Fi
6 4 (0.99%) 3G
6 4 (0.99%) 5G
6 4 (0.99%) BGP
6 4 (0.99%) DHCP
6 4 (0.99%) GPRS
6 4 (0.99%) Modbus
6 4 (0.99%) RS-232
6 4 (0.99%) RS-485
6 4 (0.99%) Wireless
6 4 (0.99%) Wireshark
Database & Business Intelligence
1 7 (1.73%) Big Data
2 4 (0.99%) PowerPivot
2 4 (0.99%) SQL Server
3 2 (0.49%) Amazon RDS
4 1 (0.25%) MySQL
4 1 (0.25%) Relational Database
Development Applications
1 16 (3.95%) Subversion
1 16 (3.95%) Visual Studio
2 13 (3.21%) Git
3 9 (2.22%) Rational DOORS
4 7 (1.73%) JIRA
5 4 (0.99%) Eclipse
6 3 (0.74%) Jenkins
7 2 (0.49%) Balsamiq
7 2 (0.49%) GitLab
8 1 (0.25%) Ant
8 1 (0.25%) Apache Ivy
8 1 (0.25%) Hudson
8 1 (0.25%) JUnit
8 1 (0.25%) Maven
8 1 (0.25%) Mockito
8 1 (0.25%) TestNG
General
1 179 (44.20%) Finance
2 159 (39.26%) Marketing
3 144 (35.56%) Analytical Skills
4 135 (33.33%) Retail
5 115 (28.40%) Social Skills
6 49 (12.10%) Electronics
7 14 (3.46%) Presentation Skills
8 13 (3.21%) Legal
8 13 (3.21%) Public Sector
9 12 (2.96%) Telecoms
10 11 (2.72%) Inclusion and Diversity
10 11 (2.72%) Manufacturing
11 6 (1.48%) Aerospace
12 5 (1.23%) Documentation Skills
13 4 (0.99%) Aviation
13 4 (0.99%) Local Government
13 4 (0.99%) Pharmaceutical
14 3 (0.74%) Automotive
14 3 (0.74%) Organisational Skills
15 2 (0.49%) Advertising
Job Titles
1 110 (27.16%) Development Manager
2 44 (10.86%) Systems Engineer
3 38 (9.38%) Senior
4 23 (5.68%) Architect
5 21 (5.19%) Support Engineer
6 19 (4.69%) Infrastructure Engineer
7 18 (4.44%) Analyst
7 18 (4.44%) Applications Engineer
8 16 (3.95%) Network Engineer
8 16 (3.95%) Software Engineer
9 15 (3.70%) Infrastructure Support
9 15 (3.70%) Infrastructure Support Engineer
9 15 (3.70%) Solutions Architect
9 15 (3.70%) VMware Engineer
9 15 (3.70%) VMware Infrastructure Engineer
9 15 (3.70%) VMware Support Engineer
10 13 (3.21%) Electronics Engineer
10 13 (3.21%) Principal Engineer
10 13 (3.21%) Principal Systems Engineer
11 12 (2.96%) Senior Network Engineer
Libraries, Frameworks & Software Standards
1 17 (4.20%) .NET
2 16 (3.95%) .NET Framework
2 16 (3.95%) Qt
3 8 (1.98%) XML
4 7 (1.73%) HTML
4 7 (1.73%) WPF
5 5 (1.23%) CSS
5 5 (1.23%) React
6 4 (0.99%) ActiveMQ
6 4 (0.99%) AngularJS
6 4 (0.99%) Django
6 4 (0.99%) Flash
6 4 (0.99%) JSON
6 4 (0.99%) Node.js
6 4 (0.99%) RabbitMQ
6 4 (0.99%) Web Services
6 4 (0.99%) WebSockets
6 4 (0.99%) ZeroMQ
7 3 (0.74%) Oracle Fusion
8 2 (0.49%) Elastic Stack
Miscellaneous
1 67 (16.54%) Management Information System
2 49 (12.10%) Self-Motivation
3 25 (6.17%) Robotics
4 23 (5.68%) IoT
5 17 (4.20%) Clustering
5 17 (4.20%) PKI
6 15 (3.70%) Product Ownership
7 13 (3.21%) Analogue Electronics
8 12 (2.96%) Data Centre
8 12 (2.96%) Distributed Systems
9 11 (2.72%) Embedded Systems
10 10 (2.47%) Algorithms
11 7 (1.73%) GNSS
12 6 (1.48%) NHS
12 6 (1.48%) Onboarding
13 5 (1.23%) Data Structures
14 4 (0.99%) Analytical Mindset
14 4 (0.99%) ARM Cortex
14 4 (0.99%) Hybrid Cloud
14 4 (0.99%) NB-IoT
Operating Systems
1 46 (11.36%) Windows
2 26 (6.42%) Linux
3 19 (4.69%) Windows Server
3 19 (4.69%) Windows Server 2012
4 12 (2.96%) Ubuntu
4 12 (2.96%) Windows 10
Processes & Methodologies
1 186 (45.93%) Business Development
2 182 (44.94%) Agile
3 146 (36.05%) Data Management
4 135 (33.33%) CAD
5 133 (32.84%) Logistics
6 131 (32.35%) Commercial Awareness
7 130 (32.10%) Facilities Management
7 130 (32.10%) Financial Modelling
8 88 (21.73%) Project Management
9 86 (21.23%) Collaborative Working
10 76 (18.77%) Problem-Solving
11 58 (14.32%) Decision-Making
12 55 (13.58%) Mentoring
13 54 (13.33%) Actionable Insight
14 51 (12.59%) Coaching
15 49 (12.10%) Process Management
16 47 (11.60%) Open Source
16 47 (11.60%) OSINT
17 32 (7.90%) DevOps
18 22 (5.43%) Cybersecurity
Programming Languages
1 42 (10.37%) C++
2 41 (10.12%) C
3 23 (5.68%) SQL
4 18 (4.44%) Python
5 17 (4.20%) ActionScript
5 17 (4.20%) PowerShell
5 17 (4.20%) VB
6 16 (3.95%) C#
7 8 (1.98%) JavaScript
8 7 (1.73%) XAML
9 4 (0.99%) Assembly Language
9 4 (0.99%) Go
10 3 (0.74%) Java
10 3 (0.74%) MATLAB
11 2 (0.49%) Bash
11 2 (0.49%) TypeScript
Qualifications
1 101 (24.94%) Degree
2 26 (6.42%) Security Cleared
3 6 (1.48%) Master's Degree
4 5 (1.23%) MBA
5 4 (0.99%) Azure Certification
5 4 (0.99%) SC Cleared
6 3 (0.74%) CCNA
6 3 (0.74%) Cisco Certification
7 2 (0.49%) CBAP
7 2 (0.49%) DBS Check
7 2 (0.49%) HND
7 2 (0.49%) IIBA
7 2 (0.49%) Microsoft Certification
8 1 (0.25%) CCNP
8 1 (0.25%) DV Cleared
8 1 (0.25%) JNCIA
8 1 (0.25%) NVQ Level 4
8 1 (0.25%) PgMP
8 1 (0.25%) PhD
8 1 (0.25%) PMI Certification
Quality Assurance & Compliance
1 51 (12.59%) PMO
2 23 (5.68%) SLA
3 22 (5.43%) QA
4 6 (1.48%) Accessibility
4 6 (1.48%) Actionable Recommendations
5 4 (0.99%) GDPR
5 4 (0.99%) IEC 61131
5 4 (0.99%) ISO/IEC 27001
5 4 (0.99%) JTAG
6 3 (0.74%) Automotive SPICE
6 3 (0.74%) ISO 26262
7 2 (0.49%) GRC
8 1 (0.25%) ISO/IEC 15288
System Software
1 34 (8.40%) Firmware
2 26 (6.42%) Active Directory
3 20 (4.94%) VMware Infrastructure
4 17 (4.20%) OpenSSH
4 17 (4.20%) VMware ESXi
4 17 (4.20%) vSphere
4 17 (4.20%) XenApp
5 6 (1.48%) Docker
6 5 (1.23%) Embedded Firmware
7 2 (0.49%) Hyper-V
Systems Management
1 17 (4.20%) IBM BigFix
1 17 (4.20%) PowerCLI
1 17 (4.20%) vCenter Server
2 13 (3.21%) Ansible
2 13 (3.21%) Terraform
3 4 (0.99%) Microsoft Intune
4 3 (0.74%) Endace
4 3 (0.74%) Functional Safety
5 2 (0.49%) Dell DRAC
5 2 (0.49%) Grafana
5 2 (0.49%) Kubernetes
5 2 (0.49%) Prometheus
6 1 (0.25%) Autotask
Vendors
1 180 (44.44%) Microsoft
2 20 (4.94%) VMware
3 17 (4.20%) Citrix
3 17 (4.20%) IBM
4 13 (3.21%) SAP
5 10 (2.47%) Adobe
6 6 (1.48%) Cisco
6 6 (1.48%) Hotjar
7 5 (1.23%) Juniper
7 5 (1.23%) Oracle
8 4 (0.99%) Apple
8 4 (0.99%) Dell
8 4 (0.99%) EMC
9 3 (0.74%) F5
9 3 (0.74%) Facebook
9 3 (0.74%) Instagram
9 3 (0.74%) Virgin Media
10 2 (0.49%) ServiceNow
10 2 (0.49%) Splunk
10 2 (0.49%) Thales