DV Cleared Jobs in the South East

Developed Vetting (DV) Clearance
England > South East

The table below provides summary statistics for permanent job vacancies advertised in the South East with a requirement for DV Cleared qualifications. It includes a benchmarking guide to the salaries offered over the 6 months leading up to 13 May 2025, comparing them to the same period in the previous two years.

6 months to
13 May 2025
Same period 2024 Same period 2023
Rank 70 79 169
Rank change year-on-year +9 +90 +100
Permanent jobs citing DV Cleared 360 531 288
As % of all permanent jobs advertised in the South East 3.82% 3.16% 1.98%
As % of the Qualifications category 6.77% 9.17% 5.01%
Number of salaries quoted 278 413 205
10th Percentile £41,775 £30,000 £27,900
25th Percentile £47,500 £36,250 £40,000
Median annual salary (50th Percentile) £55,000 £55,000 £49,500
Median % change year-on-year - +11.11% -10.81%
75th Percentile £77,500 £63,750 £65,750
90th Percentile £87,500 £77,500 £79,000
England median annual salary £57,500 £57,500 £56,549
% change year-on-year - +1.68% -1.65%

All Academic and Professional Certifications
South East

DV Cleared falls under the Academic Qualifications and Professional Certifications category. For comparison with the information above, the following table provides summary statistics for all permanent job vacancies requiring academic qualifications or professional certifications in the South East.

Permanent vacancies requiring academic qualifications or professional certifications 5,320 5,791 5,750
As % of all permanent jobs advertised in the South East 56.49% 34.45% 39.57%
Number of salaries quoted 2,440 3,639 2,569
10th Percentile £34,988 £29,750 £28,000
25th Percentile £45,000 £38,000 £36,250
Median annual salary (50th Percentile) £57,500 £51,500 £50,500
Median % change year-on-year +11.65% +1.98% -3.81%
75th Percentile £70,000 £67,500 £67,500
90th Percentile £78,750 £82,500 £85,000
England median annual salary £55,000 £55,000 £60,000
% change year-on-year - -8.33% +9.09%

DV Cleared
Job Vacancy Trend in the South East

Job postings citing DV Cleared as a proportion of all IT jobs advertised in the South East.
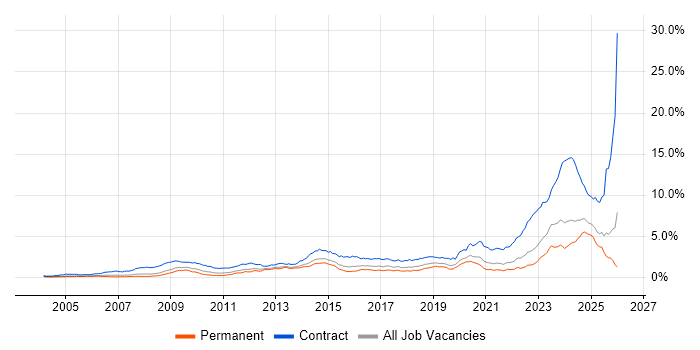
Job vacancy trend for DV Cleared in the South East

DV Cleared
Salary Trend in the South East

3-month moving average salary quoted in jobs citing DV Cleared in the South East.

Salary trend for DV Cleared in the South East

DV Cleared
Salary Histogram in the South East

Salary distribution for jobs citing DV Cleared in the South East over the 6 months to 13 May 2025.

Salary histogram for DV Cleared in the South East

DV Cleared
Job Locations in the South East

The table below looks at the demand and provides a guide to the median salaries quoted in IT jobs citing DV Cleared within the South East region over the 6 months to 13 May 2025. The 'Rank Change' column provides an indication of the change in demand within each location based on the same 6 month period last year.

Location Rank Change
on Same Period
Last Year
Matching
Permanent
IT Job Ads
Median Salary
Past 6 Months
Median Salary
% Change
on Same Period
Last Year
Live
Jobs
Hampshire +33 291 £55,000 -4.35% 98
Surrey +52 31 £40,000 -33.33% 43
Thames Valley -101 29 £55,500 +5.71% 80
Berkshire -88 16 £52,250 -3.24% 59
Buckinghamshire +5 7 £57,835 +112.04% 15
Oxfordshire +38 6 £51,750 +59.23% 18
Kent - 4 - - 17
East Sussex +32 3 - - 6
West Sussex - 1 - - 6
DV Cleared
England

DV Cleared
Co-occurring Skills and Capabilities in the South East by Category

The follow tables expand on the table above by listing co-occurrences grouped by category. The same employment type, locality and period is covered with up to 20 co-occurrences shown in each of the following categories:

Application Platforms
1 24 (6.67%) Microsoft Exchange
2 4 (1.11%) SharePoint
3 2 (0.56%) Apache
3 2 (0.56%) Exchange Server 2013
3 2 (0.56%) Office Communications Server
3 2 (0.56%) Skype for Business
4 1 (0.28%) Exchange Server 2007
4 1 (0.28%) Exchange Server 2010
4 1 (0.28%) OpenStack
4 1 (0.28%) SharePoint 2010
4 1 (0.28%) SharePoint Server
Applications
1 4 (1.11%) Microsoft Excel
2 1 (0.28%) Microsoft Office
2 1 (0.28%) OrCAD
Cloud Services
1 38 (10.56%) AWS
1 38 (10.56%) Azure
2 35 (9.72%) IaaS
3 18 (5.00%) Amazon EKS
3 18 (5.00%) AWS CloudFormation
4 6 (1.67%) GCP
4 6 (1.67%) OpenShift
4 6 (1.67%) SaaS
5 4 (1.11%) Power Platform
6 3 (0.83%) Microsoft 365
6 3 (0.83%) PaaS
7 2 (0.56%) PowerApps
8 1 (0.28%) Azure Sentinel
8 1 (0.28%) Cloud Computing
Communications & Networking
1 64 (17.78%) BGP
2 63 (17.50%) OSPF
3 62 (17.22%) Firewall
4 59 (16.39%) EIGRP
5 55 (15.28%) Network Security
6 35 (9.72%) VSAN
7 20 (5.56%) Cisco ASA
7 20 (5.56%) SAN
8 18 (5.00%) NAS
9 16 (4.44%) DNS
10 15 (4.17%) DHCP
11 13 (3.61%) VPN
12 12 (3.33%) DMVPN
13 8 (2.22%) SMTP
13 8 (2.22%) TCP/IP
14 7 (1.94%) Ethernet VPN
14 7 (1.94%) SSL
15 6 (1.67%) Cisco Firepower
15 6 (1.67%) IPsec
15 6 (1.67%) Remote Desktop
Database & Business Intelligence
1 18 (5.00%) Elasticsearch
2 6 (1.67%) Amazon RDS
2 6 (1.67%) PostgreSQL
3 4 (1.11%) Power BI
4 3 (0.83%) SQL Server
5 2 (0.56%) Metadata
5 2 (0.56%) Tableau
Development Applications
1 11 (3.06%) MSI
2 7 (1.94%) Jenkins
3 6 (1.67%) GitLab
3 6 (1.67%) Robot Framework
4 5 (1.39%) Git
5 1 (0.28%) Babel
5 1 (0.28%) Octopus Deploy
5 1 (0.28%) Subversion
5 1 (0.28%) Vite
5 1 (0.28%) webpack
General
1 64 (17.78%) Inclusion and Diversity
2 29 (8.06%) Social Skills
3 24 (6.67%) Analytical Skills
4 9 (2.50%) Advertising
5 6 (1.67%) Finance
6 5 (1.39%) Telecoms
7 3 (0.83%) Documentation Skills
7 3 (0.83%) Military
7 3 (0.83%) Presentation Skills
7 3 (0.83%) Public Sector
8 2 (0.56%) Legal
8 2 (0.56%) Organisational Skills
8 2 (0.56%) Retail
9 1 (0.28%) Aerospace
9 1 (0.28%) Electronics
Job Titles
1 98 (27.22%) Network Engineer
2 48 (13.33%) Architect
3 38 (10.56%) VMware Specialist
4 34 (9.44%) Security Engineer
5 30 (8.33%) Support Engineer
6 26 (7.22%) Network Security Engineer
7 25 (6.94%) Infrastructure Engineer
8 23 (6.39%) Designer
9 19 (5.28%) Developer
9 19 (5.28%) Infrastructure Support
9 19 (5.28%) Infrastructure Support Engineer
9 19 (5.28%) Software Developer
10 18 (5.00%) Head of AI
10 18 (5.00%) Head of Analytics
11 17 (4.72%) 3rd Line Engineer
11 17 (4.72%) Infrastructure Architect
12 16 (4.44%) Software Engineer
13 15 (4.17%) 2nd Line Engineer
13 15 (4.17%) 3rd Line Network Engineer
13 15 (4.17%) Senior
Libraries, Frameworks & Software Standards
1 18 (5.00%) .NET
1 18 (5.00%) Node.js
1 18 (5.00%) Pandas
2 9 (2.50%) React
3 6 (1.67%) Django
4 3 (0.83%) LDAP
4 3 (0.83%) REST
4 3 (0.83%) SAML
4 3 (0.83%) SOAP
5 2 (0.56%) AngularJS
5 2 (0.56%) HTML
5 2 (0.56%) Hugging Face
5 2 (0.56%) Leaflet
5 2 (0.56%) Web Services
6 1 (0.28%) CSS
6 1 (0.28%) HTML5
6 1 (0.28%) JSON
6 1 (0.28%) RESTful
6 1 (0.28%) Spring
6 1 (0.28%) XML
Miscellaneous
1 21 (5.83%) Clustering
1 21 (5.83%) Cyberattack
2 14 (3.89%) PKI
3 11 (3.06%) Algorithms
4 10 (2.78%) Data Centre
5 6 (1.67%) Legacy Systems
6 4 (1.11%) Management Information System
7 3 (0.83%) Private Cloud
7 3 (0.83%) Self-Motivation
8 2 (0.56%) Cyber Threat
8 2 (0.56%) Freedom of Information
8 2 (0.56%) Freedom of Information Act
8 2 (0.56%) Greenfield Project
8 2 (0.56%) Linux Command Line
8 2 (0.56%) Replication
9 1 (0.28%) CCTV
9 1 (0.28%) CESG
9 1 (0.28%) FPGA
9 1 (0.28%) VHDL
9 1 (0.28%) Video Conferencing
Operating Systems
1 92 (25.56%) Windows
2 60 (16.67%) Linux
3 44 (12.22%) Windows Server
4 18 (5.00%) Android
5 9 (2.50%) Unix
6 6 (1.67%) Rocky
7 5 (1.39%) Red Hat Enterprise Linux
8 4 (1.11%) Windows Server 2003
9 3 (0.83%) CentOS
10 1 (0.28%) Ubuntu
10 1 (0.28%) Windows 10
10 1 (0.28%) Windows Server 2016
Processes & Methodologies
1 59 (16.39%) Agile
2 44 (12.22%) Line Management
3 38 (10.56%) Infrastructure Engineering
4 35 (9.72%) Risk Management
5 34 (9.44%) Software Engineering
6 30 (8.33%) Mathematics
7 26 (7.22%) Problem-Solving
8 25 (6.94%) Artificial Intelligence
9 24 (6.67%) Containerisation
9 24 (6.67%) High Availability
10 23 (6.39%) Cybersecurity
10 23 (6.39%) Decision-Making
11 20 (5.56%) Analytics
11 20 (5.56%) CI/CD
11 20 (5.56%) Collaborative Working
12 19 (5.28%) Kanban
13 18 (5.00%) OOP
13 18 (5.00%) OWASP
13 18 (5.00%) Performance Management
13 18 (5.00%) Statistics
Programming Languages
1 91 (25.28%) PowerShell
2 75 (20.83%) Python
3 34 (9.44%) C++
4 31 (8.61%) JavaScript
5 21 (5.83%) Java
6 18 (5.00%) Go
6 18 (5.00%) Rust
7 12 (3.33%) Bash
7 12 (3.33%) SQL
8 10 (2.78%) C
9 8 (2.22%) Fortran
10 4 (1.11%) TypeScript
11 2 (0.56%) Kusto Query Language
11 2 (0.56%) PHP
11 2 (0.56%) VBA
12 1 (0.28%) Embedded C
12 1 (0.28%) Embedded C++
Qualifications
1 360 (100.00%) Security Cleared
2 186 (51.67%) SC Cleared
3 27 (7.50%) Degree
4 21 (5.83%) Cisco Certification
5 12 (3.33%) CCNP
6 11 (3.06%) CCNA
6 11 (3.06%) Master's Degree
7 10 (2.78%) PhD
8 8 (2.22%) VMware Certified Professional (VCP)
9 7 (1.94%) HND
10 6 (1.67%) CISSP
11 3 (0.83%) CESG Certified Professional
12 2 (0.56%) APMP
12 2 (0.56%) CISMP
12 2 (0.56%) Computer Science Degree
12 2 (0.56%) PRINCE2 Practitioner
12 2 (0.56%) VCAP
13 1 (0.28%) GCIA
13 1 (0.28%) GCIH
13 1 (0.28%) JNCIS
Quality Assurance & Compliance
1 5 (1.39%) QA
2 3 (0.83%) PMBOK
3 1 (0.28%) Accessibility
3 1 (0.28%) ISO 22301
3 1 (0.28%) JSP 440
3 1 (0.28%) RMADS
System Software
1 82 (22.78%) VMware Infrastructure
2 49 (13.61%) Active Directory
3 46 (12.78%) vSphere
4 39 (10.83%) Docker
5 33 (9.17%) VMware NSX
6 20 (5.56%) Hyper-V
7 18 (5.00%) VMware ESXi
8 8 (2.22%) BitLocker
8 8 (2.22%) Microsoft App-V
8 8 (2.22%) Terminal Services
9 2 (0.56%) ISA Server
9 2 (0.56%) Virtual Machines
10 1 (0.28%) Firmware
10 1 (0.28%) NFS
10 1 (0.28%) vCloud
Systems Management
1 39 (10.83%) Ansible
2 34 (9.44%) Kubernetes
3 26 (7.22%) Terraform
4 25 (6.94%) FortiGate
5 17 (4.72%) vCenter Server
6 14 (3.89%) vMotion
7 13 (3.61%) WMI
8 12 (3.33%) Puppet
9 11 (3.06%) Active Directory Federation Services
9 11 (3.06%) Single Sign-On
9 11 (3.06%) vRealize
10 7 (1.94%) PowerCLI
11 6 (1.67%) Nagios
12 4 (1.11%) vRealize Orchestrator
13 3 (0.83%) SCCM
14 1 (0.28%) Nessus
14 1 (0.28%) SCOM
Vendors
1 116 (32.22%) Cisco
2 89 (24.72%) VMware
3 74 (20.56%) Juniper
4 54 (15.00%) Fortinet
5 49 (13.61%) Microsoft
6 15 (4.17%) Citrix
6 15 (4.17%) Forcepoint
7 13 (3.61%) SolarWinds
8 12 (3.33%) HP
9 10 (2.78%) Red Hat
10 8 (2.22%) Splunk
11 6 (1.67%) Google
11 6 (1.67%) Symantec
11 6 (1.67%) Veeam
12 5 (1.39%) McAfee
13 3 (0.83%) EMC
13 3 (0.83%) ServiceNow
13 3 (0.83%) SevOne
14 2 (0.56%) F5
14 2 (0.56%) Thales