Risk Analysis Jobs with Work from Home Options

Risk Analysis
UK > Work from Home

The table below provides summary statistics for permanent job vacancies with an option to work from home (WFH) and a requirement for Risk Analysis skills. Included is a benchmarking guide to the salaries offered in vacancies that have cited Risk Analysis over the 6 months to 5 May 2024 with a comparison to the same period in the previous 2 years.

6 months to
5 May 2024
Same period 2023 Same period 2022
Rank 513 552 627
Rank change year-on-year +39 +75 -119
Permanent jobs citing Risk Analysis 72 107 210
As % of all permanent jobs with a WFH option 0.21% 0.25% 0.31%
As % of the Processes & Methodologies category 0.23% 0.26% 0.32%
Number of salaries quoted 54 72 121
10th Percentile £36,625 £47,750 £40,625
25th Percentile £51,063 £55,313 £46,250
Median annual salary (50th Percentile) £60,000 £70,000 £60,000
Median % change year-on-year -14.29% +16.67% +20.00%
75th Percentile £72,500 £85,938 £65,000
90th Percentile £75,125 £112,500 £118,750
UK median annual salary £60,000 £65,000 £62,500
% change year-on-year -7.69% +4.00% +4.17%

All Process and Methodology Skills
Work from Home

Risk Analysis is in the Processes and Methodologies category. The following table is for comparison with the above and provides summary statistics for all permanent job vacancies with a WFH option and a requirement for process or methodology skills.

Permanent vacancies with a requirement for process or methodology skills 30,949 40,734 65,929
As % of all permanent jobs with a WFH option 91.59% 96.10% 96.90%
Number of salaries quoted 23,494 28,287 41,473
10th Percentile £33,750 £37,500 £36,250
25th Percentile £42,500 £47,500 £45,617
Median annual salary (50th Percentile) £57,500 £62,500 £60,000
Median % change year-on-year -8.00% +4.17% +9.09%
75th Percentile £75,000 £82,500 £80,000
90th Percentile £95,000 £100,000 £95,000
UK median annual salary £55,000 £61,500 £60,000
% change year-on-year -10.57% +2.50% +9.09%

Risk Analysis
Trend for Jobs with a WFH Option

Job vacancies with a work from home option citing Risk Analysis as a proportion of all IT jobs advertised.
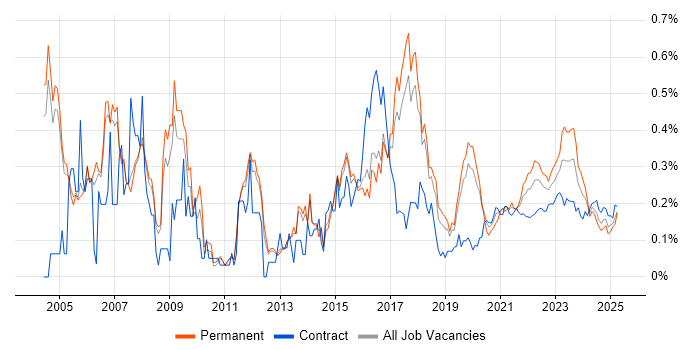
Risk Analysis trend for jobs with a WFH option

Risk Analysis
Salary Trend for Jobs with a WFH Option

3-month moving average salary quoted in job vacancies with a work from home option citing Risk Analysis.

Risk Analysis salary trend for jobs with a WFH option

Risk Analysis
Salary Histogram for Jobs with a WFH Option

Salary distribution for jobs with a work from home option citing Risk Analysis over the 6 months to 5 May 2024.

Risk Analysis salary histogram for jobs with a WFH option

Risk Analysis
Co-occurring Skills and Capabilities with WFH Options by Category

The follow tables expand on the table above by listing co-occurrences grouped by category. The same employment type, locality and period is covered with up to 20 co-occurrences shown in each of the following categories:

Application Platforms
1 7 (9.72%) Microsoft Exchange
2 3 (4.17%) SharePoint
3 1 (1.39%) IIS
Applications
1 10 (13.89%) Microsoft Office
2 3 (4.17%) Microsoft Excel
3 2 (2.78%) Trello
4 1 (1.39%) Microsoft PowerPoint
4 1 (1.39%) MS Visio
Business Applications
1 2 (2.78%) Dynamics CRM
1 2 (2.78%) Primavera
Cloud Services
1 24 (33.33%) Azure
2 7 (9.72%) Microsoft 365
3 3 (4.17%) Power Platform
3 3 (4.17%) Salesforce Service Cloud
4 2 (2.78%) AWS
4 2 (2.78%) Azure DevOps
4 2 (2.78%) Dynamics 365
4 2 (2.78%) OCI
4 2 (2.78%) PowerApps
Communications & Networking
1 24 (33.33%) Firewall
2 13 (18.06%) Intrusion Detection
3 6 (8.33%) Wireshark
4 2 (2.78%) Extranet
4 2 (2.78%) Intranet
5 1 (1.39%) LAN
5 1 (1.39%) WAN
Database & Business Intelligence
1 4 (5.56%) Data Warehouse
1 4 (5.56%) DTS
1 4 (5.56%) Relational Database
2 3 (4.17%) Power BI
3 1 (1.39%) SQL Server
Development Applications
1 2 (2.78%) JIRA
1 2 (2.78%) Rational DOORS
General
1 24 (33.33%) Social Skills
2 18 (25.00%) Law
3 13 (18.06%) Finance
4 12 (16.67%) Legal
5 10 (13.89%) Analytical Skills
6 8 (11.11%) Presentation Skills
7 5 (6.94%) Inclusion and Diversity
7 5 (6.94%) Telecoms
8 4 (5.56%) Games
8 4 (5.56%) Local Government
8 4 (5.56%) Retail
9 3 (4.17%) Influencing Skills
9 3 (4.17%) Organisational Skills
10 2 (2.78%) Advertising
11 1 (1.39%) Public Sector
11 1 (1.39%) Publishing
Job Titles
1 23 (31.94%) Analyst
2 17 (23.61%) Lead
3 13 (18.06%) Team Leader
4 9 (12.50%) Security Analyst
5 7 (9.72%) Business Analyst
5 7 (9.72%) Senior
6 6 (8.33%) Architect
6 6 (8.33%) Cybersecurity Analyst
6 6 (8.33%) Email Analyst
6 6 (8.33%) IT Analyst
6 6 (8.33%) IT Security Analyst
6 6 (8.33%) Vulnerability Analyst
6 6 (8.33%) Vulnerability Management Analyst
7 5 (6.94%) Risk Analyst
8 4 (5.56%) Lead Architect
8 4 (5.56%) Penetration Tester
8 4 (5.56%) Senior Analyst
8 4 (5.56%) Technical Analyst
8 4 (5.56%) Technical Business Analyst
8 4 (5.56%) Technical Leader
Libraries, Frameworks & Software Standards
1 3 (4.17%) Lightning Web Components
Miscellaneous
1 19 (26.39%) Management Information System
2 8 (11.11%) Cyber Threat
3 6 (8.33%) Security Posture
4 5 (6.94%) Onboarding
5 3 (4.17%) Product Ownership
6 2 (2.78%) Cyber Defence
6 2 (2.78%) Cyber Kill Chain
6 2 (2.78%) Operational Technology
7 1 (1.39%) Cyber Security Posture
7 1 (1.39%) EPoS
7 1 (1.39%) SCADA
Operating Systems
1 3 (4.17%) Linux
2 2 (2.78%) AIX
2 2 (2.78%) Red Hat Enterprise Linux
2 2 (2.78%) Unix
2 2 (2.78%) Windows
3 1 (1.39%) Windows Server
3 1 (1.39%) Windows Server 2012
Processes & Methodologies
1 33 (45.83%) Cybersecurity
2 26 (36.11%) Incident Response
3 21 (29.17%) SIEM
4 17 (23.61%) Migration
5 16 (22.22%) ITIL
6 14 (19.44%) ISMS
6 14 (19.44%) Risk Management
7 13 (18.06%) Cryptography
7 13 (18.06%) Kalman Filter
7 13 (18.06%) Social Engineering
8 12 (16.67%) Change Management
8 12 (16.67%) Project Delivery
9 11 (15.28%) Security Operations
10 10 (13.89%) Data Security
10 10 (13.89%) Information Security
11 9 (12.50%) Agile
11 9 (12.50%) Business Analysis
11 9 (12.50%) Data Protection
11 9 (12.50%) Problem-Solving
11 9 (12.50%) Use Case
Programming Languages
1 1 (1.39%) SQL
Qualifications
1 15 (20.83%) Degree
2 10 (13.89%) Security Cleared
3 7 (9.72%) SC Cleared
4 4 (5.56%) CISSP
4 4 (5.56%) Computer Science Degree
5 3 (4.17%) BPSS Clearance
5 3 (4.17%) CISA
5 3 (4.17%) CRISC
5 3 (4.17%) DV Cleared
6 2 (2.78%) CISM
6 2 (2.78%) FFIEC
6 2 (2.78%) Master's Degree
6 2 (2.78%) Microsoft Certification
6 2 (2.78%) Network+ Certification
6 2 (2.78%) PhD
6 2 (2.78%) SANS
7 1 (1.39%) IIBA
7 1 (1.39%) PMI Certification
7 1 (1.39%) PMP
Quality Assurance & Compliance
1 12 (16.67%) PCI DSS
2 10 (13.89%) ISO/IEC 27001
3 9 (12.50%) GDPR
4 7 (9.72%) GRC
5 6 (8.33%) NCSC
5 6 (8.33%) NIST
6 3 (4.17%) QA
7 2 (2.78%) COBIT
7 2 (2.78%) Cyber Essentials
7 2 (2.78%) ECSS
7 2 (2.78%) GLBA
7 2 (2.78%) JSP 440
7 2 (2.78%) NIST 800
7 2 (2.78%) Sarbanes-Oxley
8 1 (1.39%) RMADS
System Software
1 1 (1.39%) Active Directory
1 1 (1.39%) VMware ESXi
1 1 (1.39%) VMware Infrastructure
Systems Management
1 6 (8.33%) CSIRT
Vendors
1 13 (18.06%) Microsoft
2 6 (8.33%) Qualys
3 4 (5.56%) Dell
4 3 (4.17%) Cisco
4 3 (4.17%) Salesforce
5 2 (2.78%) ArcSight
5 2 (2.78%) LogRhythm
5 2 (2.78%) McAfee
5 2 (2.78%) Oracle
5 2 (2.78%) Red Hat
5 2 (2.78%) Sophos
5 2 (2.78%) Splunk
5 2 (2.78%) Tripwire
6 1 (1.39%) Cadence
6 1 (1.39%) Citrix
6 1 (1.39%) Fortinet
6 1 (1.39%) Rapid7
6 1 (1.39%) VMware