Hybrid/Remote IT Strategy Job Trends

IT/Technology Strategy
UK > Work from Home

The table below provides summary statistics and salary benchmarking for remote or hybrid work requiring IT Strategy skills. It covers permanent job vacancies from the 6 months leading up to 7 November 2025, with comparisons to the same periods in the previous two years.

6 months to
7 Nov 2025
Same period 2024 Same period 2023
Rank 212 195 169
Rank change year-on-year -17 -26 +48
Permanent jobs citing IT Strategy 213 321 448
As % of all permanent jobs with remote/hybrid work options 1.33% 1.61% 2.04%
As % of the Processes & Methodologies category 1.44% 1.82% 2.15%
Number of salaries quoted 137 173 341
10th Percentile £24,570 £47,500 £46,250
25th Percentile £25,203 £60,000 £57,500
Median annual salary (50th Percentile) £66,500 £79,932 £75,000
Median % change year-on-year -16.80% +6.58% +4.17%
75th Percentile £82,500 £95,000 £95,000
90th Percentile £131,000 £116,000 £115,000
UK median annual salary £75,000 £77,500 £74,056
% change year-on-year -3.23% +4.65% -1.26%

All Process and Methodology Skills
Work from Home

IT Strategy falls under the Processes and Methodologies category. For comparison with the information above, the following table provides summary statistics for all permanent job vacancies with remote or hybrid options requiring process or methodology skills.

Permanent vacancies with a requirement for process or methodology skills 14,816 17,600 20,873
As % of all permanent jobs with a WFH option 92.52% 88.21% 95.01%
Number of salaries quoted 8,697 10,499 16,904
10th Percentile £29,250 £36,000 £37,000
25th Percentile £40,000 £46,250 £47,250
Median annual salary (50th Percentile) £57,500 £62,500 £62,500
Median % change year-on-year -8.00% - -
75th Percentile £77,500 £81,250 £80,500
90th Percentile £98,000 £100,000 £97,500
UK median annual salary £54,000 £60,000 £60,000
% change year-on-year -10.00% - -

IT Strategy
Job Vacancy Trend for Remote/Hybrid Jobs

Historical trend showing the proportion of permanent IT job postings citing IT Strategy and offering remote or hybrid work options relative to all permanent IT jobs advertised.
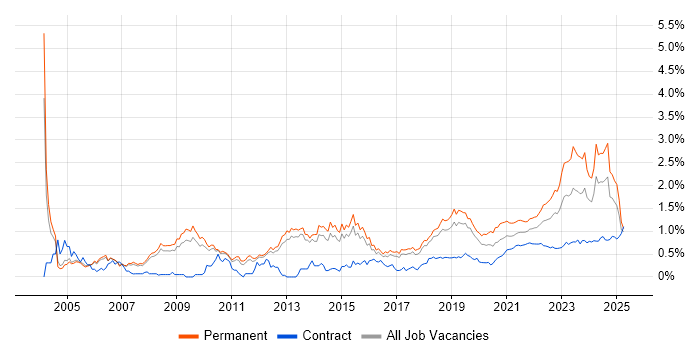
IT Strategy job vacancy trend for remote/hybrid jobs

IT Strategy
Salary Trend for Remote/Hybrid Jobs

Salary distribution trend for jobs with remote/hybrid work options citing IT Strategy.

Salary distribution trend for jobs with remote/hybrid work options citing IT Strategy

IT Strategy
Salary Histogram for Remote/Hybrid Jobs

Salary distribution for jobs with remote/hybrid work options citing IT Strategy over the 6 months to 7 November 2025.

IT Strategy salary histogram for jobs with remote/hybrid work options

IT Strategy
Co-Occurring Skills & Capabilities in Remote/Hybrid Jobs by Category

The following tables expand on the one above by listing co-occurrences grouped by category. They cover the same employment type, locality and period, with up to 20 co-occurrences shown in each category:

Application Platforms
1 7 (3.29%) SharePoint
2 5 (2.35%) Moodle
3 1 (0.47%) Confluence
3 1 (0.47%) IIS
3 1 (0.47%) Microsoft Exchange
Applications
1 2 (0.94%) Microsoft Office
Business Applications
1 5 (2.35%) Adaptiv
2 3 (1.41%) Dynamics CRM
3 1 (0.47%) SAP S/4HANA
Cloud Services
1 41 (19.25%) Azure
2 24 (11.27%) Microsoft 365
3 21 (9.86%) AWS
4 15 (7.04%) Power Platform
5 13 (6.10%) SaaS
6 8 (3.76%) Entra ID
7 6 (2.82%) GCP
7 6 (2.82%) OneDrive
8 5 (2.35%) OCI
9 3 (1.41%) Dynamics 365
9 3 (1.41%) PowerApps
10 2 (0.94%) Azure DevOps
10 2 (0.94%) Boomi
10 2 (0.94%) Cloud Computing
10 2 (0.94%) IaaS
10 2 (0.94%) PaaS
11 1 (0.47%) Azure Data Factory
11 1 (0.47%) Azure Functions
11 1 (0.47%) iPaaS
11 1 (0.47%) Serverless
Communications & Networking
1 12 (5.63%) Firewall
2 6 (2.82%) Wi-Fi
3 5 (2.35%) LAN
3 5 (2.35%) SD-WAN
3 5 (2.35%) WAN
4 4 (1.88%) DHCP
4 4 (1.88%) DNS
5 2 (0.94%) VoIP
5 2 (0.94%) Wireless
6 1 (0.47%) BGP
6 1 (0.47%) Intrusion Detection
6 1 (0.47%) MPLS
6 1 (0.47%) Network Security
6 1 (0.47%) OSPF
6 1 (0.47%) TCP/IP
6 1 (0.47%) Unified Communications
6 1 (0.47%) VLAN
Database & Business Intelligence
1 11 (5.16%) Power BI
2 8 (3.76%) SQL Server
3 2 (0.94%) NoSQL
4 1 (0.47%) Data Lake
4 1 (0.47%) Electronic Patient Records
4 1 (0.47%) Metadata
4 1 (0.47%) Metadata Repository
4 1 (0.47%) MongoDB
Development Applications
1 1 (0.47%) JIRA
General
1 123 (57.75%) Social Skills
2 63 (29.58%) Marketing
3 45 (21.13%) Finance
4 40 (18.78%) Analytical Skills
5 20 (9.39%) Retail
6 19 (8.92%) Inclusion and Diversity
7 16 (7.51%) Influencing Skills
8 14 (6.57%) Banking
9 13 (6.10%) Legal
10 9 (4.23%) Public Sector
11 6 (2.82%) Telecoms
12 5 (2.35%) Police
13 4 (1.88%) Games
13 4 (1.88%) Local Government
13 4 (1.88%) Organisational Skills
14 3 (1.41%) Agriculture
14 3 (1.41%) Back Office
14 3 (1.41%) Law
14 3 (1.41%) Manufacturing
14 3 (1.41%) Presentation Skills
Job Titles
1 60 (28.17%) Sales Executive
2 56 (26.29%) Corporate Sales Executive
3 33 (15.49%) Architect
4 31 (14.55%) Head of IT
5 23 (10.80%) Lead
6 21 (9.86%) Enterprise Architect
7 12 (5.63%) Technology Director
8 11 (5.16%) IT Manager
8 11 (5.16%) Senior
9 10 (4.69%) IT Director
10 8 (3.76%) Digital Transformation
10 8 (3.76%) Head of Digital
11 7 (3.29%) IT Engineer
11 7 (3.29%) Senior Architect
12 6 (2.82%) Head of Digital Transformation
12 6 (2.82%) Senior Enterprise Architect
12 6 (2.82%) Service Manager
12 6 (2.82%) Software Engineer
13 5 (2.35%) Enterprise Infrastructure Architect
13 5 (2.35%) Product Owner
Libraries, Frameworks & Software Standards
1 4 (1.88%) .NET
1 4 (1.88%) RESTful
2 3 (1.41%) REST
3 1 (0.47%) .NET Core
3 1 (0.47%) CSS
3 1 (0.47%) EDI
3 1 (0.47%) FHIR
3 1 (0.47%) GraphQL
3 1 (0.47%) HTML
3 1 (0.47%) JDBC
3 1 (0.47%) Kafka
3 1 (0.47%) ModSecurity
3 1 (0.47%) React
3 1 (0.47%) SOAP
3 1 (0.47%) XSLT
Miscellaneous
1 11 (5.16%) Foreign Exchange (FX)
2 9 (4.23%) Product Ownership
3 8 (3.76%) Learning Management System
4 6 (2.82%) Cyber Security Posture
4 6 (2.82%) Enterprise Software
5 5 (2.35%) Credit Risk
5 5 (2.35%) Driving Licence
6 4 (1.88%) Legacy Systems
6 4 (1.88%) Security Posture
7 3 (1.41%) Cloud Native
7 3 (1.41%) Management Information System
7 3 (1.41%) Market Risk
8 2 (0.94%) AI Agents
8 2 (0.94%) Analytical Mindset
8 2 (0.94%) Distributed Architecture
8 2 (0.94%) FMCG
9 1 (0.47%) Cyber Threat
9 1 (0.47%) Data Centre
9 1 (0.47%) Operational Technology
9 1 (0.47%) Renewable Energy
Operating Systems
1 13 (6.10%) Windows
2 3 (1.41%) Windows Server
3 2 (0.94%) Mac OS
3 2 (0.94%) Windows Server 2019
4 1 (0.47%) Windows Server 2012
Processes & Methodologies
1 144 (67.61%) Technology Strategy
2 68 (31.92%) Roadmaps
3 64 (30.05%) Customer Experience
4 63 (29.58%) AI
5 60 (28.17%) Email Marketing
6 44 (20.66%) Technology Roadmap
7 40 (18.78%) Continuous Improvement
8 38 (17.84%) Business Strategy
9 37 (17.37%) Stakeholder Management
10 30 (14.08%) Project Management
11 29 (13.62%) Enterprise Architecture
12 26 (12.21%) Budget Management
13 25 (11.74%) Strategic Thinking
14 24 (11.27%) Cybersecurity
15 22 (10.33%) Portfolio Management
15 22 (10.33%) Strategic Roadmap
16 21 (9.86%) Agile
16 21 (9.86%) Analytical Thinking
16 21 (9.86%) ITIL
17 20 (9.39%) Decision-Making
Programming Languages
1 15 (7.04%) Java
2 10 (4.69%) SQL
3 2 (0.94%) PowerShell
3 2 (0.94%) Python
4 1 (0.47%) C#
4 1 (0.47%) Groovy
4 1 (0.47%) JavaScript
Qualifications
1 15 (7.04%) Degree
2 10 (4.69%) ITIL Certification
3 9 (4.23%) PMP
4 8 (3.76%) CFA
4 8 (3.76%) PMI Certification
4 8 (3.76%) Security Cleared
5 7 (3.29%) Microsoft Certification
6 6 (2.82%) DBS Check
7 5 (2.35%) Computer Science Degree
7 5 (2.35%) SC Cleared
8 4 (1.88%) TOGAF Certification
9 3 (1.41%) Azure Certification
10 2 (0.94%) CISM
10 2 (0.94%) CISSP
10 2 (0.94%) DV Cleared
10 2 (0.94%) Master's Degree
10 2 (0.94%) MBA
11 1 (0.47%) CIMA
11 1 (0.47%) CISA
11 1 (0.47%) Cisco Certification
Quality Assurance & Compliance
1 22 (10.33%) PMO
2 19 (8.92%) ISO/IEC 27001
3 17 (7.98%) GDPR
4 5 (2.35%) Cyber Essentials
4 5 (2.35%) Cyber Essentials PLUS
5 4 (1.88%) ISO 9001
5 4 (1.88%) SLA
6 3 (1.41%) PCI DSS
7 2 (0.94%) Data Quality
7 2 (0.94%) ISO 14001
7 2 (0.94%) ISO/IEC 20000
7 2 (0.94%) ISO/IEC 42001
8 1 (0.47%) GRC
8 1 (0.47%) HL7
8 1 (0.47%) NCSC
8 1 (0.47%) NIST
8 1 (0.47%) QA
System Software
1 17 (7.98%) Active Directory
2 3 (1.41%) Hyper-V
3 2 (0.94%) VMware Infrastructure
4 1 (0.47%) Forefront TMG
4 1 (0.47%) ISA Server
Systems Management
1 5 (2.35%) Microsoft Intune
2 4 (1.88%) Autotask
3 1 (0.47%) PaperCut
Vendors
1 95 (44.60%) Microsoft
2 61 (28.64%) Cisco
3 59 (27.70%) Dell
4 8 (3.76%) Murex
5 6 (2.82%) Oracle
6 5 (2.35%) FIS
6 5 (2.35%) Progress
7 3 (1.41%) Google
7 3 (1.41%) MuleSoft
7 3 (1.41%) Salesforce
8 2 (0.94%) Fortinet
8 2 (0.94%) HP
8 2 (0.94%) SAP
8 2 (0.94%) TippingPoint
8 2 (0.94%) VMware
9 1 (0.47%) Avaya
9 1 (0.47%) Calypso
9 1 (0.47%) ESRI
9 1 (0.47%) Genesys
9 1 (0.47%) NetApp