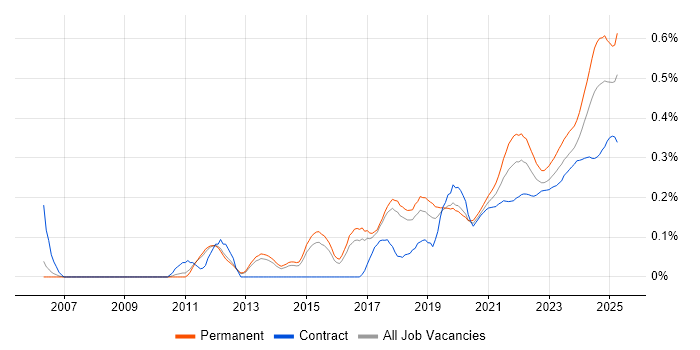
Hybrid/Remote Analytical Mindset Job Trends

Analytical Mindset
UK > Work from Home

The table below looks at the prevalence of the term Analytical Mindset in remote or hybrid work. Included is a benchmarking guide to the salaries offered in vacancies that cited Analytical Mindset over the 6 months leading up to 18 September 2025, comparing them to the same period in the previous two years.

6 months to
18 Sep 2025
Same period 2024 Same period 2023
Rank 262 352 424
Rank change year-on-year +90 +72 +234
Permanent jobs citing Analytical Mindset 166 146 98
As % of all permanent jobs with a WFH option 1.02% 0.62% 0.40%
As % of the Miscellaneous category 2.42% 1.84% 0.96%
Number of salaries quoted 114 80 86
10th Percentile £28,500 £40,000 £30,000
25th Percentile £42,500 £41,250 £41,250
Median annual salary (50th Percentile) £50,000 £57,500 £52,500
Median % change year-on-year -13.04% +9.52% +10.53%
75th Percentile £59,813 £72,500 £67,500
90th Percentile £90,750 £88,375 £90,887
UK median annual salary £50,000 £51,693 £50,000
% change year-on-year -3.28% +3.39% +5.26%

All Generic Skills
Work from Home

Analytical Mindset falls under the General and Transferable Skills category. For comparison with the information above, the following table provides summary statistics for all permanent job vacancies with remote or hybrid options requiring generic IT skills.

Permanent vacancies with a requirement for generic IT skills 6,860 7,917 10,258
As % of all permanent jobs with a WFH option 42.09% 33.78% 41.77%
Number of salaries quoted 3,525 4,789 8,281
10th Percentile £30,500 £35,000 £39,294
25th Percentile £41,250 £46,250 £49,375
Median annual salary (50th Percentile) £60,000 £62,500 £65,000
Median % change year-on-year -4.00% -3.85% -
75th Percentile £85,000 £89,000 £85,000
90th Percentile £115,000 £122,500 £106,289
UK median annual salary £55,000 £60,000 £62,500
% change year-on-year -8.33% -4.00% -

Analytical Mindset
Trend for Jobs with a WFH Option

Job vacancies with remote working options citing Analytical Mindset as a proportion of all IT jobs advertised.

Analytical Mindset trend for jobs with Hybrid/Remote/WFH options

Analytical Mindset
Salary Trend for Jobs with Hybrid Work Options

Salary distribution trend for jobs with remote work options citing Analytical Mindset.

Salary distribution trend for jobs with remote work options citing Analytical Mindset

Analytical Mindset
Salary Histogram for Jobs with a WFH Option

Salary distribution for jobs with remote working options citing Analytical Mindset over the 6 months to 18 September 2025.

Analytical Mindset salary histogram for jobs with a WFH option

Analytical Mindset
Co-occurring Skills and Capabilities with WFH Options by Category

The follow tables expand on the table above by listing co-occurrences grouped by category. The same employment type, locality and period is covered with up to 20 co-occurrences shown in each of the following categories:

Application Platforms
1 17 (10.24%) Confluence
2 8 (4.82%) SharePoint
3 5 (3.01%) CMS
4 1 (0.60%) Drupal
4 1 (0.60%) Oracle Workflow
Applications
1 30 (18.07%) Microsoft Excel
2 11 (6.63%) Microsoft Office
3 7 (4.22%) Microsoft PowerPoint
4 5 (3.01%) MS Visio
4 5 (3.01%) Spreadsheet
5 1 (0.60%) Microsoft Project
5 1 (0.60%) PlantUML
Business Applications
1 9 (5.42%) Dynamics CRM
2 2 (1.20%) Dynamics NAV
2 2 (1.20%) SAP ERP
2 2 (1.20%) Shopify
3 1 (0.60%) Dynamics GP
3 1 (0.60%) iTrent
3 1 (0.60%) NetSuite
3 1 (0.60%) Raiser’s Edge
Cloud Services
1 33 (19.88%) Azure
2 31 (18.67%) Power Platform
3 20 (12.05%) Azure DevOps
4 11 (6.63%) Dynamics 365
5 10 (6.02%) Azure Data Factory
6 8 (4.82%) Google Analytics
6 8 (4.82%) Microsoft 365
6 8 (4.82%) Snowflake
7 7 (4.22%) PowerApps
8 6 (3.61%) SaaS
9 4 (2.41%) Google Ads
10 3 (1.81%) AWS
10 3 (1.81%) Contentsquare
11 2 (1.20%) Azure Synapse Analytics
11 2 (1.20%) MailChimp
12 1 (0.60%) Azure App Service
12 1 (0.60%) Azure Logic Apps
12 1 (0.60%) GitHub Actions
12 1 (0.60%) iPaaS
12 1 (0.60%) Power Automate
Communications & Networking
1 25 (15.06%) Network Security
2 5 (3.01%) LAN
2 5 (3.01%) WAN
3 1 (0.60%) Firewall
3 1 (0.60%) Internet
3 1 (0.60%) Intranet
3 1 (0.60%) Intrusion Detection
3 1 (0.60%) Software-Defined Radio
3 1 (0.60%) Unified Communications
3 1 (0.60%) Wireless
Database & Business Intelligence
1 22 (13.25%) Power BI
2 11 (6.63%) Data Warehouse
2 11 (6.63%) Tableau
3 4 (2.41%) SQL Server
4 3 (1.81%) Relational Database
5 2 (1.20%) Azure SQL Data Warehouse
5 2 (1.20%) Azure SQL Database
6 1 (0.60%) BusinessObjects
6 1 (0.60%) Data Vault
6 1 (0.60%) Geospatial Data
6 1 (0.60%) Looker
6 1 (0.60%) Power Query
6 1 (0.60%) QGIS
6 1 (0.60%) Snowflake Schema
Development Applications
1 17 (10.24%) JIRA
2 4 (2.41%) Postman
3 2 (1.20%) Bazaar
4 1 (0.60%) Appium
4 1 (0.60%) Cypress.io
4 1 (0.60%) Jenkins
4 1 (0.60%) REST Assured
4 1 (0.60%) Selenium
General
1 166 (100.00%) Analytical Skills
2 90 (54.22%) Social Skills
3 62 (37.35%) Finance
4 61 (36.75%) Marketing
5 33 (19.88%) Manufacturing
6 25 (15.06%) Electronics
6 25 (15.06%) Public Sector
6 25 (15.06%) Telecoms
7 16 (9.64%) Legal
8 12 (7.23%) Law
9 8 (4.82%) Retail
10 5 (3.01%) Advertising
10 5 (3.01%) French Language
11 4 (2.41%) Documentation Skills
11 4 (2.41%) Influencing Skills
12 3 (1.81%) Environmental Health
12 3 (1.81%) Inclusion and Diversity
12 3 (1.81%) Organisational Skills
12 3 (1.81%) Portuguese Language
12 3 (1.81%) Spanish Language
Job Titles
1 53 (31.93%) Analyst
2 30 (18.07%) Consultant
3 26 (15.66%) Cybersecurity Consultant
3 26 (15.66%) Security Consultant
4 21 (12.65%) Business Analyst
5 10 (6.02%) Graduate
5 10 (6.02%) Senior
6 8 (4.82%) Systems Analyst
7 7 (4.22%) Architect
7 7 (4.22%) Dynamics 365 Specialist
8 6 (3.61%) Insight Analyst
9 5 (3.01%) 1st Line Support
9 5 (3.01%) 1st Line Support Analyst
9 5 (3.01%) Administrator
9 5 (3.01%) HR Specialist
9 5 (3.01%) Lead
9 5 (3.01%) Performance Analyst
9 5 (3.01%) Support Analyst
10 4 (2.41%) Data Analyst
10 4 (2.41%) IT Administrator
Libraries, Frameworks & Software Standards
1 2 (1.20%) HTML
1 2 (1.20%) REST
2 1 (0.60%) .NET
2 1 (0.60%) .NET Core
2 1 (0.60%) .NET Framework
2 1 (0.60%) Blazor
2 1 (0.60%) CSS
2 1 (0.60%) GraphQL
2 1 (0.60%) JSON
2 1 (0.60%) Middleware
2 1 (0.60%) ModSecurity
2 1 (0.60%) SOAP
2 1 (0.60%) XML
Miscellaneous
1 18 (10.84%) Onboarding
2 13 (7.83%) Product Ownership
3 10 (6.02%) Management Information System
4 7 (4.22%) Data Structures
4 7 (4.22%) Self-Motivation
5 4 (2.41%) CMDB
5 4 (2.41%) Legacy Systems
5 4 (2.41%) Social Media
6 3 (1.81%) FMCG
6 3 (1.81%) New Media
6 3 (1.81%) NHS
6 3 (1.81%) PKI
6 3 (1.81%) PMI
7 2 (1.20%) Cyber Threat
7 2 (1.20%) Data Protection Act
7 2 (1.20%) Operational Technology
7 2 (1.20%) Video Editing
8 1 (0.60%) Learning Management System
8 1 (0.60%) Online Games
8 1 (0.60%) SCADA
Operating Systems
1 5 (3.01%) Windows
Processes & Methodologies
1 55 (33.13%) Problem-Solving
2 47 (28.31%) Business Intelligence
3 41 (24.70%) Artificial Intelligence
4 40 (24.10%) Agile
5 35 (21.08%) Continuous Improvement
6 33 (19.88%) Cybersecurity
7 32 (19.28%) Mentoring
8 30 (18.07%) DevOps
9 29 (17.47%) Decision-Making
10 28 (16.87%) Digital Marketing
11 27 (16.27%) Analytics
12 26 (15.66%) Coaching
13 25 (15.06%) Programme Management
13 25 (15.06%) Vulnerability Management
14 23 (13.86%) CRM
15 22 (13.25%) User Experience
16 18 (10.84%) Asset Management
16 18 (10.84%) User Stories
17 17 (10.24%) Actionable Insight
18 15 (9.04%) Workshop Facilitation
Programming Languages
1 34 (20.48%) SQL
2 13 (7.83%) Python
3 11 (6.63%) C#
4 10 (6.02%) JavaScript
5 2 (1.20%) R
6 1 (0.60%) Java
6 1 (0.60%) PowerShell
Qualifications
1 29 (17.47%) CISSP
2 28 (16.87%) Security Cleared
3 26 (15.66%) CEH
4 25 (15.06%) CompTIA Security+
4 25 (15.06%) Degree
5 9 (5.42%) Microsoft Certification
6 5 (3.01%) A+ Certification
6 5 (3.01%) Computer Science Degree
7 4 (2.41%) ITIL Foundation Certificate
7 4 (2.41%) PMI Certification
8 3 (1.81%) BPSS Clearance
8 3 (1.81%) CISM
8 3 (1.81%) SC Cleared
9 2 (1.20%) Azure Certification
9 2 (1.20%) HNC
10 1 (0.60%) CISA
10 1 (0.60%) CRISC
10 1 (0.60%) DBS Check
10 1 (0.60%) ISO 27001 Lead Implementer
10 1 (0.60%) PMP
Quality Assurance & Compliance
1 28 (16.87%) ISO/IEC 27001
1 28 (16.87%) NIST
2 26 (15.66%) PCI DSS
3 10 (6.02%) QA
4 9 (5.42%) Accessibility
5 6 (3.61%) GDPR
6 3 (1.81%) Data Quality
7 2 (1.20%) GRC
8 1 (0.60%) Actionable Recommendations
8 1 (0.60%) Cyber Essentials
8 1 (0.60%) Cyber Essentials PLUS
8 1 (0.60%) PMO
8 1 (0.60%) SOC 2
Systems Management
1 1 (0.60%) Computer Emergency Response Teams
1 1 (0.60%) Computer Incident Response Team
Vendors
1 33 (19.88%) Microsoft
2 30 (18.07%) SAP
3 16 (9.64%) Google
4 6 (3.61%) Adobe
4 6 (3.61%) ServiceNow
5 5 (3.01%) Hotjar
5 5 (3.01%) TikTok
5 5 (3.01%) Workday
6 4 (2.41%) Salesforce
7 3 (1.81%) Autodesk
8 2 (1.20%) Avaloq
8 2 (1.20%) Facebook
8 2 (1.20%) Hootsuite
8 2 (1.20%) Instagram
8 2 (1.20%) Pinterest
8 2 (1.20%) Snapchat
8 2 (1.20%) YouTube
9 1 (0.60%) Databricks
9 1 (0.60%) HubSpot
9 1 (0.60%) Screaming Frog