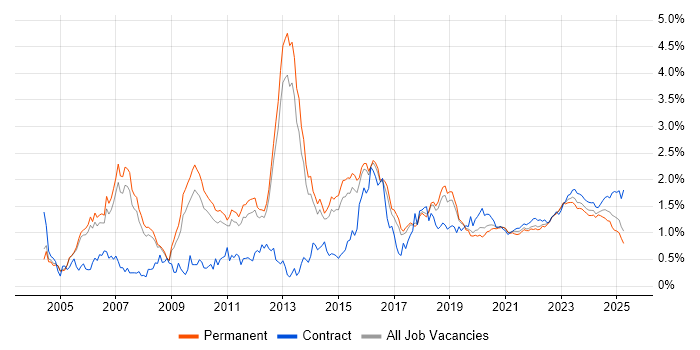
Hybrid/Remote Network Security Job Trends

Network Security
UK > Work from Home

The table below provides summary statistics and salary benchmarking for remote or hybrid work requiring Network Security skills. It covers vacancies from the 6 months leading up to 17 September 2025, with comparisons to the same periods in the previous two years.

6 months to
17 Sep 2025
Same period 2024 Same period 2023
Rank 256 216 184
Rank change year-on-year -40 -32 +158
Permanent jobs citing Network Security 179 355 441
As % of all permanent jobs with a WFH option 1.10% 1.52% 1.78%
As % of the Communications & Networking category 9.92% 9.56% 13.36%
Number of salaries quoted 165 240 360
10th Percentile - £43,178 £40,450
25th Percentile £47,500 £47,500 £49,313
Median annual salary (50th Percentile) £65,000 £60,000 £65,000
Median % change year-on-year +8.33% -7.69% +18.18%
75th Percentile £76,250 £80,000 £77,500
90th Percentile £89,500 £87,500 £88,750
UK median annual salary £60,000 £60,000 £60,000
% change year-on-year - - +4.35%

All Communications and Computer Networking Skills
Work from Home

Network Security falls under the Communications and Computer Networking category. For comparison with the information above, the following table provides summary statistics for all permanent job vacancies with remote or hybrid options requiring communications or computer networking skills.

Permanent vacancies with a requirement for communications or computer networking skills 1,804 3,712 3,301
As % of all permanent jobs with a WFH option 11.11% 15.90% 13.29%
Number of salaries quoted 1,043 1,607 2,760
10th Percentile £25,087 £31,250 £32,500
25th Percentile £31,250 £41,250 £41,625
Median annual salary (50th Percentile) £50,000 £55,000 £57,500
Median % change year-on-year -9.09% -4.35% +4.55%
75th Percentile £69,000 £70,000 £75,000
90th Percentile £87,500 £82,500 £87,500
UK median annual salary £40,000 £50,000 £50,250
% change year-on-year -20.00% -0.50% -4.29%

Network Security
Trend for Jobs with a WFH Option

Job vacancies with remote working options citing Network Security as a proportion of all IT jobs advertised.

Network Security trend for jobs with Hybrid/Remote/WFH options

Network Security
Salary Trend for Jobs with Hybrid Work Options

Salary distribution trend for jobs with remote work options citing Network Security.

Salary distribution trend for jobs with remote work options citing Network Security

Network Security
Salary Histogram for Jobs with a WFH Option

Salary distribution for jobs with remote working options citing Network Security over the 6 months to 17 September 2025.

Network Security salary histogram for jobs with a WFH option

Network Security
Co-occurring Skills and Capabilities with WFH Options by Category

The follow tables expand on the table above by listing co-occurrences grouped by category. The same employment type, locality and period is covered with up to 20 co-occurrences shown in each of the following categories:

Application Platforms
1 8 (4.47%) Microsoft Exchange
2 4 (2.23%) SharePoint
Applications
1 2 (1.12%) Microsoft Office
Cloud Services
1 51 (28.49%) Azure
2 34 (18.99%) AWS
3 10 (5.59%) GCP
4 9 (5.03%) Microsoft 365
5 7 (3.91%) AWS CloudFormation
5 7 (3.91%) AWS Lambda
5 7 (3.91%) OCI
5 7 (3.91%) Serverless
6 6 (3.35%) Entra ID
7 5 (2.79%) Azure DevOps
7 5 (2.79%) Azure Sentinel
7 5 (2.79%) Cloud Computing
8 4 (2.23%) AWS KMS
8 4 (2.23%) Azure Monitor
9 3 (1.68%) PaaS
10 2 (1.12%) Azure AKS
10 2 (1.12%) Azure Key Vault
10 2 (1.12%) Azure Logic Apps
10 2 (1.12%) dbt
10 2 (1.12%) Snowflake
Communications & Networking
1 83 (46.37%) Firewall
2 35 (19.55%) VPN
3 30 (16.76%) WAN
4 29 (16.20%) LAN
5 22 (12.29%) TCP/IP
6 19 (10.61%) VLAN
7 18 (10.06%) Wi-Fi
8 17 (9.50%) SD-WAN
9 15 (8.38%) DNS
10 14 (7.82%) Wireless
11 13 (7.26%) DHCP
11 13 (7.26%) Unified Communications
12 11 (6.15%) BGP
13 9 (5.03%) OSPF
14 8 (4.47%) Intrusion Detection
15 6 (3.35%) Cisco Wireless
15 6 (3.35%) HSRP
16 5 (2.79%) IP Telephony
17 4 (2.23%) Cisco Firepower
17 4 (2.23%) MPLS
Database & Business Intelligence
1 2 (1.12%) Data Lake
1 2 (1.12%) SQL Server
2 1 (0.56%) Amazon RDS
Development Applications
1 4 (2.23%) Jenkins
2 1 (0.56%) Git
2 1 (0.56%) GitLab
2 1 (0.56%) Maven
2 1 (0.56%) MSBuild
General
1 50 (27.93%) Social Skills
2 47 (26.26%) Finance
3 37 (20.67%) Telecoms
4 35 (19.55%) Analytical Skills
5 33 (18.44%) Public Sector
6 30 (16.76%) Marketing
7 27 (15.08%) Manufacturing
8 25 (13.97%) Electronics
9 17 (9.50%) Inclusion and Diversity
10 12 (6.70%) Legal
11 8 (4.47%) Influencing Skills
12 6 (3.35%) Documentation Skills
13 5 (2.79%) Presentation Skills
14 4 (2.23%) Banking
15 2 (1.12%) French Language
16 1 (0.56%) Law
16 1 (0.56%) Local Government
Job Titles
1 38 (21.23%) Senior
2 33 (18.44%) Network Engineer
3 27 (15.08%) Consultant
3 27 (15.08%) Cybersecurity Consultant
3 27 (15.08%) Security Consultant
4 26 (14.53%) Architect
5 21 (11.73%) Security Engineer
6 18 (10.06%) Security Architect
7 17 (9.50%) Lead
8 14 (7.82%) Cybersecurity Engineer
9 13 (7.26%) Analyst
10 12 (6.70%) Bid Writer
10 12 (6.70%) Senior Bid Writer
11 9 (5.03%) Security Analyst
11 9 (5.03%) Senior Security Engineer
12 8 (4.47%) Principal Architect
12 8 (4.47%) Principal Security Architect
12 8 (4.47%) Security Manager
13 7 (3.91%) Lead Architect
13 7 (3.91%) Lead Security Architect
Libraries, Frameworks & Software Standards
1 4 (2.23%) Elastic Stack
1 4 (2.23%) Kafka
2 3 (1.68%) 802.1X
3 2 (1.12%) Django
4 1 (0.56%) .NET
4 1 (0.56%) JSON
Miscellaneous
1 25 (13.97%) Analytical Mindset
2 15 (8.38%) Management Information System
3 13 (7.26%) Data Centre
4 12 (6.70%) Security Operations Centre
4 12 (6.70%) Security Posture
5 9 (5.03%) Cyber Threat
6 7 (3.91%) Self-Motivation
7 5 (2.79%) Hybrid Cloud
7 5 (2.79%) Private Cloud
8 4 (2.23%) Cloud Native
8 4 (2.23%) Operational Technology
9 3 (1.68%) Cyber Kill Chain
9 3 (1.68%) Distributed Denial-of-Service
9 3 (1.68%) Low-Code
9 3 (1.68%) SCADA
9 3 (1.68%) Web3
10 2 (1.12%) Cyber Defence
10 2 (1.12%) Data Protection Act
10 2 (1.12%) Device Driver
10 2 (1.12%) IoT
Operating Systems
1 19 (10.61%) Windows
2 10 (5.59%) Linux
3 3 (1.68%) Windows Server
4 2 (1.12%) CentOS
4 2 (1.12%) Debian
4 2 (1.12%) Unix
4 2 (1.12%) VMS
5 1 (0.56%) Check Point GAiA
5 1 (0.56%) Windows Server 2008
5 1 (0.56%) Windows Server 2012
Processes & Methodologies
1 81 (45.25%) Cybersecurity
2 43 (24.02%) Mentoring
3 36 (20.11%) Vulnerability Management
4 33 (18.44%) Security Architecture
5 29 (16.20%) Cloud Security
6 28 (15.64%) Problem-Solving
7 27 (15.08%) Incident Response
8 26 (14.53%) Penetration Testing
8 26 (14.53%) Programme Management
9 25 (13.97%) Business Intelligence
9 25 (13.97%) Digital Marketing
9 25 (13.97%) Information Security
9 25 (13.97%) SIEM
10 22 (12.29%) DevOps
11 21 (11.73%) Risk Management
12 20 (11.17%) Infrastructure as Code
13 19 (10.61%) Architectural Patterns
13 19 (10.61%) Continuous Improvement
13 19 (10.61%) TOGAF
14 18 (10.06%) Security Management
Programming Languages
1 15 (8.38%) Python
2 6 (3.35%) PowerShell
3 4 (2.23%) Bash
3 4 (2.23%) Java
3 4 (2.23%) Kusto Query Language
3 4 (2.23%) SQL
4 2 (1.12%) C
4 2 (1.12%) C++
5 1 (0.56%) Bicep
5 1 (0.56%) C#
5 1 (0.56%) JavaScript
Qualifications
1 53 (29.61%) Security Cleared
2 44 (24.58%) CISSP
3 39 (21.79%) Cisco Certification
4 32 (17.88%) CompTIA Security+
5 28 (15.64%) CCNP
5 28 (15.64%) CEH
6 27 (15.08%) SC Cleared
7 18 (10.06%) CCNA
8 16 (8.94%) CCIE
9 15 (8.38%) Degree
10 9 (5.03%) AWS Certification
10 9 (5.03%) Computer Science Degree
11 8 (4.47%) CISM
12 7 (3.91%) GCIA
12 7 (3.91%) SANS
13 6 (3.35%) AWS Certified Solutions Architect
13 6 (3.35%) Azure Certification
14 4 (2.23%) Master's Degree
14 4 (2.23%) Network+ Certification
15 3 (1.68%) PRINCE2 Certification
Quality Assurance & Compliance
1 61 (34.08%) ISO/IEC 27001
2 58 (32.40%) NIST
3 29 (16.20%) PCI DSS
4 19 (10.61%) NCSC
5 14 (7.82%) GDPR
6 8 (4.47%) HIPAA
6 8 (4.47%) QA
7 7 (3.91%) Cyber Essentials
8 3 (1.68%) SLA
9 2 (1.12%) NIST 800
10 1 (0.56%) GRC
10 1 (0.56%) ISO/IEC 42001
10 1 (0.56%) JSP 440
10 1 (0.56%) PMO
System Software
1 13 (7.26%) Active Directory
2 8 (4.47%) Docker
3 4 (2.23%) Firmware
3 4 (2.23%) VMware Infrastructure
4 1 (0.56%) VMware ESXi
4 1 (0.56%) VMware Server
4 1 (0.56%) vSphere
Systems Management
1 20 (11.17%) Terraform
2 15 (8.38%) Ansible
3 8 (4.47%) Kubernetes
4 6 (3.35%) FortiGate
5 5 (2.79%) Grafana
5 5 (2.79%) Prometheus
6 4 (2.23%) Microsoft Intune
6 4 (2.23%) Single Sign-On
7 2 (1.12%) Dell DRAC
7 2 (1.12%) SCOM
8 1 (0.56%) Active Directory Federation Services
8 1 (0.56%) Argo
8 1 (0.56%) Nagios
Vendors
1 42 (23.46%) Cisco
2 27 (15.08%) SAP
3 24 (13.41%) Microsoft
4 15 (8.38%) Meraki
5 14 (7.82%) Palo Alto
6 11 (6.15%) Fortinet
7 7 (3.91%) Juniper
8 6 (3.35%) Extreme Networks
8 6 (3.35%) SolarWinds
9 5 (2.79%) CheckPoint
9 5 (2.79%) HubSpot
9 5 (2.79%) VMware
10 3 (1.68%) HP
11 2 (1.12%) Arista
11 2 (1.12%) Aruba
11 2 (1.12%) Dell
11 2 (1.12%) F5
11 2 (1.12%) Red Hat
11 2 (1.12%) Zscaler
12 1 (0.56%) Datto