JIRA Jobs with Hybrid/Remote/WFH Options

Atlassian JIRA
UK > Work from Home

The table below provides summary statistics for permanent remote or hybrid work requiring JIRA skills. It includes a benchmarking guide to the annual salaries offered in vacancies that cited JIRA over the 6 months leading up to 17 July 2025, comparing them to the same period in the previous two years.

6 months to
17 Jul 2025
Same period 2024 Same period 2023
Rank 73 118 90
Rank change year-on-year +45 -28 -26
Permanent jobs citing JIRA 922 781 1,238
As % of all permanent jobs with a WFH option 4.37% 2.46% 3.59%
As % of the Development Applications category 37.43% 23.52% 23.90%
Number of salaries quoted 304 527 918
10th Percentile £38,425 £36,250 £37,350
25th Percentile £46,813 £46,250 £46,250
Median annual salary (50th Percentile) £62,500 £55,000 £60,000
Median % change year-on-year +13.64% -8.33% -
75th Percentile £77,500 £68,750 £75,000
90th Percentile £93,778 £78,000 £89,852
UK median annual salary £60,000 £55,000 £60,000
% change year-on-year +9.09% -8.33% +1.69%

All Development Application Skills
Work from Home

JIRA falls under the Development Applications category. For comparison with the information above, the following table provides summary statistics for all permanent job vacancies with remote or hybrid options requiring development application skills.

Permanent vacancies with a requirement for development application skills 2,463 3,320 5,181
As % of all permanent jobs with a WFH option 11.69% 10.47% 15.03%
Number of salaries quoted 1,298 2,393 3,854
10th Percentile £41,513 £37,500 £41,068
25th Percentile £51,250 £46,250 £50,000
Median annual salary (50th Percentile) £70,000 £57,965 £62,500
Median % change year-on-year +20.76% -7.26% -
75th Percentile £80,000 £73,750 £80,000
90th Percentile £95,000 £90,000 £95,000
UK median annual salary £62,000 £57,500 £65,000
% change year-on-year +7.83% -11.54% +4.00%

JIRA
Trend for Jobs with a WFH Option

Job vacancies with remote working options citing JIRA as a proportion of all IT jobs advertised.
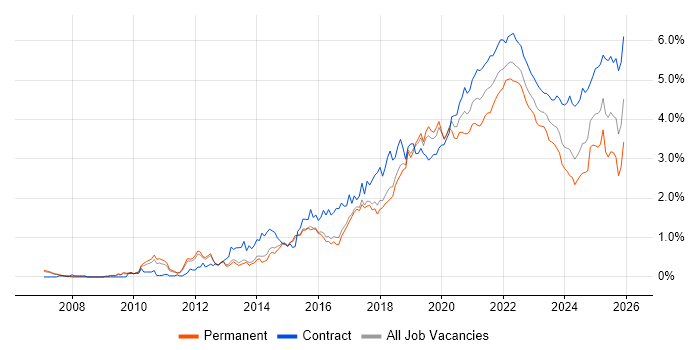
JIRA trend for jobs with Hybrid/Remote/WFH options

JIRA
Salary Trend for Jobs with a WFH Option

3-month moving average salary quoted in job vacancies with remote working options citing JIRA.

JIRA salary trend for jobs with a WFH option

JIRA
Salary Histogram for Jobs with a WFH Option

Salary distribution for jobs with remote working options citing JIRA over the 6 months to 17 July 2025.

JIRA salary histogram for jobs with a WFH option

JIRA
Co-occurring Skills and Capabilities with WFH Options by Category

The follow tables expand on the table above by listing co-occurrences grouped by category. The same employment type, locality and period is covered with up to 20 co-occurrences shown in each of the following categories:

Application Platforms
1 351 (38.07%) Confluence
2 24 (2.60%) SharePoint
3 5 (0.54%) Microsoft Exchange
4 3 (0.33%) Adobe Experience Manager
4 3 (0.33%) WordPress
5 2 (0.22%) CMS
5 2 (0.22%) Headless CMS
5 2 (0.22%) IIS
5 2 (0.22%) Moodle
5 2 (0.22%) Totara
6 1 (0.11%) Apache
6 1 (0.11%) Apache Airflow
6 1 (0.11%) Apache Spark
6 1 (0.11%) ColdFusion
6 1 (0.11%) Drupal
6 1 (0.11%) Mendix
6 1 (0.11%) Oracle SOA Suite
6 1 (0.11%) Tomcat
6 1 (0.11%) WebSphere
6 1 (0.11%) WebSphere Application Server
Applications
1 86 (9.33%) Microsoft Office
2 34 (3.69%) Microsoft Project
3 25 (2.71%) Microsoft Excel
4 22 (2.39%) Trello
5 21 (2.28%) MS Visio
6 10 (1.08%) Microsoft PowerPoint
7 6 (0.65%) Chatbot
8 1 (0.11%) Weka
Business Applications
1 9 (0.98%) NetSuite
2 6 (0.65%) Dynamics CRM
2 6 (0.65%) SAP S/4HANA
3 5 (0.54%) CA PPM
4 3 (0.33%) Sparx Enterprise Architect
5 2 (0.22%) Elite 3E
5 2 (0.22%) Salesforce CRM
5 2 (0.22%) SAP APO
5 2 (0.22%) SAP PP
5 2 (0.22%) SAP SCM
5 2 (0.22%) Shopify
6 1 (0.11%) Magento
6 1 (0.11%) Payment Gateway
6 1 (0.11%) SAP EWM
6 1 (0.11%) SAP IBP
6 1 (0.11%) SAP LE
6 1 (0.11%) SAP MM
6 1 (0.11%) SAP QM
6 1 (0.11%) SAP SD
Cloud Services
1 341 (36.98%) Azure
2 307 (33.30%) AWS
3 183 (19.85%) GCP
4 76 (8.24%) Miro
5 75 (8.13%) Asana
6 35 (3.80%) Azure DevOps
7 33 (3.58%) GitHub
8 25 (2.71%) SaaS
9 23 (2.49%) Power Platform
10 21 (2.28%) Microsoft 365
11 11 (1.19%) Power Automate
12 10 (1.08%) Amazon S3
12 10 (1.08%) Boomi
12 10 (1.08%) Dynamics 365
13 9 (0.98%) Amazon EC2
14 8 (0.87%) Entra ID
14 8 (0.87%) Serverless
14 8 (0.87%) Smartsheet
15 7 (0.76%) AWS Lambda
15 7 (0.76%) npm
Communications & Networking
1 293 (31.78%) Broadband
2 7 (0.76%) DNS
3 6 (0.65%) Internet
4 5 (0.54%) DHCP
4 5 (0.54%) Firewall
4 5 (0.54%) TCP/IP
5 4 (0.43%) Multicast
5 4 (0.43%) VPN
6 3 (0.33%) 5G
7 2 (0.22%) HTTP
7 2 (0.22%) LAN
7 2 (0.22%) VLAN
7 2 (0.22%) WAN
8 1 (0.11%) Ethernet
8 1 (0.11%) GPRS
8 1 (0.11%) iSCSI
8 1 (0.11%) LTE
8 1 (0.11%) NAS
8 1 (0.11%) Softphone
8 1 (0.11%) Wireless
Database & Business Intelligence
1 282 (30.59%) SQL Server
2 28 (3.04%) Relational Database
3 25 (2.71%) MySQL
4 23 (2.49%) Power BI
5 10 (1.08%) PostgreSQL
5 10 (1.08%) SQL Server Integration Services
5 10 (1.08%) SQL Server Reporting Services
6 9 (0.98%) MongoDB
6 9 (0.98%) NoSQL
7 8 (0.87%) Data Warehouse
7 8 (0.87%) Elasticsearch
8 7 (0.76%) Amazon Redshift
9 6 (0.65%) Redis
9 6 (0.65%) SQL Server Analysis Services
9 6 (0.65%) Tableau
10 5 (0.54%) Amazon QuickSight
10 5 (0.54%) BusinessObjects
11 4 (0.43%) Biml
11 4 (0.43%) Data Lake
11 4 (0.43%) Metadata
Development Applications
1 273 (29.61%) Selenium
2 264 (28.63%) SonarQube
3 256 (27.77%) Cucumber
4 252 (27.33%) Bitbucket
4 252 (27.33%) Sonatype Nexus
5 251 (27.22%) GitLab
6 250 (27.11%) Maven
7 77 (8.35%) Git
8 24 (2.60%) Jenkins
9 15 (1.63%) Visual Studio
10 8 (0.87%) Cypress.io
10 8 (0.87%) JUnit
11 7 (0.76%) Postman
11 7 (0.76%) SoapUI
12 5 (0.54%) Subversion
12 5 (0.54%) WebDriver
13 4 (0.43%) Artifactory
13 4 (0.43%) Atlassian Bamboo
13 4 (0.43%) Mocha
13 4 (0.43%) Team Foundation Server
General
1 438 (47.51%) Finance
2 288 (31.24%) Banking
3 267 (28.96%) Inclusion and Diversity
4 159 (17.25%) Social Skills
5 108 (11.71%) Retail
6 93 (10.09%) Investment Banking
7 90 (9.76%) Corporate Banking
8 75 (8.13%) Influencing Skills
9 48 (5.21%) Analytical Skills
10 34 (3.69%) Law
11 26 (2.82%) Marketing
12 20 (2.17%) Public Sector
13 18 (1.95%) Legal
14 14 (1.52%) Presentation Skills
15 10 (1.08%) Organisational Skills
16 8 (0.87%) Back Office
16 8 (0.87%) Documentation Skills
17 6 (0.65%) Manufacturing
17 6 (0.65%) Telecoms
18 5 (0.54%) Public Speaking
Job Titles
1 283 (30.69%) Software Engineer
2 216 (23.43%) Embedded Engineer
3 215 (23.32%) Release Engineer
4 135 (14.64%) Analyst
5 77 (8.35%) Product Analyst
6 70 (7.59%) Senior
7 69 (7.48%) Developer
8 43 (4.66%) Lead
9 37 (4.01%) Project Manager
10 21 (2.28%) Business Analyst
10 21 (2.28%) Senior Developer
11 17 (1.84%) Junior
12 15 (1.63%) Architect
13 14 (1.52%) QA Engineer
14 13 (1.41%) DevOps Engineer
14 13 (1.41%) Full-Stack Developer
14 13 (1.41%) Senior Software Engineer
14 13 (1.41%) Support Analyst
15 12 (1.30%) .NET Developer
15 12 (1.30%) IT Manager
Libraries, Frameworks & Software Standards
1 286 (31.02%) React
2 282 (30.59%) HTML
3 279 (30.26%) CSS
4 265 (28.74%) Spring
5 258 (27.98%) Redux
6 256 (27.77%) Kafka
6 256 (27.77%) Spring Boot
7 249 (27.01%) JPA
8 229 (24.84%) Middleware
9 160 (17.35%) Hibernate
10 115 (12.47%) REST
11 102 (11.06%) RESTful
12 99 (10.74%) CSS3
12 99 (10.74%) HTML5
13 96 (10.41%) Jest
14 92 (9.98%) Sass
15 32 (3.47%) .NET
15 32 (3.47%) Node.js
16 23 (2.49%) AngularJS
16 23 (2.49%) Web Services
Miscellaneous
1 352 (38.18%) Product Ownership
2 254 (27.55%) Enterprise Software
3 215 (23.32%) Embedded Systems
4 79 (8.57%) Self-Motivation
5 72 (7.81%) Over-the-Top Content
5 72 (7.81%) Video\Live Streaming
6 17 (1.84%) Management Information System
7 15 (1.63%) Social Media
8 14 (1.52%) Virtual Team
9 12 (1.30%) Onboarding
10 11 (1.19%) PMI
10 11 (1.19%) Public Cloud
11 10 (1.08%) Algorithms
11 10 (1.08%) Cloud Native
11 10 (1.08%) IoT
12 8 (0.87%) Greenfield Project
13 7 (0.76%) Analytical Mindset
13 7 (0.76%) CMDB
13 7 (0.76%) Distributed Systems
14 6 (0.65%) Data Structures
Operating Systems
1 30 (3.25%) Windows
2 29 (3.15%) Linux
3 10 (1.08%) Unix
4 9 (0.98%) Android
4 9 (0.98%) Windows Vista
5 5 (0.54%) Apple iOS
6 3 (0.33%) Mac OS
6 3 (0.33%) Windows Server
7 2 (0.22%) Debian
7 2 (0.22%) Windows 10
8 1 (0.11%) CentOS
8 1 (0.11%) Solaris
Processes & Methodologies
1 779 (84.49%) Agile
2 505 (54.77%) CI/CD
3 337 (36.55%) DevOps
4 326 (35.36%) Roadmaps
5 318 (34.49%) Strategic Thinking
6 296 (32.10%) Software Engineering
7 293 (31.78%) Test Automation
8 283 (30.69%) SDLC
9 278 (30.15%) Microservices
10 267 (28.96%) Full-Stack Development
11 264 (28.63%) Front End Development
12 257 (27.87%) Containerisation
13 256 (27.77%) Performance Optimisation
14 241 (26.14%) Artificial Intelligence
15 218 (23.64%) Continuous Deployment
16 217 (23.54%) Software Delivery
17 215 (23.32%) Release Automation
18 211 (22.89%) Continuous Improvement
19 174 (18.87%) TDD
20 166 (18.00%) Clean Code
Programming Languages
1 336 (36.44%) SQL
2 309 (33.51%) JavaScript
3 297 (32.21%) Java
4 118 (12.80%) TypeScript
5 49 (5.31%) Python
6 48 (5.21%) C#
7 15 (1.63%) PowerShell
8 12 (1.30%) Bash
8 12 (1.30%) PHP
9 9 (0.98%) Groovy
10 7 (0.76%) T-SQL
11 6 (0.65%) Shell Script
12 5 (0.54%) C++
12 5 (0.54%) Kotlin
12 5 (0.54%) Ruby
13 4 (0.43%) R
14 3 (0.33%) Apex Code
14 3 (0.33%) Bicep
14 3 (0.33%) Perl
15 2 (0.22%) Go
Qualifications
1 73 (7.92%) Degree
2 32 (3.47%) PMI Certification
3 23 (2.49%) PMP
4 19 (2.06%) ISTQB
4 19 (2.06%) Security Cleared
5 10 (1.08%) Computer Science Degree
6 9 (0.98%) SC Cleared
7 8 (0.87%) BPSS Clearance
7 8 (0.87%) DBS Check
8 7 (0.76%) SAP Certification
9 6 (0.65%) Numerate Degree
10 5 (0.54%) CITP
10 5 (0.54%) Master's Degree
11 4 (0.43%) Azure Certification
11 4 (0.43%) ISTQB Advanced Certification
11 4 (0.43%) PRINCE2 Practitioner
12 3 (0.33%) AWS Certification
12 3 (0.33%) OCP
12 3 (0.33%) Oracle Certification
13 2 (0.22%) Microsoft Certification
Quality Assurance & Compliance
1 313 (33.95%) QA
2 100 (10.85%) Accessibility
3 14 (1.52%) PMO
4 11 (1.19%) ISO/IEC 27001
5 7 (0.76%) Data Quality
5 7 (0.76%) GDPR
6 6 (0.65%) SLA
7 5 (0.54%) P3O
8 2 (0.22%) IEC 62304
8 2 (0.22%) ISO 13485
9 1 (0.11%) California Consumer Privacy Act
9 1 (0.11%) Def Stans
9 1 (0.11%) Government Security Classifications
9 1 (0.11%) HIPAA
9 1 (0.11%) NIST
9 1 (0.11%) PCI DSS
9 1 (0.11%) PERC
9 1 (0.11%) WCAG
System Software
1 282 (30.59%) Docker
2 14 (1.52%) Active Directory
3 3 (0.33%) VMware Infrastructure
4 2 (0.22%) Hyper-V
5 1 (0.11%) HDFS
5 1 (0.11%) KVM
5 1 (0.11%) NFS
5 1 (0.11%) pfSense
5 1 (0.11%) SRDF
5 1 (0.11%) Varnish
5 1 (0.11%) Veritas Cluster Server
5 1 (0.11%) Virtual Desktop
5 1 (0.11%) VMware ESXi
5 1 (0.11%) VMware NSX
5 1 (0.11%) Xen
Systems Management
1 275 (29.83%) Kubernetes
2 17 (1.84%) Terraform
3 13 (1.41%) Ansible
4 12 (1.30%) Single Sign-On
5 9 (0.98%) Grafana
6 8 (0.87%) Prometheus
7 7 (0.76%) Microsoft Intune
8 4 (0.43%) Argo
8 4 (0.43%) Progress Chef
9 3 (0.33%) Istio
9 3 (0.33%) Kibana
9 3 (0.33%) logstash
9 3 (0.33%) Packer
10 2 (0.22%) Jamf Pro
10 2 (0.22%) Kustomize
10 2 (0.22%) Puppet
11 1 (0.11%) Avamar
11 1 (0.11%) Marathon
11 1 (0.11%) Opsgenie
11 1 (0.11%) VxRail
Vendors
1 247 (26.79%) Solace
2 145 (15.73%) Microsoft
3 87 (9.44%) Salesforce
4 26 (2.82%) Google
5 18 (1.95%) SAP
6 17 (1.84%) ServiceNow
7 14 (1.52%) Atlassian
8 12 (1.30%) Oracle
9 11 (1.19%) MuleSoft
10 6 (0.65%) Dynatrace
10 6 (0.65%) IBM
11 5 (0.54%) Adobe
11 5 (0.54%) Pegasus
11 5 (0.54%) Planview
11 5 (0.54%) Splunk
12 4 (0.43%) AppDynamics
12 4 (0.43%) Databricks
12 4 (0.43%) OpenAI
12 4 (0.43%) Samsung
12 4 (0.43%) Teradata