Hybrid/Remote SharePoint Job Trends

Microsoft SharePoint
UK > Work from Home

The table below provides summary statistics and salary benchmarking for remote or hybrid work requiring SharePoint skills. It covers permanent job vacancies from the 6 months leading up to 22 November 2025, with comparisons to the same periods in the previous two years.

6 months to
22 Nov 2025
Same period 2024 Same period 2023
Rank 111 112 133
Rank change year-on-year +1 +21 +38
Permanent jobs citing SharePoint 365 555 536
As % of all permanent jobs with remote/hybrid work options 2.39% 2.75% 2.50%
As % of the Application Platforms category 30.29% 23.28% 21.84%
Number of salaries quoted 269 392 444
10th Percentile £28,700 £28,500 £30,000
25th Percentile £35,000 £31,250 £35,000
Median annual salary (50th Percentile) £50,000 £50,000 £48,000
Median % change year-on-year - +4.17% -8.57%
75th Percentile £66,250 £66,250 £63,750
90th Percentile £87,500 £85,000 £77,500
UK median annual salary £42,500 £49,000 £47,500
% change year-on-year -13.27% +3.16% -

All Application Platform Skills
Work from Home

SharePoint falls under the Application Platforms category. For comparison with the information above, the following table provides summary statistics for all permanent job vacancies with remote or hybrid options requiring application platform skills.

Permanent vacancies with a requirement for application platform skills 1,205 2,384 2,454
As % of all permanent jobs with a WFH option 7.88% 11.82% 11.43%
Number of salaries quoted 903 1,686 1,962
10th Percentile £30,000 £31,250 £32,500
25th Percentile £40,000 £45,000 £41,250
Median annual salary (50th Percentile) £60,000 £65,000 £57,500
Median % change year-on-year -7.69% +13.04% -
75th Percentile £87,500 £97,500 £77,715
90th Percentile £125,000 £142,500 £95,063
UK median annual salary £52,500 £55,631 £55,000
% change year-on-year -5.63% +1.15% -

SharePoint
Job Vacancy Trend for Remote/Hybrid Jobs

Historical trend showing the proportion of permanent IT job postings citing SharePoint and offering remote or hybrid work options relative to all permanent IT jobs advertised.
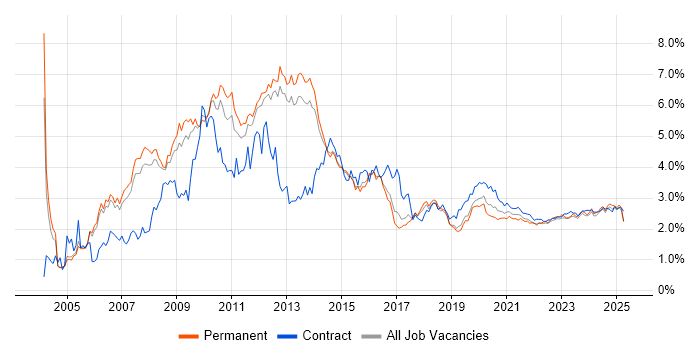
SharePoint job vacancy trend for remote/hybrid jobs

SharePoint
Salary Trend for Remote/Hybrid Jobs

Salary distribution trend for jobs with remote/hybrid work options citing SharePoint.

Salary distribution trend for jobs with remote/hybrid work options citing SharePoint

SharePoint
Salary Histogram for Remote/Hybrid Jobs

Salary distribution for jobs with remote/hybrid work options citing SharePoint over the 6 months to 22 November 2025.

SharePoint salary histogram for jobs with remote/hybrid work options

SharePoint
Co-Occurring Skills & Capabilities in Remote/Hybrid Jobs by Category

The following tables expand on the one above by listing co-occurrences grouped by category. They cover the same employment type, locality and period, with up to 20 co-occurrences shown in each category:

Application Platforms
1 120 (32.88%) Microsoft Exchange
2 5 (1.37%) Confluence
3 4 (1.10%) IIS
3 4 (1.10%) Umbraco
4 3 (0.82%) ArcGIS
4 3 (0.82%) CMS
4 3 (0.82%) Moodle
4 3 (0.82%) Skype for Business
5 2 (0.55%) HCL Notes
5 2 (0.55%) Oracle SOA Suite
6 1 (0.27%) Alfresco
6 1 (0.27%) Drupal
6 1 (0.27%) WordPress
Applications
1 59 (16.16%) Microsoft Excel
2 49 (13.42%) Microsoft Office
3 14 (3.84%) MS Visio
4 11 (3.01%) Microsoft Project
5 8 (2.19%) Microsoft PowerPoint
6 4 (1.10%) Spreadsheet
7 1 (0.27%) Adobe Illustrator
7 1 (0.27%) InDesign
7 1 (0.27%) Photoshop
Business Applications
1 23 (6.30%) Dynamics CRM
2 3 (0.82%) Sage 1000
3 2 (0.55%) Oracle BPM
4 1 (0.27%) Dynamics AX
4 1 (0.27%) NetSuite
4 1 (0.27%) Raiser’s Edge
4 1 (0.27%) Sage 200
4 1 (0.27%) Salesforce CRM
4 1 (0.27%) Shopify
Cloud Services
1 262 (71.78%) Microsoft 365
2 157 (43.01%) Azure
3 103 (28.22%) Entra ID
4 100 (27.40%) Power Platform
5 77 (21.10%) PowerApps
6 69 (18.90%) Power Automate
7 62 (16.99%) OneDrive
8 44 (12.05%) Dynamics 365
9 28 (7.67%) Microsoft Copilot
9 28 (7.67%) Microsoft Purview
10 15 (4.11%) Copilot Studio
11 13 (3.56%) AWS
11 13 (3.56%) Azure DevOps
12 10 (2.74%) SaaS
13 9 (2.47%) Mimecast
14 8 (2.19%) Azure Data Factory
15 7 (1.92%) Azure Logic Apps
15 7 (1.92%) Serverless
16 6 (1.64%) Azure Functions
16 6 (1.64%) ShareGate
Communications & Networking
1 41 (11.23%) DNS
2 40 (10.96%) DHCP
3 35 (9.59%) VPN
4 18 (4.93%) Firewall
5 15 (4.11%) Intranet
6 14 (3.84%) VoIP
7 13 (3.56%) VLAN
7 13 (3.56%) WAN
8 12 (3.29%) TCP/IP
9 11 (3.01%) Wi-Fi
10 10 (2.74%) LAN
11 6 (1.64%) Unified Communications
11 6 (1.64%) Wireless
12 5 (1.37%) SD-WAN
13 3 (0.82%) DKIM
13 3 (0.82%) DMARC
14 2 (0.55%) Broadband
14 2 (0.55%) Internet
14 2 (0.55%) NAS
14 2 (0.55%) Network Security
Database & Business Intelligence
1 63 (17.26%) Power BI
2 18 (4.93%) SQL Server
3 9 (2.47%) SQL Server Reporting Services
4 6 (1.64%) MySQL
4 6 (1.64%) SQL Server Integration Services
5 4 (1.10%) Data Warehouse
6 3 (0.82%) GIS
6 3 (0.82%) Oracle Database
6 3 (0.82%) Power Query
7 2 (0.55%) MariaDB
7 2 (0.55%) Metadata
7 2 (0.55%) PostgreSQL
7 2 (0.55%) Qlik Sense
7 2 (0.55%) QlikView
7 2 (0.55%) SQL Server Analysis Services
7 2 (0.55%) Tableau
8 1 (0.27%) Crystal Reports
8 1 (0.27%) EDMS
8 1 (0.27%) EDRMS
8 1 (0.27%) Star Schema
Development Applications
1 7 (1.92%) JIRA
2 1 (0.27%) Git
2 1 (0.27%) MSBuild
2 1 (0.27%) RStudio
2 1 (0.27%) Sourcetree
2 1 (0.27%) SQL Server Management Studio (SSMS)
General
1 156 (42.74%) Social Skills
2 93 (25.48%) Finance
3 41 (11.23%) Analytical Skills
4 40 (10.96%) Inclusion and Diversity
5 35 (9.59%) Law
6 32 (8.77%) Organisational Skills
7 29 (7.95%) Public Sector
8 23 (6.30%) Legal
9 18 (4.93%) Manufacturing
10 17 (4.66%) Retail
11 13 (3.56%) Presentation Skills
12 11 (3.01%) Banking
13 9 (2.47%) Advertising
13 9 (2.47%) Marketing
14 8 (2.19%) Telecoms
15 5 (1.37%) Pharmaceutical
16 4 (1.10%) Documentation Skills
16 4 (1.10%) German Language
17 3 (0.82%) Influencing Skills
17 3 (0.82%) Social Housing
Job Titles
1 52 (14.25%) IT Support
2 50 (13.70%) Analyst
3 46 (12.60%) Developer
4 42 (11.51%) Senior
5 33 (9.04%) Support Engineer
6 29 (7.95%) IT Manager
7 28 (7.67%) Support Analyst
8 27 (7.40%) Power Platform Developer
9 25 (6.85%) IT Engineer
10 23 (6.30%) IT Support Engineer
11 20 (5.48%) Consultant
12 19 (5.21%) IT Analyst
13 18 (4.93%) Support Manager
14 17 (4.66%) 1st Line Support
14 17 (4.66%) Infrastructure Engineer
15 16 (4.38%) Service Manager
16 14 (3.84%) IT Support Analyst
17 13 (3.56%) Senior Analyst
17 13 (3.56%) Senior Developer
17 13 (3.56%) Support Technician
Libraries, Frameworks & Software Standards
1 27 (7.40%) .NET
2 19 (5.21%) HTML5 Canvas
3 9 (2.47%) HTML
4 8 (2.19%) ASP.NET
4 8 (2.19%) CSS
5 6 (1.64%) Web Services
6 5 (1.37%) REST
7 4 (1.10%) .NET Core
7 4 (1.10%) JSON
7 4 (1.10%) Microsoft Graph
8 3 (0.82%) .NET Framework
8 3 (0.82%) Middleware
8 3 (0.82%) RESTful
9 2 (0.55%) ADO.NET
9 2 (0.55%) EDI
9 2 (0.55%) Node.js
9 2 (0.55%) Smarty
9 2 (0.55%) Software Packaging
9 2 (0.55%) Symfony
9 2 (0.55%) WCF
Miscellaneous
1 35 (9.59%) Driving Licence
2 27 (7.40%) Onboarding
3 22 (6.03%) Enterprise Software
4 20 (5.48%) Product Ownership
5 18 (4.93%) Cloud Native
6 14 (3.84%) Management Information System
7 13 (3.56%) Self-Motivation
8 9 (2.47%) iPad
8 9 (2.47%) Security Posture
9 7 (1.92%) Hybrid Cloud
9 7 (1.92%) Social Media
10 6 (1.64%) AI Agents
10 6 (1.64%) Client/Server
10 6 (1.64%) Cyber Security Posture
10 6 (1.64%) Legacy Systems
11 5 (1.37%) Analytical Mindset
11 5 (1.37%) EPoS
11 5 (1.37%) NHS
12 4 (1.10%) Data Structures
12 4 (1.10%) Mobile App
Operating Systems
1 97 (26.58%) Windows
2 57 (15.62%) Windows Server
3 31 (8.49%) Windows 10
4 16 (4.38%) Mac OS
5 11 (3.01%) Linux
6 5 (1.37%) Apple iOS
7 4 (1.10%) Windows Server 2016
8 2 (0.55%) Android
8 2 (0.55%) Windows Server 2008
9 1 (0.27%) CentOS
9 1 (0.27%) Ubuntu
9 1 (0.27%) VMS
9 1 (0.27%) Windows Server 2012
9 1 (0.27%) Windows Server 2019
Processes & Methodologies
1 92 (25.21%) Problem-Solving
2 71 (19.45%) ITIL
3 53 (14.52%) Business Intelligence
4 52 (14.25%) Continuous Improvement
5 49 (13.42%) Agile
6 45 (12.33%) CRM
6 45 (12.33%) Service Delivery
7 38 (10.41%) Roadmaps
8 35 (9.59%) AI
9 34 (9.32%) Customer Service
9 34 (9.32%) Mentoring
9 34 (9.32%) Migration
10 33 (9.04%) Disaster Recovery
10 33 (9.04%) Project Management
11 32 (8.77%) Computer Science
12 31 (8.49%) SDLC
12 31 (8.49%) Service Management
13 30 (8.22%) Change Management
14 29 (7.95%) Cybersecurity
14 29 (7.95%) Workflow
Programming Languages
1 44 (12.05%) SQL
2 36 (9.86%) C#
3 33 (9.04%) JavaScript
4 32 (8.77%) PowerShell
5 21 (5.75%) Python
6 10 (2.74%) Bash
6 10 (2.74%) VBA
7 5 (1.37%) T-SQL
8 4 (1.10%) TypeScript
9 3 (0.82%) PHP
9 3 (0.82%) VB.NET
10 2 (0.55%) C++
10 2 (0.55%) Data Analysis Expressions
11 1 (0.27%) R
Qualifications
1 75 (20.55%) Degree
2 54 (14.79%) Microsoft Certification
3 30 (8.22%) Security Cleared
4 28 (7.67%) SC Cleared
5 24 (6.58%) DBS Check
6 18 (4.93%) Computer Science Degree
7 9 (2.47%) Master's Degree
8 8 (2.19%) A+ Certification
9 7 (1.92%) AAT
9 7 (1.92%) ACCA
9 7 (1.92%) CIMA
10 5 (1.37%) CIPD
10 5 (1.37%) MCP
10 5 (1.37%) MCSA
11 4 (1.10%) AWS Certification
11 4 (1.10%) Cisco Certification
11 4 (1.10%) ITIL Certification
12 3 (0.82%) CCNA
12 3 (0.82%) DV Cleared
12 3 (0.82%) ITIL Foundation Certificate
Quality Assurance & Compliance
1 24 (6.58%) GDPR
2 20 (5.48%) SLA
3 15 (4.11%) PMO
4 11 (3.01%) ISO/IEC 27001
4 11 (3.01%) NIST
5 10 (2.74%) Cyber Essentials
6 6 (1.64%) Cyber Essentials PLUS
6 6 (1.64%) QA
7 4 (1.10%) Accessibility
7 4 (1.10%) GRC
7 4 (1.10%) NCSC
8 3 (0.82%) Data Quality
8 3 (0.82%) WCAG
9 1 (0.27%) Actionable Recommendations
9 1 (0.27%) HIPAA
9 1 (0.27%) ISO 22301
System Software
1 97 (26.58%) Active Directory
2 16 (4.38%) Hyper-V
3 12 (3.29%) VMware Infrastructure
4 8 (2.19%) Virtual Desktop
5 3 (0.82%) VMware ESXi
6 2 (0.55%) Virtual Machines
6 2 (0.55%) vSphere
7 1 (0.27%) Docker
7 1 (0.27%) Dovecot
7 1 (0.27%) Postfix
7 1 (0.27%) XenApp
Systems Management
1 84 (23.01%) Microsoft Intune
2 16 (4.38%) Terraform
3 5 (1.37%) FortiGate
4 4 (1.10%) Jamf Pro
4 4 (1.10%) Proxmox
5 3 (0.82%) Nessus
5 3 (0.82%) PaperCut
5 3 (0.82%) Single Sign-On
6 1 (0.27%) Cisco CUCM
6 1 (0.27%) Kubernetes
6 1 (0.27%) SCCM
Vendors
1 287 (78.63%) Microsoft
2 17 (4.66%) Apple
3 13 (3.56%) VMware
4 11 (3.01%) Cisco
5 10 (2.74%) Freshdesk
5 10 (2.74%) Salesforce
6 9 (2.47%) Datto
6 9 (2.47%) Meraki
7 8 (2.19%) Citrix
8 7 (1.92%) Veeam
9 6 (1.64%) HP
9 6 (1.64%) ServiceNow
10 5 (1.37%) Oracle
10 5 (1.37%) Progress
10 5 (1.37%) Sage
10 5 (1.37%) Workday
11 4 (1.10%) Adobe
11 4 (1.10%) Civica
11 4 (1.10%) Google
12 3 (0.82%) Aruba