Hybrid/Remote Cybersecurity Job Trends

Cybersecurity
UK > Work from Home

The table below provides summary statistics and salary benchmarking for remote or hybrid work requiring Cybersecurity skills. It covers vacancies from the 6 months leading up to 18 September 2025, with comparisons to the same periods in the previous two years.

6 months to
18 Sep 2025
Same period 2024 Same period 2023
Rank 32 33 43
Rank change year-on-year +1 +10 +19
Permanent jobs citing Cybersecurity 1,176 1,497 1,571
As % of all permanent jobs with a WFH option 7.22% 6.39% 6.40%
As % of the Processes & Methodologies category 7.74% 7.28% 6.71%
Number of salaries quoted 631 692 1,230
10th Percentile £32,500 £38,000 £40,000
25th Percentile £47,000 £47,500 £48,750
Median annual salary (50th Percentile) £60,000 £60,000 £67,500
Median % change year-on-year - -11.11% +3.85%
75th Percentile £75,000 £79,063 £75,188
90th Percentile £90,000 £97,500 £93,750
UK median annual salary £57,500 £60,000 £64,500
% change year-on-year -4.17% -6.98% -0.77%

All Process and Methodology Skills
Work from Home

Cybersecurity falls under the Processes and Methodologies category. For comparison with the information above, the following table provides summary statistics for all permanent job vacancies with remote or hybrid options requiring process or methodology skills.

Permanent vacancies with a requirement for process or methodology skills 15,185 20,575 23,400
As % of all permanent jobs with a WFH option 93.17% 87.78% 95.29%
Number of salaries quoted 8,609 12,675 19,261
10th Percentile £30,000 £35,500 £37,500
25th Percentile £40,750 £45,000 £47,500
Median annual salary (50th Percentile) £60,000 £60,000 £62,500
Median % change year-on-year - -4.00% +1.71%
75th Percentile £78,750 £80,000 £81,250
90th Percentile £100,000 £100,000 £100,000
UK median annual salary £55,000 £57,500 £60,000
% change year-on-year -4.35% -4.17% -

Cybersecurity
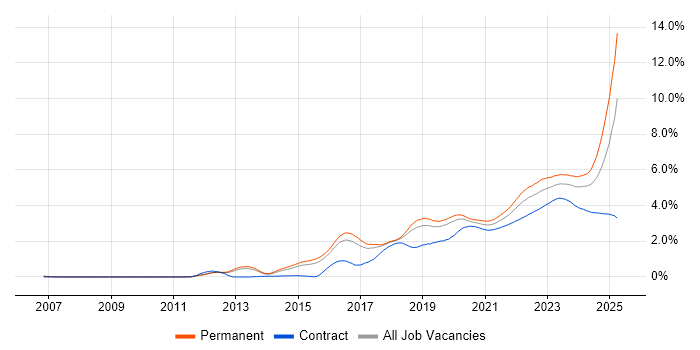
Trend for Jobs with a WFH Option

Job vacancies with remote working options citing Cybersecurity as a proportion of all IT jobs advertised.

Cybersecurity trend for jobs with Hybrid/Remote/WFH options

Cybersecurity
Salary Trend for Jobs with Hybrid Work Options

Salary distribution trend for jobs with remote work options citing Cybersecurity.

Salary distribution trend for jobs with remote work options citing Cybersecurity

Cybersecurity
Salary Histogram for Jobs with a WFH Option

Salary distribution for jobs with remote working options citing Cybersecurity over the 6 months to 18 September 2025.

Cybersecurity salary histogram for jobs with a WFH option

Cybersecurity
Co-occurring Skills and Capabilities with WFH Options by Category

The follow tables expand on the table above by listing co-occurrences grouped by category. The same employment type, locality and period is covered with up to 20 co-occurrences shown in each of the following categories:

Application Platforms
1 33 (2.81%) SharePoint
2 26 (2.21%) Microsoft Exchange
3 20 (1.70%) IIS
4 14 (1.19%) CMS
5 9 (0.77%) Apache Solr
5 9 (0.77%) Confluence
6 4 (0.34%) Oracle Workflow
7 3 (0.26%) nginx
7 3 (0.26%) SAS
8 2 (0.17%) Apache Airflow
8 2 (0.17%) Apache Spark
8 2 (0.17%) SharePoint Server
8 2 (0.17%) Skype for Business
8 2 (0.17%) WordPress
9 1 (0.085%) Apache
Applications
1 35 (2.98%) Microsoft Office
2 10 (0.85%) Microsoft Excel
3 7 (0.60%) MS Visio
4 6 (0.51%) AutoCAD
5 4 (0.34%) Microsoft Project
6 1 (0.085%) Adobe Creative Suite
6 1 (0.085%) GNU Octave
Business Applications
1 18 (1.53%) Dynamics CRM
2 12 (1.02%) NetSuite
3 9 (0.77%) Salesforce CRM
4 4 (0.34%) NEC Housing
5 1 (0.085%) Pegasus Opera
5 1 (0.085%) Sage 50
5 1 (0.085%) Sparx Enterprise Architect
Cloud Services
1 184 (15.65%) Azure
2 140 (11.90%) Microsoft 365
3 83 (7.06%) AWS
4 53 (4.51%) Entra ID
5 50 (4.25%) Power Platform
6 33 (2.81%) SaaS
7 26 (2.21%) Dynamics 365
8 20 (1.70%) Azure DevOps
9 18 (1.53%) PowerApps
10 16 (1.36%) Azure Sentinel
11 14 (1.19%) GitHub
12 13 (1.11%) Power Automate
13 10 (0.85%) GCP
13 10 (0.85%) GitHub Actions
14 9 (0.77%) Cloudflare
14 9 (0.77%) IaaS
15 8 (0.68%) PaaS
16 7 (0.60%) dbt
17 6 (0.51%) Azure Monitor
17 6 (0.51%) Google Analytics
Communications & Networking
1 114 (9.69%) Firewall
2 80 (6.80%) Network Security
3 64 (5.44%) VPN
4 28 (2.38%) TCP/IP
5 27 (2.30%) WAN
6 26 (2.21%) DNS
7 25 (2.13%) VoIP
8 23 (1.96%) DHCP
8 23 (1.96%) LAN
9 20 (1.70%) Intrusion Detection
10 17 (1.45%) SD-WAN
10 17 (1.45%) Unified Communications
11 12 (1.02%) VLAN
12 11 (0.94%) Wi-Fi
12 11 (0.94%) Wireless
12 11 (0.94%) Wireshark
13 8 (0.68%) Modbus
14 6 (0.51%) DMZ
14 6 (0.51%) HSRP
14 6 (0.51%) VRRP
Database & Business Intelligence
1 29 (2.47%) Power BI
1 29 (2.47%) SQL Server
2 11 (0.94%) MongoDB
3 10 (0.85%) Elasticsearch
3 10 (0.85%) Tableau
4 9 (0.77%) MySQL
5 8 (0.68%) Relational Database
6 7 (0.60%) Metadata
7 6 (0.51%) Amazon RDS
8 5 (0.43%) SQL Server Integration Services
9 4 (0.34%) Azure SQL Database
9 4 (0.34%) BusinessObjects
9 4 (0.34%) Data Warehouse
9 4 (0.34%) MS Access
9 4 (0.34%) SAP Data Services
10 2 (0.17%) EDMS
11 1 (0.085%) DB2
11 1 (0.085%) GIS
11 1 (0.085%) Neo4j
11 1 (0.085%) RDBMS
Development Applications
1 14 (1.19%) JIRA
2 12 (1.02%) Git
3 7 (0.60%) TeamCity
4 5 (0.43%) Jenkins
5 4 (0.34%) Toad
6 3 (0.26%) Babel
6 3 (0.26%) GitLab
6 3 (0.26%) gulp
6 3 (0.26%) Rational DOORS
6 3 (0.26%) webpack
7 2 (0.17%) Burp Suite
7 2 (0.17%) Metasploit
7 2 (0.17%) Snyk
8 1 (0.085%) Artifactory
8 1 (0.085%) Atlassian Bamboo
8 1 (0.085%) Bitbucket
8 1 (0.085%) Cucumber
8 1 (0.085%) Cypress.io
8 1 (0.085%) Sonatype Nexus
8 1 (0.085%) Zephyr
General
1 364 (30.95%) Inclusion and Diversity
2 355 (30.19%) Social Skills
3 326 (27.72%) Legal
4 322 (27.38%) Law
5 195 (16.58%) Finance
6 162 (13.78%) Analytical Skills
7 113 (9.61%) Telecoms
8 110 (9.35%) Public Sector
9 76 (6.46%) Marketing
10 62 (5.27%) Electronics
11 59 (5.02%) Manufacturing
12 37 (3.15%) Organisational Skills
13 29 (2.47%) Banking
13 29 (2.47%) Presentation Skills
14 23 (1.96%) Influencing Skills
14 23 (1.96%) Retail
15 20 (1.70%) Back Office
16 19 (1.62%) Documentation Skills
17 15 (1.28%) Aerospace
18 10 (0.85%) German Language
Job Titles
1 100 (8.50%) Analyst
2 98 (8.33%) Senior
3 84 (7.14%) Consultant
4 65 (5.53%) Architect
5 62 (5.27%) Security Consultant
6 48 (4.08%) Cybersecurity Consultant
7 46 (3.91%) IT Manager
8 45 (3.83%) Security Analyst
9 44 (3.74%) Lead
10 41 (3.49%) Security Engineer
11 35 (2.98%) IT Support
11 35 (2.98%) Support Engineer
12 33 (2.81%) Security Manager
13 32 (2.72%) Developer
14 30 (2.55%) Security Architect
15 29 (2.47%) Graduate
16 26 (2.21%) IT Analyst
17 25 (2.13%) Cybersecurity Engineer
17 25 (2.13%) Sales Executive
18 24 (2.04%) Cybersecurity Analyst
Libraries, Frameworks & Software Standards
1 19 (1.62%) .NET
2 17 (1.45%) Node.js
3 16 (1.36%) React
4 14 (1.19%) Web Services
5 11 (0.94%) Kafka
6 7 (0.60%) EDI
6 7 (0.60%) OAuth
6 7 (0.60%) REST
7 6 (0.51%) HTML
7 6 (0.51%) JSON
7 6 (0.51%) XML
8 5 (0.43%) CSS
8 5 (0.43%) FreeSWITCH
8 5 (0.43%) SAML
8 5 (0.43%) SAP CAF
9 4 (0.34%) .NET Framework
9 4 (0.34%) MERN Stack
9 4 (0.34%) ML.NET
9 4 (0.34%) Svelte
9 4 (0.34%) Vue
Miscellaneous
1 292 (24.83%) Cyberattack
2 85 (7.23%) Data Centre
3 78 (6.63%) Management Information System
4 39 (3.32%) Cyber Threat
5 33 (2.81%) Analytical Mindset
5 33 (2.81%) Security Posture
6 29 (2.47%) Operational Technology
7 22 (1.87%) Driving Licence
7 22 (1.87%) Product Ownership
8 21 (1.79%) FPGA
8 21 (1.79%) Security Operations Centre
9 20 (1.70%) Cloud Native
9 20 (1.70%) Self-Motivation
10 19 (1.62%) PMI
11 16 (1.36%) CESG
11 16 (1.36%) Onboarding
12 14 (1.19%) Social Media
13 13 (1.11%) Cyber Kill Chain
13 13 (1.11%) e-Learning
13 13 (1.11%) PKI
Operating Systems
1 132 (11.22%) Windows
2 66 (5.61%) Linux
3 54 (4.59%) Windows Server
4 29 (2.47%) Windows 10
5 16 (1.36%) Apple iOS
5 16 (1.36%) Unix
6 9 (0.77%) Android
7 7 (0.60%) Mac OS
8 5 (0.43%) Debian
8 5 (0.43%) Mac OS X
9 4 (0.34%) Windows Server 2016
9 4 (0.34%) Windows Server 2019
10 3 (0.26%) Ubuntu
11 2 (0.17%) Kali Linux
11 2 (0.17%) Red Hat Enterprise Linux
11 2 (0.17%) Windows Server 2003
12 1 (0.085%) Check Point GAiA
Processes & Methodologies
1 299 (25.43%) Creative Thinking
2 298 (25.34%) Line Management
3 177 (15.05%) Problem-Solving
4 152 (12.93%) Risk Management
5 141 (11.99%) Information Security
6 123 (10.46%) Continuous Improvement
7 104 (8.84%) Artificial Intelligence
8 103 (8.76%) Incident Response
9 99 (8.42%) Agile
9 99 (8.42%) Vulnerability Management
10 97 (8.25%) ITIL
11 96 (8.16%) Project Management
12 91 (7.74%) Mentoring
13 87 (7.40%) Analytics
14 84 (7.14%) DevOps
15 83 (7.06%) Roadmaps
15 83 (7.06%) SIEM
16 79 (6.72%) Business Intelligence
17 66 (5.61%) Decision-Making
18 63 (5.36%) Security Operations
Programming Languages
1 62 (5.27%) Python
2 48 (4.08%) SQL
3 40 (3.40%) PowerShell
4 22 (1.87%) C#
5 19 (1.62%) JavaScript
6 12 (1.02%) Bash
7 11 (0.94%) TypeScript
8 9 (0.77%) T-SQL
9 7 (0.60%) Perl
9 7 (0.60%) R
10 6 (0.51%) MATLAB
10 6 (0.51%) PHP
11 5 (0.43%) Java
11 5 (0.43%) Kusto Query Language
11 5 (0.43%) Shell Script
12 4 (0.34%) C++
12 4 (0.34%) VB
13 3 (0.26%) Go
13 3 (0.26%) Groovy
13 3 (0.26%) Progress 4GL
Qualifications
1 198 (16.84%) Degree
2 181 (15.39%) Security Cleared
3 143 (12.16%) CISSP
4 104 (8.84%) CISM
5 102 (8.67%) SC Cleared
6 49 (4.17%) CompTIA Security+
7 46 (3.91%) PMI Certification
8 45 (3.83%) DV Cleared
9 43 (3.66%) CEH
10 37 (3.15%) Computer Science Degree
11 30 (2.55%) CISA
11 30 (2.55%) Cisco Certification
12 28 (2.38%) PMP
13 27 (2.30%) CRISC
14 24 (2.04%) Microsoft Certification
15 23 (1.96%) Master's Degree
16 22 (1.87%) CISMP
17 20 (1.70%) CCNP
18 18 (1.53%) GCIA
19 17 (1.45%) BPSS Clearance
Quality Assurance & Compliance
1 339 (28.83%) NCSC
2 185 (15.73%) ISO/IEC 27001
3 171 (14.54%) NIST
4 61 (5.19%) Cyber Essentials
5 55 (4.68%) GDPR
6 41 (3.49%) PCI DSS
7 37 (3.15%) GRC
8 34 (2.89%) NIST 800
9 25 (2.13%) QA
10 23 (1.96%) JSP 440
11 20 (1.70%) Cyber Essentials PLUS
11 20 (1.70%) SLA
12 17 (1.45%) RMADS
13 16 (1.36%) HMG Security Policy Framework
14 15 (1.28%) PMO
14 15 (1.28%) SOC 2
15 13 (1.11%) Data Quality
16 10 (0.85%) SOC 1
17 9 (0.77%) COBIT
18 7 (0.60%) ISO 9001
System Software
1 70 (5.95%) Active Directory
2 30 (2.55%) Virtual Machines
3 27 (2.30%) VMware Infrastructure
4 17 (1.45%) Hyper-V
5 13 (1.11%) Docker
6 12 (1.02%) Firmware
7 8 (0.68%) vSphere
8 6 (0.51%) Virtual Desktop
9 5 (0.43%) Kamailio
10 2 (0.17%) BitLocker
11 1 (0.085%) Terminal Services
11 1 (0.085%) VMware ESXi
Systems Management
1 46 (3.91%) Microsoft Intune
2 15 (1.28%) Terraform
3 10 (0.85%) Ansible
3 10 (0.85%) RSA Archer
4 9 (0.77%) Kubernetes
5 7 (0.60%) Jamf Pro
6 5 (0.43%) Nessus
6 5 (0.43%) QRadar
6 5 (0.43%) Single Sign-On
7 4 (0.34%) SCOM
8 3 (0.26%) Functional Safety
8 3 (0.26%) Progress Chef
8 3 (0.26%) Proxmox
9 2 (0.17%) Argo
9 2 (0.17%) Nmap
9 2 (0.17%) Puppet
9 2 (0.17%) SCOrch
9 2 (0.17%) SCSM
9 2 (0.17%) Suricata
9 2 (0.17%) ZENworks
Vendors
1 266 (22.62%) Microsoft
2 56 (4.76%) SAP
3 52 (4.42%) Cisco
4 50 (4.25%) VMware
5 37 (3.15%) Apple
6 30 (2.55%) Palo Alto
7 29 (2.47%) Salesforce
8 25 (2.13%) Adobe
8 25 (2.13%) Tenable
9 21 (1.79%) Qualys
10 18 (1.53%) Oracle
11 17 (1.45%) Google
12 12 (1.02%) Fortinet
12 12 (1.02%) ServiceNow
13 11 (0.94%) Meraki
14 9 (0.77%) Splunk
15 8 (0.68%) Progress
16 7 (0.60%) Dell
16 7 (0.60%) HubSpot
17 6 (0.51%) Extreme Networks