PRINCE2 Jobs with Hybrid/Remote/WFH Options

PRINCE 2
UK > Work from Home

The table below provides summary statistics for permanent remote or hybrid work requiring PRINCE2 skills. It includes a benchmarking guide to the annual salaries offered in vacancies that cited PRINCE2 over the 6 months leading up to 6 July 2025, comparing them to the same period in the previous two years.

6 months to
6 Jul 2025
Same period 2024 Same period 2023
Rank 253 194 182
Rank change year-on-year -59 -12 +38
Permanent jobs citing PRINCE2 241 594 697
As % of all permanent jobs with a WFH option 1.17% 1.75% 1.93%
As % of the Processes & Methodologies category 1.26% 1.96% 2.01%
Number of salaries quoted 199 488 556
10th Percentile £37,500 £39,604 £39,000
25th Percentile £49,875 £45,000 £45,300
Median annual salary (50th Percentile) £63,000 £55,000 £55,000
Median % change year-on-year +14.55% - -0.25%
75th Percentile £72,500 £68,750 £66,250
90th Percentile £88,000 £80,000 £76,875
UK median annual salary £65,000 £54,000 £60,000
% change year-on-year +20.37% -10.00% +9.09%

All Process and Methodology Skills
Work from Home

PRINCE2 falls under the Processes and Methodologies category. For comparison with the information above, the following table provides summary statistics for all permanent job vacancies with remote or hybrid options requiring process or methodology skills.

Permanent vacancies with a requirement for process or methodology skills 19,203 30,363 34,629
As % of all permanent jobs with a WFH option 93.10% 89.23% 96.01%
Number of salaries quoted 10,245 22,461 25,124
10th Percentile £25,313 £33,750 £37,500
25th Percentile £39,750 £42,500 £47,500
Median annual salary (50th Percentile) £57,500 £57,500 £62,500
Median % change year-on-year - -8.00% +4.17%
75th Percentile £76,250 £75,772 £81,250
90th Percentile £100,000 £95,000 £100,000
UK median annual salary £55,000 £55,000 £60,249
% change year-on-year - -8.71% +0.42%

PRINCE2
Trend for Jobs with a WFH Option

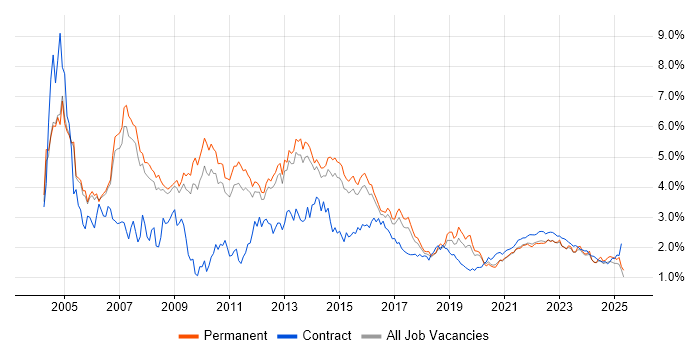
Job vacancies with remote working options citing PRINCE2 as a proportion of all IT jobs advertised.

PRINCE2 trend for jobs with Hybrid/Remote/WFH options

PRINCE2
Salary Trend for Jobs with a WFH Option

3-month moving average salary quoted in job vacancies with remote working options citing PRINCE2.

PRINCE2 salary trend for jobs with a WFH option

PRINCE2
Salary Histogram for Jobs with a WFH Option

Salary distribution for jobs with remote working options citing PRINCE2 over the 6 months to 6 July 2025.

PRINCE2 salary histogram for jobs with a WFH option

PRINCE2
Co-occurring Skills and Capabilities with WFH Options by Category

The follow tables expand on the table above by listing co-occurrences grouped by category. The same employment type, locality and period is covered with up to 20 co-occurrences shown in each of the following categories:

Application Platforms
1 7 (2.90%) SharePoint
2 3 (1.24%) Apache
2 3 (1.24%) CMS
2 3 (1.24%) IIS
3 2 (0.83%) Confluence
3 2 (0.83%) Microsoft Exchange
3 2 (0.83%) ThingWorx
3 2 (0.83%) WordPress
4 1 (0.41%) Kentico
Applications
1 29 (12.03%) Microsoft Project
2 17 (7.05%) Microsoft Excel
3 13 (5.39%) MS Visio
4 11 (4.56%) Microsoft Office
4 11 (4.56%) Microsoft PowerPoint
5 9 (3.73%) Trello
6 3 (1.24%) Spreadsheet
Business Applications
1 7 (2.90%) Oracle ERP
2 5 (2.07%) CA PPM
3 4 (1.66%) Elite 3E
4 2 (0.83%) Dynamics CRM
5 1 (0.41%) Dynamics NAV
5 1 (0.41%) Magento
5 1 (0.41%) Payment Gateway
5 1 (0.41%) Primavera
5 1 (0.41%) Salesforce CRM
5 1 (0.41%) SAP PM
5 1 (0.41%) SAP S/4HANA
5 1 (0.41%) Workday HCM
Cloud Services
1 30 (12.45%) Azure
2 18 (7.47%) SaaS
3 12 (4.98%) Microsoft 365
4 11 (4.56%) Azure DevOps
5 10 (4.15%) IaaS
6 9 (3.73%) Power Platform
7 7 (2.90%) AWS
8 6 (2.49%) Dynamics 365
8 6 (2.49%) GCP
8 6 (2.49%) Smartsheet
9 5 (2.07%) Entra ID
10 4 (1.66%) Cloud Computing
10 4 (1.66%) Snowflake
11 3 (1.24%) Mimecast
11 3 (1.24%) Nutanix
12 2 (0.83%) Google Analytics
12 2 (0.83%) Google Tag Manager
13 1 (0.41%) BigCommerce
13 1 (0.41%) OneDrive
13 1 (0.41%) SuccessFactors
Communications & Networking
1 5 (2.07%) Firewall
2 4 (1.66%) DNS
3 3 (1.24%) LAN
3 3 (1.24%) Network Security
4 2 (0.83%) DHCP
4 2 (0.83%) VPN
4 2 (0.83%) WAN
5 1 (0.41%) IPsec
5 1 (0.41%) SD-WAN
5 1 (0.41%) SSL
5 1 (0.41%) Wireless
5 1 (0.41%) WLAN
Database & Business Intelligence
1 27 (11.20%) SQL Server
2 15 (6.22%) PostgreSQL
3 9 (3.73%) Power BI
4 7 (2.90%) Electronic Patient Records
5 4 (1.66%) Data Lake
5 4 (1.66%) Hadoop
5 4 (1.66%) SAP HANA
6 2 (0.83%) Tableau
7 1 (0.41%) Redis
Development Applications
1 34 (14.11%) JIRA
2 4 (1.66%) Katalon Studio
2 4 (1.66%) Selenium
General
1 121 (50.21%) Social Skills
2 84 (34.85%) Finance
3 48 (19.92%) Analytical Skills
4 33 (13.69%) Law
5 32 (13.28%) Public Sector
6 26 (10.79%) Marketing
7 22 (9.13%) Manufacturing
8 21 (8.71%) Telecoms
9 19 (7.88%) Electronics
10 15 (6.22%) Presentation Skills
11 13 (5.39%) Retail
12 12 (4.98%) Organisational Skills
13 9 (3.73%) Legal
13 9 (3.73%) Public Speaking
14 7 (2.90%) Inclusion and Diversity
15 6 (2.49%) Health Technology
15 6 (2.49%) Influencing Skills
16 3 (1.24%) Automotive
16 3 (1.24%) Aviation
16 3 (1.24%) Documentation Skills
Job Titles
1 102 (42.32%) Project Manager
2 29 (12.03%) IT Manager
3 24 (9.96%) IT Project Manager
4 21 (8.71%) Senior
5 19 (7.88%) Programme Manager
5 19 (7.88%) Senior Manager
6 17 (7.05%) Lead
7 16 (6.64%) Senior Project Manager
8 12 (4.98%) Analyst
8 12 (4.98%) Team Leader
9 11 (4.56%) Database Team Leader
9 11 (4.56%) Development Team Leader
10 10 (4.15%) ERP Manager
11 7 (2.90%) Head of IT
11 7 (2.90%) Implementation Manager
11 7 (2.90%) SAP Manager
11 7 (2.90%) SAP Project Manager
11 7 (2.90%) Technical Manager
12 6 (2.49%) PMO Manager
12 6 (2.49%) Project Engineer
Libraries, Frameworks & Software Standards
1 4 (1.66%) CSS
1 4 (1.66%) HTML
2 2 (0.83%) JSON
3 1 (0.41%) ADO
3 1 (0.41%) FHIR
3 1 (0.41%) Middleware
3 1 (0.41%) Oracle Fusion
Miscellaneous
1 30 (12.45%) PMI
2 14 (5.81%) Management Information System
2 14 (5.81%) Product Ownership
3 8 (3.32%) Social Media
4 7 (2.90%) Enterprise Software
4 7 (2.90%) Onboarding
5 5 (2.07%) Data Centre
5 5 (2.07%) Driving Licence
5 5 (2.07%) NHS
6 4 (1.66%) IoT
6 4 (1.66%) Legacy Applications
6 4 (1.66%) Legacy Systems
6 4 (1.66%) Self-Motivation
6 4 (1.66%) Virtual Team
7 3 (1.24%) Cloud Native
7 3 (1.24%) Industrial Internet of Things
7 3 (1.24%) Operational Technology
7 3 (1.24%) SCADA
8 2 (0.83%) Market Risk
8 2 (0.83%) Tandem
Operating Systems
1 22 (9.13%) Windows
2 15 (6.22%) Linux
3 11 (4.56%) Windows Server
4 8 (3.32%) Windows Vista
Processes & Methodologies
1 181 (75.10%) Project Management
2 146 (60.58%) Agile
3 112 (46.47%) Project Delivery
4 89 (36.93%) Stakeholder Management
5 76 (31.54%) Problem-Solving
6 58 (24.07%) Continuous Improvement
7 49 (20.33%) Risk Management
8 44 (18.26%) Programme Management
9 41 (17.01%) Mentoring
10 37 (15.35%) Process Improvement
11 36 (14.94%) Change Management
12 33 (13.69%) Coaching
12 33 (13.69%) Cybersecurity
13 32 (13.28%) Business Intelligence
13 32 (13.28%) Waterfall
14 31 (12.86%) ITIL
14 31 (12.86%) Migration
15 29 (12.03%) Budget Management
16 28 (11.62%) Business Case
17 26 (10.79%) Data Migration
Programming Languages
1 24 (9.96%) SQL
2 2 (0.83%) C#
2 2 (0.83%) Java
2 2 (0.83%) JavaScript
2 2 (0.83%) PowerShell
2 2 (0.83%) T-SQL
3 1 (0.41%) ABAP
3 1 (0.41%) PHP
Qualifications
1 77 (31.95%) PMI Certification
2 68 (28.22%) Degree
3 63 (26.14%) PMP
4 29 (12.03%) Security Cleared
5 21 (8.71%) PRINCE2 Practitioner
6 20 (8.30%) DV Cleared
7 14 (5.81%) Computer Science Degree
8 11 (4.56%) DBS Check
9 8 (3.32%) Master's Degree
10 6 (2.49%) PRINCE2 Certification
11 4 (1.66%) CAPM
11 4 (1.66%) ISTQB
11 4 (1.66%) ITIL Certification
11 4 (1.66%) SAP Certification
12 3 (1.24%) Microsoft Certification
12 3 (1.24%) SC Cleared
13 2 (0.83%) BPSS Clearance
13 2 (0.83%) ISEB
13 2 (0.83%) MCSE
13 2 (0.83%) TOGAF Certification
Quality Assurance & Compliance
1 35 (14.52%) PMO
2 27 (11.20%) QA
3 17 (7.05%) ISO 9001
4 6 (2.49%) P3O
5 5 (2.07%) Data Quality
5 5 (2.07%) GDPR
5 5 (2.07%) ISO/IEC 27001
6 4 (1.66%) Accessibility
7 3 (1.24%) COBIT
7 3 (1.24%) GRC
7 3 (1.24%) PMBOK
8 2 (0.83%) WCAG
9 1 (0.41%) Cyber Essentials
9 1 (0.41%) Cyber Essentials PLUS
9 1 (0.41%) HL7
9 1 (0.41%) NIST 800
9 1 (0.41%) PCI DSS
9 1 (0.41%) Sarbanes-Oxley
9 1 (0.41%) SLA
9 1 (0.41%) SOC 2
System Software
1 12 (4.98%) Active Directory
2 9 (3.73%) VMware Infrastructure
3 3 (1.24%) Hyper-V
4 1 (0.41%) Docker
4 1 (0.41%) Varnish
4 1 (0.41%) Virtual Machines
Systems Management
1 3 (1.24%) Ansible
2 2 (0.83%) Kubernetes
3 1 (0.41%) FortiGate
3 1 (0.41%) Microsoft Intune
3 1 (0.41%) RSA Archer
3 1 (0.41%) Terraform
Vendors
1 63 (26.14%) Microsoft
2 34 (14.11%) SAP
3 11 (4.56%) Salesforce
4 10 (4.15%) VMware
5 9 (3.73%) Oracle
6 7 (2.90%) Google
7 6 (2.49%) PeopleSoft
8 5 (2.07%) Pegasus
8 5 (2.07%) Planview
9 4 (1.66%) Databricks
9 4 (1.66%) Palo Alto
9 4 (1.66%) ServiceNow
9 4 (1.66%) Teradata
10 3 (1.24%) Cisco
10 3 (1.24%) SolarWinds
11 2 (0.83%) Snow
11 2 (0.83%) Workday
12 1 (0.41%) Adaptive Insights
12 1 (0.41%) Freshdesk
12 1 (0.41%) HubSpot