Documentation Skills Contracts with Hybrid/Remote/WFH Options

Documentation Skills
UK > Work from Home

The table below looks at the prevalence of the term Documentation Skills in remote or hybrid contract work. Included is a benchmarking guide to the contractor rates offered in vacancies that cited Documentation Skills over the 6 months leading up to 18 June 2025, comparing them to the same period in the previous two years.

6 months to
18 Jun 2025
Same period 2024 Same period 2023
Rank 194 254 243
Rank change year-on-year +60 -11 +80
Contract jobs citing Documentation Skills 111 87 222
As % of all contract jobs with a WFH option 1.14% 0.59% 0.93%
As % of the General category 1.81% 1.01% 1.60%
Number of daily rates quoted 67 67 142
10th Percentile £391 £363 £350
25th Percentile £419 £425 £410
Median daily rate (50th Percentile) £500 £500 £500
Median % change year-on-year - - -4.76%
75th Percentile £632 £600 £574
90th Percentile £750 £658 £650
UK median daily rate £500 £500 £500
% change year-on-year - - -4.76%
Number of hourly rates quoted 1 5 23
10th Percentile - - £63.25
25th Percentile £19.18 £16.50 £70.00
Median hourly rate £19.36 £17.00 £75.00
Median % change year-on-year +13.88% -77.33% +27.12%
75th Percentile £19.54 £17.50 £76.88
90th Percentile - £28.00 £80.25
UK median hourly rate £28.75 £17.00 £72.50
% change year-on-year +69.12% -76.55% +33.03%

All General Skills
Work from Home

Documentation Skills falls under the General Skills category. For comparison with the information above, the following table provides summary statistics for all contract job vacancies with remote or hybrid options requiring common skills.

Contract vacancies with a requirement for common skills 6,120 8,616 13,911
As % of all contract jobs with a WFH option 62.71% 58.33% 58.45%
Number of daily rates quoted 4,088 5,671 9,829
10th Percentile £325 £325 £363
25th Percentile £413 £425 £450
Median daily rate (50th Percentile) £515 £538 £550
Median % change year-on-year -4.19% -2.27% +3.77%
75th Percentile £650 £650 £675
90th Percentile £800 £775 £785
UK median daily rate £503 £525 £550
% change year-on-year -4.29% -4.55% +0.92%
Number of hourly rates quoted 187 461 315
10th Percentile £14.00 £14.00 £18.66
25th Percentile £17.21 £22.50 £25.71
Median hourly rate £33.40 £38.12 £49.00
Median % change year-on-year -12.38% -22.20% +40.00%
75th Percentile £65.00 £52.50 £67.50
90th Percentile £79.25 £72.50 £78.45
UK median hourly rate £27.64 £30.50 £30.52
% change year-on-year -9.38% -0.07% +27.65%

Documentation Skills
Trend for Jobs with a WFH Option

Job vacancies with remote working options citing Documentation Skills as a proportion of all IT jobs advertised.
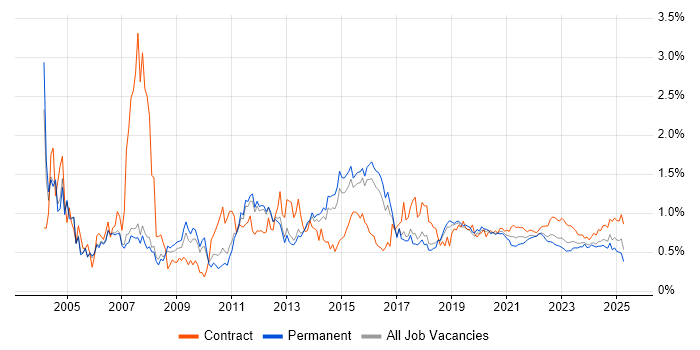
Documentation Skills trend for jobs with Hybrid/Remote/WFH options

Documentation Skills
Daily Rate Trend for Jobs with a WFH Option

3-month moving average daily rate quoted in job vacancies with remote working options citing Documentation Skills.

Documentation Skills daily rate for jobs with a WFH option

Documentation Skills
Daily Rate Histogram for Jobs with a WFH Option

Daily rate distribution for jobs with remote working options citing Documentation Skills over the 6 months to 18 June 2025.

Documentation Skills daily rate histogram for jobs with a WFH option

Documentation Skills
Hourly Rate Trend for Jobs with a WFH Option

3-month moving average hourly rate quoted in job vacancies with remote working options citing Documentation Skills.

Documentation Skills hourly rate for jobs with a WFH option

Documentation Skills
Co-occurring Skills and Capabilities with WFH Options by Category

The follow tables expand on the table above by listing co-occurrences grouped by category. The same employment type, locality and period is covered with up to 20 co-occurrences shown in each of the following categories:

Application Platforms
1 20 (18.02%) SharePoint
2 9 (8.11%) Confluence
3 5 (4.50%) Microsoft Exchange
4 3 (2.70%) Exchange Server 2013
4 3 (2.70%) Oracle Coherence
5 2 (1.80%) OpenStack
6 1 (0.90%) Apache
6 1 (0.90%) Apache Spark
6 1 (0.90%) WebLogic
Applications
1 7 (6.31%) Microsoft Office
2 5 (4.50%) Microsoft Excel
3 3 (2.70%) MS Visio
4 1 (0.90%) Adobe XD
4 1 (0.90%) Chatbot
4 1 (0.90%) Sketch
Business Applications
1 4 (3.60%) CA PPM
2 3 (2.70%) Dynamics CRM
2 3 (2.70%) Oracle EBS
3 1 (0.90%) Aladdin
3 1 (0.90%) Oracle Receivables
3 1 (0.90%) Salesforce CRM
3 1 (0.90%) SAP S/4HANA
Cloud Services
1 25 (22.52%) Azure
2 18 (16.22%) AWS
3 16 (14.41%) Microsoft 365
4 10 (9.01%) Amazon S3
5 9 (8.11%) Amazon EC2
6 8 (7.21%) Amazon SQS
6 8 (7.21%) Power Platform
6 8 (7.21%) SaaS
7 5 (4.50%) Azure DevOps
7 5 (4.50%) PowerApps
8 4 (3.60%) Entra ID
8 4 (3.60%) GitHub
9 3 (2.70%) GCP
9 3 (2.70%) Mimecast
9 3 (2.70%) OneDrive
10 2 (1.80%) Azure Key Vault
10 2 (1.80%) Dynamics 365
10 2 (1.80%) Serverless
10 2 (1.80%) Yammer
11 1 (0.90%) Azure Event Grid
Communications & Networking
1 4 (3.60%) DNS
2 3 (2.70%) BGP
2 3 (2.70%) DHCP
2 3 (2.70%) Ethernet VPN
2 3 (2.70%) Multicast
2 3 (2.70%) NAS
2 3 (2.70%) Unified Communications
2 3 (2.70%) VXLAN
3 2 (1.80%) NetScaler
3 2 (1.80%) OSPF
3 2 (1.80%) Wi-Fi
4 1 (0.90%) Cisco Nexus
4 1 (0.90%) Converged Networks
4 1 (0.90%) Firewall
4 1 (0.90%) IGMP
4 1 (0.90%) Network Security
4 1 (0.90%) NX-OS
4 1 (0.90%) SSL
4 1 (0.90%) TCP/IP
Database & Business Intelligence
1 6 (5.41%) Metadata
1 6 (5.41%) Relational Database
2 4 (3.60%) Data Warehouse
2 4 (3.60%) Power BI
3 3 (2.70%) Apache Cassandra
3 3 (2.70%) Big Data
3 3 (2.70%) Data Lake
4 1 (0.90%) Amazon Redshift
4 1 (0.90%) BigQuery
4 1 (0.90%) BusinessObjects
4 1 (0.90%) Delta Lake
4 1 (0.90%) InfluxDB
4 1 (0.90%) Looker
4 1 (0.90%) MongoDB
4 1 (0.90%) NoSQL
4 1 (0.90%) Oracle Database
4 1 (0.90%) Power Query
4 1 (0.90%) RDBMS
4 1 (0.90%) SAP HANA
4 1 (0.90%) SQL Server
Development Applications
1 12 (10.81%) JIRA
2 4 (3.60%) Git
2 4 (3.60%) Jenkins
2 4 (3.60%) Visual Studio
3 3 (2.70%) ER Studio
3 3 (2.70%) ERwin
4 2 (1.80%) AdminStudio
4 2 (1.80%) MSI
5 1 (0.90%) Bitbucket
5 1 (0.90%) GitLab
5 1 (0.90%) JUnit
5 1 (0.90%) Selenium
5 1 (0.90%) Sonatype Nexus
5 1 (0.90%) TestNG
5 1 (0.90%) TestRail
5 1 (0.90%) WebDriver
5 1 (0.90%) Zephyr
General
1 65 (58.56%) Social Skills
2 21 (18.92%) Finance
3 16 (14.41%) Analytical Skills
3 16 (14.41%) Public Sector
4 14 (12.61%) Presentation Skills
5 7 (6.31%) Banking
6 5 (4.50%) Retail Banking
7 4 (3.60%) Arabic Language
7 4 (3.60%) Czech Language
7 4 (3.60%) Pharmaceutical
8 3 (2.70%) Telecoms
9 2 (1.80%) Back Office
9 2 (1.80%) Military
9 2 (1.80%) Police
10 1 (0.90%) Corporate Banking
10 1 (0.90%) Electronics
10 1 (0.90%) Fire and Rescue
10 1 (0.90%) Inclusion and Diversity
10 1 (0.90%) Marketing
10 1 (0.90%) Organisational Skills
Job Titles
1 18 (16.22%) Analyst
2 17 (15.32%) Architect
3 13 (11.71%) Consultant
4 9 (8.11%) Developer
4 9 (8.11%) Security Architect
5 8 (7.21%) Business Analyst
6 7 (6.31%) Senior
7 6 (5.41%) Solutions Architect
8 5 (4.50%) Incident Manager
8 5 (4.50%) Tester
9 4 (3.60%) Lead
9 4 (3.60%) Remote Support Analyst
9 4 (3.60%) Solutions Analyst
9 4 (3.60%) Support Analyst
10 3 (2.70%) C# Developer
10 3 (2.70%) Data Modeller
10 3 (2.70%) Migration Engineer
10 3 (2.70%) Power Platform Developer
10 3 (2.70%) QA Tester
10 3 (2.70%) Software Developer
Libraries, Frameworks & Software Standards
1 5 (4.50%) REST
2 3 (2.70%) Kafka
2 3 (2.70%) SailPoint
3 2 (1.80%) .NET
3 2 (1.80%) Middleware
3 2 (1.80%) Node.js
3 2 (1.80%) RESTful
4 1 (0.90%) .NET Framework
4 1 (0.90%) LDAP
4 1 (0.90%) Oracle GoldenGate
4 1 (0.90%) SOAP
4 1 (0.90%) Web Services
4 1 (0.90%) YAML
Miscellaneous
1 12 (10.81%) Onboarding
2 8 (7.21%) CSOC
2 8 (7.21%) Security Operations Centre
3 7 (6.31%) Management Information System
3 7 (6.31%) Product Ownership
4 5 (4.50%) Data Centre
5 4 (3.60%) Legacy Systems
6 3 (2.70%) Distributed Systems
6 3 (2.70%) Team-Oriented Environment
7 2 (1.80%) Algorithms
7 2 (1.80%) CMDB
7 2 (1.80%) Data Structures
7 2 (1.80%) Enterprise Software
7 2 (1.80%) Linux Command Line
7 2 (1.80%) SCADA
7 2 (1.80%) Security Posture
7 2 (1.80%) Virtual Team
8 1 (0.90%) Online Gambling
8 1 (0.90%) Operational Technology
8 1 (0.90%) Social Media
Operating Systems
1 9 (8.11%) Windows
2 6 (5.41%) Linux
3 3 (2.70%) Windows Server
4 2 (1.80%) Red Hat Enterprise Linux
4 2 (1.80%) Unix
5 1 (0.90%) AIX
5 1 (0.90%) Data ONTAP
5 1 (0.90%) Solaris
5 1 (0.90%) Windows 10
Processes & Methodologies
1 30 (27.03%) Problem-Solving
2 27 (24.32%) Agile
3 19 (17.12%) DevOps
4 15 (13.51%) Migration
5 13 (11.71%) Stakeholder Management
5 13 (11.71%) Use Case
6 12 (10.81%) CI/CD
6 12 (10.81%) Data Modelling
7 11 (9.91%) Cybersecurity
8 9 (8.11%) Change Management
8 9 (8.11%) User Acceptance Testing
8 9 (8.11%) User Experience
9 8 (7.21%) Scrum
9 8 (7.21%) Security Operations
9 8 (7.21%) SIEM
9 8 (7.21%) SOAR
10 7 (6.31%) GAP Analysis
10 7 (6.31%) Risk Management
10 7 (6.31%) Translating Business Requirements
10 7 (6.31%) Validation
Programming Languages
1 13 (11.71%) SQL
2 9 (8.11%) Python
3 7 (6.31%) Java
4 6 (5.41%) PowerShell
5 4 (3.60%) C#
5 4 (3.60%) R
6 3 (2.70%) JavaScript
6 3 (2.70%) PL/SQL
7 2 (1.80%) Bash
8 1 (0.90%) Data Analysis Expressions
8 1 (0.90%) Perl
8 1 (0.90%) Shell Script
8 1 (0.90%) VB
8 1 (0.90%) VBScript
Qualifications
1 24 (21.62%) Security Cleared
2 21 (18.92%) SC Cleared
3 11 (9.91%) Microsoft Certification
4 7 (6.31%) Degree
5 2 (1.80%) Cisco Certification
5 2 (1.80%) CISM
5 2 (1.80%) CISSP
5 2 (1.80%) Computer Science Degree
5 2 (1.80%) DV Cleared
5 2 (1.80%) ISTQB
6 1 (0.90%) Azure Certification
6 1 (0.90%) CCDE
6 1 (0.90%) CCIE
6 1 (0.90%) CCNP
6 1 (0.90%) CISA
6 1 (0.90%) GIAC
6 1 (0.90%) NCDA
6 1 (0.90%) PMI Certification
6 1 (0.90%) PMP
6 1 (0.90%) VCDX
Quality Assurance & Compliance
1 7 (6.31%) QA
2 4 (3.60%) Data Quality
2 4 (3.60%) GDPR
3 3 (2.70%) Accessibility
3 3 (2.70%) ISO/IEC 27001
4 2 (1.80%) PCI DSS
5 1 (0.90%) COBIT
5 1 (0.90%) COSO
5 1 (0.90%) Cyber Essentials
5 1 (0.90%) Cyber Essentials PLUS
5 1 (0.90%) Disclosure Scotland
5 1 (0.90%) ITGC
5 1 (0.90%) NIST
5 1 (0.90%) Sarbanes-Oxley
5 1 (0.90%) Solvency II
System Software
1 11 (9.91%) Active Directory
2 4 (3.60%) Microsoft App-V
3 3 (2.70%) VMware Infrastructure
4 2 (1.80%) Virtual Machines
4 2 (1.80%) VMware NSX
5 1 (0.90%) BitLocker
5 1 (0.90%) Docker
5 1 (0.90%) KVM
5 1 (0.90%) Virtual Desktop
5 1 (0.90%) vSphere
Systems Management
1 7 (6.31%) Ansible
2 4 (3.60%) Microsoft Intune
2 4 (3.60%) Terraform
3 3 (2.70%) SCCM
4 2 (1.80%) HP ALM
4 2 (1.80%) ThinApp
5 1 (0.90%) Data Guard
5 1 (0.90%) Grafana
5 1 (0.90%) HAProxy
5 1 (0.90%) Kubernetes
5 1 (0.90%) Nagios
5 1 (0.90%) Oracle Enterprise Manager
5 1 (0.90%) Progress Chef
5 1 (0.90%) Red Hat Satellite
5 1 (0.90%) vRealize
5 1 (0.90%) VxRail
5 1 (0.90%) WSUS
Vendors
1 30 (27.03%) Microsoft
2 14 (12.61%) Oracle
3 11 (9.91%) SAP
4 8 (7.21%) Splunk
5 5 (4.50%) Cisco
5 5 (4.50%) ServiceNow
5 5 (4.50%) VMware
6 4 (3.60%) Broadcom
7 3 (2.70%) CyberArk
7 3 (2.70%) HP
7 3 (2.70%) Proofpoint
7 3 (2.70%) Salesforce
8 2 (1.80%) Ariba
8 2 (1.80%) Dell
8 2 (1.80%) Google
8 2 (1.80%) Ivanti
8 2 (1.80%) MuleSoft
8 2 (1.80%) NetApp
8 2 (1.80%) Palo Alto
8 2 (1.80%) Red Hat