Documentation Skills Jobs with Work from Home Options

Documentation Skills
UK > Work from Home

The table below looks at the prevalence of the term Documentation Skills in remote or hybrid work. Included is a benchmarking guide to the salaries offered in vacancies that cited Documentation Skills over the 6 months leading up to 26 July 2024, comparing them to the same period in the previous two years.

6 months to
26 Jul 2024
Same period 2023 Same period 2022
Rank 392 432 476
Rank change year-on-year +40 +44 -64
Permanent jobs citing Documentation Skills 144 149 525
As % of all permanent jobs with a WFH option 0.52% 0.45% 0.67%
As % of the General category 0.85% 0.70% 1.01%
Number of salaries quoted 109 134 388
10th Percentile £35,050 £30,500 £38,443
25th Percentile £47,500 £41,250 £48,188
Median annual salary (50th Percentile) £55,000 £55,000 £62,500
Median % change year-on-year - -12.00% +16.28%
75th Percentile £78,750 £67,500 £75,000
90th Percentile £88,500 £97,500 £90,000
UK median annual salary £50,000 £56,000 £60,000
% change year-on-year -10.71% -6.67% +9.09%

All General Skills
Work from Home

Documentation Skills falls under the General Skills category. For comparison with the information above, the following table provides summary statistics for all permanent job vacancies with remote or hybrid options requiring common skills.

Permanent vacancies with a requirement for common skills 17,022 21,367 51,870
As % of all permanent jobs with a WFH option 60.93% 65.11% 66.05%
Number of salaries quoted 11,520 15,606 26,987
10th Percentile £32,500 £36,250 £35,000
25th Percentile £42,500 £46,570 £45,000
Median annual salary (50th Percentile) £57,500 £62,500 £60,000
Median % change year-on-year -8.00% +4.17% +7.14%
75th Percentile £77,500 £82,500 £80,000
90th Percentile £100,000 £102,500 £96,250
UK median annual salary £54,000 £60,000 £60,000
% change year-on-year -10.00% - +6.19%

Documentation Skills
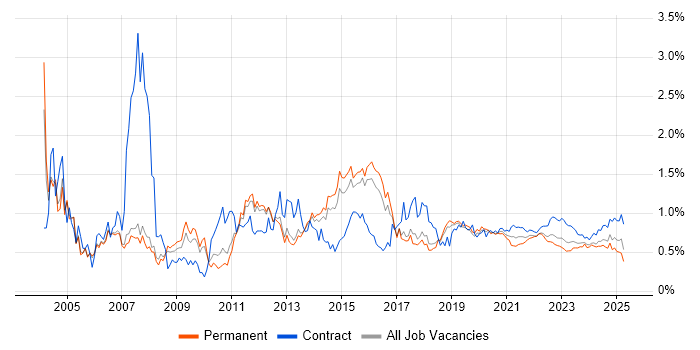
Trend for Jobs with a WFH Option

Job vacancies with a work from home option citing Documentation Skills as a proportion of all IT jobs advertised.

Documentation Skills trend for jobs with a WFH option

Documentation Skills
Salary Trend for Jobs with a WFH Option

3-month moving average salary quoted in job vacancies with a work from home option citing Documentation Skills.

Documentation Skills salary trend for jobs with a WFH option

Documentation Skills
Salary Histogram for Jobs with a WFH Option

Salary distribution for jobs with a work from home option citing Documentation Skills over the 6 months to 26 July 2024.

Documentation Skills salary histogram for jobs with a WFH option

Documentation Skills
Co-occurring Skills and Capabilities with WFH Options by Category

The follow tables expand on the table above by listing co-occurrences grouped by category. The same employment type, locality and period is covered with up to 20 co-occurrences shown in each of the following categories:

Application Platforms
1 16 (11.11%) Microsoft Exchange
2 12 (8.33%) SharePoint
3 7 (4.86%) Confluence
4 6 (4.17%) IIS
5 3 (2.08%) WebLogic
6 1 (0.69%) Skype for Business
Applications
1 9 (6.25%) Microsoft Office
2 5 (3.47%) Microsoft Excel
3 4 (2.78%) MS Visio
4 1 (0.69%) CATIA
4 1 (0.69%) Microsoft PowerPoint
4 1 (0.69%) NASTRAN
Business Applications
1 4 (2.78%) MIS ActiveH
1 4 (2.78%) Oracle EBS
1 4 (2.78%) Oracle ERP
2 2 (1.39%) SAP Business ByDesign
3 1 (0.69%) Dynamics AX
3 1 (0.69%) Dynamics CRM
3 1 (0.69%) Magento
3 1 (0.69%) SAP Hybris
3 1 (0.69%) SAP S/4HANA
3 1 (0.69%) Shopify
3 1 (0.69%) Teamcenter
Cloud Services
1 52 (36.11%) Azure
2 43 (29.86%) Microsoft 365
3 18 (12.50%) AWS
4 16 (11.11%) SaaS
5 14 (9.72%) GCP
5 14 (9.72%) Power Platform
6 11 (7.64%) Entra ID
6 11 (7.64%) PaaS
7 6 (4.17%) OneDrive
8 5 (3.47%) Azure DevOps
8 5 (3.47%) PowerApps
9 4 (2.78%) IaaS
10 3 (2.08%) Azure AKS
10 3 (2.08%) Azure Monitor
10 3 (2.08%) Azure Storage
10 3 (2.08%) Azure Synapse Analytics
10 3 (2.08%) Fivetran
11 2 (1.39%) Amazon SQS
11 2 (1.39%) Cloud Computing
11 2 (1.39%) Power Automate
Communications & Networking
1 17 (11.81%) Firewall
1 17 (11.81%) WAN
2 14 (9.72%) LAN
3 12 (8.33%) SAN
4 10 (6.94%) Network Security
4 10 (6.94%) Wireless
5 9 (6.25%) Wi-Fi
6 8 (5.56%) Internet
6 8 (5.56%) TCP/IP
7 6 (4.17%) DNS
7 6 (4.17%) VLAN
7 6 (4.17%) VPN
8 5 (3.47%) DHCP
8 5 (3.47%) SD-WAN
8 5 (3.47%) WLAN
9 4 (2.78%) FTP
9 4 (2.78%) HTTP
9 4 (2.78%) iSCSI
9 4 (2.78%) Remote Desktop
9 4 (2.78%) SSL
Database & Business Intelligence
1 13 (9.03%) Power BI
2 4 (2.78%) SQL Server
3 3 (2.08%) Azure SQL Database
3 3 (2.08%) Oracle Database
3 3 (2.08%) Oracle Database 12c
4 2 (1.39%) Data Lake
4 2 (1.39%) Data Warehouse
4 2 (1.39%) MySQL
4 2 (1.39%) NoSQL
4 2 (1.39%) SQL Server Integration Services
4 2 (1.39%) SQL Server Reporting Services
5 1 (0.69%) Event Store
5 1 (0.69%) MariaDB
5 1 (0.69%) Redis
5 1 (0.69%) Relational Database
Development Applications
1 13 (9.03%) JIRA
2 4 (2.78%) Burp Suite
2 4 (2.78%) Git
2 4 (2.78%) Metasploit
3 2 (1.39%) Jenkins
3 2 (1.39%) JUnit
3 2 (1.39%) Selenium
3 2 (1.39%) TestNG
4 1 (0.69%) Cypress.io
4 1 (0.69%) SpecFlow
4 1 (0.69%) Visual Studio
General
1 87 (60.42%) Social Skills
2 36 (25.00%) Finance
3 28 (19.44%) Analytical Skills
4 17 (11.81%) Law
5 14 (9.72%) Legal
6 10 (6.94%) Marketing
7 6 (4.17%) Inclusion and Diversity
7 6 (4.17%) Telecoms
8 5 (3.47%) Japanese Language
8 5 (3.47%) Organisational Skills
8 5 (3.47%) Publishing
9 4 (2.78%) Financial Institution
9 4 (2.78%) Front Office
9 4 (2.78%) Retail
10 3 (2.08%) Presentation Skills
11 2 (1.39%) Advertising
11 2 (1.39%) Automotive
11 2 (1.39%) Games
11 2 (1.39%) Manufacturing
11 2 (1.39%) Public Sector
Job Titles
1 34 (23.61%) Senior
2 16 (11.11%) Analyst
3 14 (9.72%) Lead
4 13 (9.03%) Infrastructure Engineer
5 12 (8.33%) Architect
5 12 (8.33%) Consultant
5 12 (8.33%) Support Engineer
6 8 (5.56%) Business Analyst
6 8 (5.56%) Infrastructure Manager
6 8 (5.56%) IT Analyst
6 8 (5.56%) Security Engineer
7 7 (4.86%) Project Manager
7 7 (4.86%) Senior Security Engineer
7 7 (4.86%) Service Desk Team Leader
7 7 (4.86%) Systems Engineer
7 7 (4.86%) Team Leader
8 6 (4.17%) Senior Manager
8 6 (4.17%) Senior Project Manager
8 6 (4.17%) Senior Technical Engineer
8 6 (4.17%) Technical Engineer
Libraries, Frameworks & Software Standards
1 8 (5.56%) Middleware
2 7 (4.86%) Oracle Fusion
3 4 (2.78%) .NET
3 4 (2.78%) FIX Protocol
3 4 (2.78%) HTML
3 4 (2.78%) React
4 3 (2.08%) ADO
4 3 (2.08%) CSS
5 2 (1.39%) React Native
5 2 (1.39%) XBRL
5 2 (1.39%) XML
6 1 (0.69%) .NET Core
6 1 (0.69%) Blazor
6 1 (0.69%) JSON
6 1 (0.69%) NestJS
6 1 (0.69%) Next.js
6 1 (0.69%) Node.js
6 1 (0.69%) RabbitMQ
6 1 (0.69%) REST
6 1 (0.69%) Web Services
Miscellaneous
1 17 (11.81%) Management Information System
2 7 (4.86%) CMDB
2 7 (4.86%) Mobile App
2 7 (4.86%) Self-Motivation
3 5 (3.47%) Virtual Team
4 4 (2.78%) Clustering
4 4 (2.78%) Equities
4 4 (2.78%) Foreign Exchange (FX)
4 4 (2.78%) IoT
4 4 (2.78%) PKI
4 4 (2.78%) Product Ownership
4 4 (2.78%) Security Posture
5 3 (2.08%) Driving Licence
6 2 (1.39%) Client/Server
6 2 (1.39%) Cyber Defence
6 2 (1.39%) Cyberattack
6 2 (1.39%) Data Centre
6 2 (1.39%) Online Games
6 2 (1.39%) PMI
7 1 (0.69%) Team-Oriented Environment
Operating Systems
1 35 (24.31%) Windows
2 29 (20.14%) Windows Server
3 4 (2.78%) Kali Linux
3 4 (2.78%) Linux
3 4 (2.78%) Windows Server 2012
4 3 (2.08%) Windows 7
4 3 (2.08%) Windows Server 2016
4 3 (2.08%) Windows Server 2019
5 2 (1.39%) Ubuntu
5 2 (1.39%) Windows 10
6 1 (0.69%) CentOS
6 1 (0.69%) Unix
Processes & Methodologies
1 47 (32.64%) Problem-Solving
2 27 (18.75%) Customer Service
3 22 (15.28%) Continuous Improvement
4 19 (13.19%) Agile
5 17 (11.81%) Cybersecurity
6 16 (11.11%) Infrastructure Engineering
7 15 (10.42%) Information Security
7 15 (10.42%) Project Management
8 13 (9.03%) Computer Science
9 12 (8.33%) Project Delivery
10 11 (7.64%) Cloud Security
10 11 (7.64%) Commercial Awareness
10 11 (7.64%) Data Loss Prevention
10 11 (7.64%) Roadmaps
11 10 (6.94%) Data Privacy
11 10 (6.94%) Disaster Recovery
11 10 (6.94%) ITIL
11 10 (6.94%) Mentoring
11 10 (6.94%) Time Management
12 9 (6.25%) Business Intelligence
Programming Languages
1 19 (13.19%) PowerShell
2 15 (10.42%) SQL
3 10 (6.94%) C#
3 10 (6.94%) JavaScript
4 5 (3.47%) Java
5 4 (2.78%) ActionScript
5 4 (2.78%) Python
5 4 (2.78%) T-SQL
5 4 (2.78%) VB
6 3 (2.08%) Bash
6 3 (2.08%) PL/SQL
7 1 (0.69%) PHP
7 1 (0.69%) SPARQL
7 1 (0.69%) VB.NET
Qualifications
1 20 (13.89%) Degree
2 11 (7.64%) CISSP
3 10 (6.94%) Security Cleared
4 7 (4.86%) CEH
5 5 (3.47%) Computer Science Degree
6 4 (2.78%) CREST Certified
6 4 (2.78%) GIAC
6 4 (2.78%) GSEC
6 4 (2.78%) OSCE
6 4 (2.78%) OSCP
6 4 (2.78%) SSCP
7 3 (2.08%) Azure Certification
7 3 (2.08%) Microsoft Certification
8 2 (1.39%) AWS Certification
8 2 (1.39%) CCNP
8 2 (1.39%) Cisco Certification
8 2 (1.39%) PMI Certification
8 2 (1.39%) PRINCE2 Certification
9 1 (0.69%) DV Cleared
9 1 (0.69%) SC Cleared
Quality Assurance & Compliance
1 9 (6.25%) SLA
2 7 (4.86%) ISO/IEC 27002 (supersedes ISO/IEC 17799)
3 5 (3.47%) GDPR
3 5 (3.47%) ISO/IEC 27001
4 3 (2.08%) Accessibility
5 2 (1.39%) Data Quality
5 2 (1.39%) GRC
5 2 (1.39%) ISO 20022
5 2 (1.39%) QA
6 1 (0.69%) Cyber Essentials
6 1 (0.69%) Cyber Essentials PLUS
System Software
1 25 (17.36%) Active Directory
2 11 (7.64%) VMware Infrastructure
2 11 (7.64%) vSphere
3 10 (6.94%) Hyper-V
4 7 (4.86%) Virtual Machines
5 6 (4.17%) Docker
6 4 (2.78%) NFS
6 4 (2.78%) OpenSSH
6 4 (2.78%) VMware ESXi
6 4 (2.78%) XenApp
7 3 (2.08%) Virtual Desktop
8 1 (0.69%) Virtual Servers
Systems Management
1 7 (4.86%) Microsoft Intune
2 4 (2.78%) Active Directory Federation Services
2 4 (2.78%) IBM BigFix
2 4 (2.78%) Kubernetes
2 4 (2.78%) Nessus
2 4 (2.78%) Nmap
2 4 (2.78%) PowerCLI
2 4 (2.78%) SCCM
2 4 (2.78%) Terraform
2 4 (2.78%) vCenter Server
3 3 (2.08%) AirWatch
3 3 (2.08%) Enterprise Manager Cloud Control
3 3 (2.08%) Oracle Enterprise Manager
3 3 (2.08%) Oracle RMAN
4 2 (1.39%) EMC NetWorker
5 1 (0.69%) Ansible
5 1 (0.69%) Galera Cluster
5 1 (0.69%) HAProxy
5 1 (0.69%) WSUS
Vendors
1 72 (50.00%) Microsoft
2 20 (13.89%) VMware
3 12 (8.33%) Cisco
4 7 (4.86%) CyberArk
4 7 (4.86%) HP
4 7 (4.86%) Oracle
5 6 (4.17%) ServiceNow
6 5 (3.47%) Citrix
7 4 (2.78%) Google
7 4 (2.78%) IBM
7 4 (2.78%) Qualys
7 4 (2.78%) SAP
7 4 (2.78%) Ubiquiti
8 3 (2.08%) Commvault
8 3 (2.08%) ConnectWise
8 3 (2.08%) Databricks
8 3 (2.08%) Datto
8 3 (2.08%) Draytek
8 3 (2.08%) ESET
8 3 (2.08%) Palo Alto