JIRA Contracts with Hybrid/Remote/WFH Options

Atlassian JIRA
UK > Work from Home

The table below provides summary statistics for remote or hybrid contract work requiring JIRA skills. It includes a benchmarking guide to the contractor rates offered in vacancies that cited JIRA over the 6 months leading up to 12 May 2025, comparing them to the same period in the previous two years.

6 months to
12 May 2025
Same period 2024 Same period 2023
Rank 37 41 46
Rank change year-on-year +4 +5 -15
Contract jobs citing JIRA 533 649 1,201
As % of all contract jobs with a WFH option 5.41% 4.31% 4.80%
As % of the Development Applications category 35.96% 36.12% 31.65%
Number of daily rates quoted 385 428 816
10th Percentile £313 £325 £325
25th Percentile £400 £425 £413
Median daily rate (50th Percentile) £480 £500 £522
Median % change year-on-year -4.00% -4.12% +4.30%
75th Percentile £575 £600 £600
90th Percentile £688 £675 £725
UK median daily rate £500 £525 £525
% change year-on-year -4.76% - +0.68%
Number of hourly rates quoted 8 16 35
10th Percentile £25.17 £10.50 £36.20
25th Percentile £46.25 £36.25 £48.78
Median hourly rate £58.88 £40.00 £66.69
Median % change year-on-year +47.19% -40.02% +49.87%
75th Percentile £67.50 £65.00 £75.00
90th Percentile £80.70 - £84.99
UK median hourly rate £57.50 £50.44 £66.69
% change year-on-year +14.00% -24.36% +48.19%

All Development Application Skills
Work from Home

JIRA falls under the Development Applications category. For comparison with the information above, the following table provides summary statistics for all contract job vacancies with remote or hybrid options requiring development application skills.

Contract vacancies with a requirement for development application skills 1,482 1,797 3,795
As % of all contract jobs with a WFH option 15.03% 11.94% 15.16%
Number of daily rates quoted 1,070 1,287 2,719
10th Percentile £340 £360 £394
25th Percentile £413 £425 £450
Median daily rate (50th Percentile) £500 £511 £545
Median % change year-on-year -2.15% -6.24% +3.81%
75th Percentile £600 £600 £650
90th Percentile £746 £700 £750
UK median daily rate £500 £525 £550
% change year-on-year -4.76% -4.55% -
Number of hourly rates quoted 17 41 109
10th Percentile £26.60 £26.24 £39.60
25th Percentile £55.25 £46.75 £52.50
Median hourly rate £62.50 £65.00 £65.00
Median % change year-on-year -3.85% - +20.93%
75th Percentile £78.75 £90.00 £70.00
90th Percentile £91.00 - £82.96
UK median hourly rate £60.00 £65.00 £61.50
% change year-on-year -7.69% +5.69% +16.85%

JIRA
Trend for Jobs with a WFH Option

Job vacancies with remote working options citing JIRA as a proportion of all IT jobs advertised.
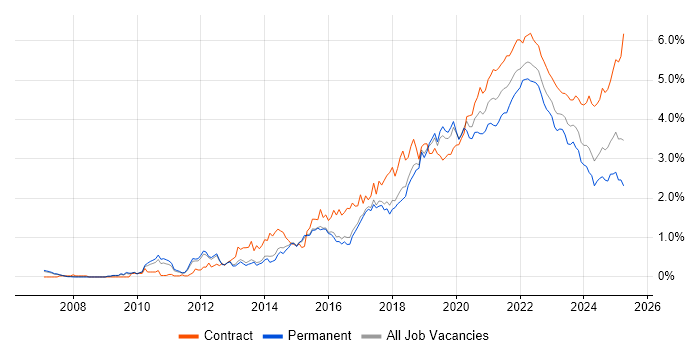
JIRA trend for jobs with Hybrid/Remote/WFH options

JIRA
Daily Rate Trend for Jobs with a WFH Option

3-month moving average daily rate quoted in job vacancies with remote working options citing JIRA.

JIRA daily rate for jobs with a WFH option

JIRA
Daily Rate Histogram for Jobs with a WFH Option

Daily rate distribution for jobs with remote working options citing JIRA over the 6 months to 12 May 2025.

JIRA daily rate histogram for jobs with a WFH option

JIRA
Hourly Rate Trend for Jobs with a WFH Option

3-month moving average hourly rate quoted in job vacancies with remote working options citing JIRA.

JIRA hourly rate for jobs with a WFH option

JIRA
Hourly Rate Histogram for Jobs with a WFH Option

Hourly rate distribution for jobs with remote working options citing JIRA over the 6 months to 12 May 2025.

JIRA hourly rate histogram for jobs with a WFH option

JIRA
Co-occurring Skills and Capabilities with WFH Options by Category

The follow tables expand on the table above by listing co-occurrences grouped by category. The same employment type, locality and period is covered with up to 20 co-occurrences shown in each of the following categories:

Application Platforms
1 220 (41.28%) Confluence
2 35 (6.57%) SharePoint
3 11 (2.06%) CMS
4 6 (1.13%) JBoss
5 5 (0.94%) Apache
5 5 (0.94%) Apache Spark
5 5 (0.94%) Drupal
6 4 (0.75%) IIS
6 4 (0.75%) Tomcat
6 4 (0.75%) WordPress
7 3 (0.56%) Camunda
7 3 (0.56%) Headless CMS
7 3 (0.56%) Microsoft Exchange
7 3 (0.56%) Oracle Coherence
7 3 (0.56%) SAS
8 2 (0.38%) Anypoint
8 2 (0.38%) Mendix
8 2 (0.38%) WebSphere
9 1 (0.19%) Jupyter
9 1 (0.19%) Sitecore CMS
Applications
1 48 (9.01%) Microsoft Office
2 27 (5.07%) Microsoft Project
2 27 (5.07%) MS Visio
2 27 (5.07%) Trello
3 25 (4.69%) Microsoft Excel
4 10 (1.88%) Microsoft PowerPoint
5 1 (0.19%) Acrobat
5 1 (0.19%) Adobe XD
5 1 (0.19%) CATIA
5 1 (0.19%) InVision
5 1 (0.19%) Notion
5 1 (0.19%) Sketch
5 1 (0.19%) UserZoom
Business Applications
1 7 (1.31%) Dynamics CRM
2 6 (1.13%) SAP S/4HANA
3 2 (0.38%) Aladdin
3 2 (0.38%) Payment Gateway
3 2 (0.38%) SAP CX
3 2 (0.38%) SAP Hybris
3 2 (0.38%) SimCorp Dimension
3 2 (0.38%) Teamcenter
4 1 (0.19%) Actimize
4 1 (0.19%) Adobe Campaign
4 1 (0.19%) Fidessa
4 1 (0.19%) MultiFonds
4 1 (0.19%) Salesforce CRM
4 1 (0.19%) SAP ERP
4 1 (0.19%) SAP IBP
4 1 (0.19%) SAP MDG
4 1 (0.19%) SessionCam
4 1 (0.19%) Shopify
4 1 (0.19%) Sparx Enterprise Architect
4 1 (0.19%) Summit
Cloud Services
1 111 (20.83%) Azure
2 86 (16.14%) AWS
3 52 (9.76%) Azure DevOps
4 50 (9.38%) Power Platform
5 30 (5.63%) GitHub
6 27 (5.07%) PowerApps
7 25 (4.69%) Dynamics 365
8 22 (4.13%) Power Automate
9 18 (3.38%) Microsoft 365
10 16 (3.00%) Azure Logic Apps
10 16 (3.00%) GCP
11 15 (2.81%) SaaS
12 13 (2.44%) Asana
12 13 (2.44%) Slack
13 11 (2.06%) Miro
13 11 (2.06%) npm
14 9 (1.69%) Amazon CloudWatch
14 9 (1.69%) IaaS
15 8 (1.50%) Amazon S3
15 8 (1.50%) Serverless
Communications & Networking
1 18 (3.38%) HTTP
2 8 (1.50%) VPN
3 7 (1.31%) TCP/IP
4 6 (1.13%) DNS
4 6 (1.13%) Internet
5 5 (0.94%) DHCP
5 5 (0.94%) SNMP
6 4 (0.75%) Remote Desktop
6 4 (0.75%) SMTP
7 3 (0.56%) Firewall
7 3 (0.56%) Software-Defined Radio
7 3 (0.56%) SSL
7 3 (0.56%) VLAN
8 2 (0.38%) BGP
8 2 (0.38%) Cisco ISE
8 2 (0.38%) Kerberos
8 2 (0.38%) OSPF
8 2 (0.38%) POP3
8 2 (0.38%) SNA
8 2 (0.38%) SSH
Database & Business Intelligence
1 39 (7.32%) Power BI
2 33 (6.19%) Relational Database
3 24 (4.50%) PostgreSQL
4 21 (3.94%) MySQL
5 20 (3.75%) MongoDB
6 19 (3.56%) SQL Server
7 17 (3.19%) Data Warehouse
8 10 (1.88%) Big Data
8 10 (1.88%) NoSQL
9 9 (1.69%) Apache Cassandra
10 8 (1.50%) Oracle Database
11 7 (1.31%) Elasticsearch
12 6 (1.13%) Amazon RDS
12 6 (1.13%) Data Lake
13 5 (0.94%) SQL Server Reporting Services
14 4 (0.75%) Redis
14 4 (0.75%) SQL Server Integration Services
14 4 (0.75%) Tableau
15 3 (0.56%) DynamoDB
15 3 (0.56%) Neo4j
Development Applications
1 92 (17.26%) Git
2 50 (9.38%) Jenkins
3 37 (6.94%) GitLab
4 26 (4.88%) Selenium
5 24 (4.50%) Bitbucket
6 23 (4.32%) Visual Studio
7 20 (3.75%) Cucumber
8 19 (3.56%) Cypress.io
9 18 (3.38%) REST Assured
10 17 (3.19%) JUnit
10 17 (3.19%) Postman
10 17 (3.19%) SonarQube
11 15 (2.81%) Subversion
12 10 (1.88%) TeamCity
13 9 (1.69%) JMeter
13 9 (1.69%) webpack
14 8 (1.50%) Maven
15 7 (1.31%) Bitbucket Server
15 7 (1.31%) ScriptRunner
16 6 (1.13%) CA Release Automation
General
1 221 (41.46%) Social Skills
2 114 (21.39%) Finance
3 97 (18.20%) Analytical Skills
4 66 (12.38%) Public Sector
5 45 (8.44%) Banking
6 19 (3.56%) Front Office
7 17 (3.19%) Manufacturing
8 16 (3.00%) Marketing
9 11 (2.06%) Law
10 10 (1.88%) Documentation Skills
10 10 (1.88%) Inclusion and Diversity
10 10 (1.88%) Legal
10 10 (1.88%) Organisational Skills
11 9 (1.69%) Presentation Skills
12 8 (1.50%) Investment Banking
13 7 (1.31%) Automotive
14 6 (1.13%) Back Office
14 6 (1.13%) Military
14 6 (1.13%) Retail
14 6 (1.13%) Telecoms
Job Titles
1 107 (20.08%) Developer
2 85 (15.95%) Analyst
3 57 (10.69%) Business Analyst
4 46 (8.63%) Project Manager
5 41 (7.69%) Senior
6 34 (6.38%) Lead
7 24 (4.50%) Tester
8 21 (3.94%) C# Developer
8 21 (3.94%) Software Engineer
9 18 (3.38%) Scrum Master
10 16 (3.00%) Java Developer
11 15 (2.81%) .NET Developer
11 15 (2.81%) C# Developer - Electronic Trading
11 15 (2.81%) Electronic Trading Developer
11 15 (2.81%) Real Time Developer
12 14 (2.63%) Data Analyst
12 14 (2.63%) Delphi Developer
13 13 (2.44%) C# .NET Developer
13 13 (2.44%) Consultant
13 13 (2.44%) Delivery Manager
Libraries, Frameworks & Software Standards
1 61 (11.44%) REST
2 45 (8.44%) AngularJS
3 32 (6.00%) .NET
3 32 (6.00%) SOAP
4 29 (5.44%) CSS
4 29 (5.44%) HTML
5 22 (4.13%) Spring Boot
5 22 (4.13%) Web Services
6 19 (3.56%) Kafka
6 19 (3.56%) RESTful
7 17 (3.19%) React
8 16 (3.00%) Spring
9 15 (2.81%) Reactive Extensions
9 15 (2.81%) Swagger
10 12 (2.25%) OpenAPI
11 11 (2.06%) Node.js
11 11 (2.06%) Playwright
12 10 (1.88%) Flash
12 10 (1.88%) Java EE
13 8 (1.50%) Ajax
Miscellaneous
1 54 (10.13%) Product Ownership
2 21 (3.94%) Onboarding
3 16 (3.00%) Enterprise Software
4 13 (2.44%) Legacy Systems
5 11 (2.06%) Clustering
5 11 (2.06%) Virtual Team
6 9 (1.69%) SCADA
7 8 (1.50%) Data Protection Act
7 8 (1.50%) Data Structures
8 7 (1.31%) Cloud Native
9 6 (1.13%) Analytical Mindset
9 6 (1.13%) Distributed Denial-of-Service
9 6 (1.13%) Distributed Systems
9 6 (1.13%) Mainframe
9 6 (1.13%) Management Information System
10 5 (0.94%) Data Centre
10 5 (0.94%) Derivative
10 5 (0.94%) PMI
10 5 (0.94%) Public Cloud
11 4 (0.75%) Mobile App
Operating Systems
1 49 (9.19%) Windows
2 43 (8.07%) Linux
3 15 (2.81%) Unix
4 13 (2.44%) Red Hat Enterprise Linux
5 10 (1.88%) Windows Server
6 3 (0.56%) Apple iOS
6 3 (0.56%) Mac OS
7 2 (0.38%) Android
7 2 (0.38%) Windows Server 2012
7 2 (0.38%) Windows Server 2016
7 2 (0.38%) Windows Server 2019
7 2 (0.38%) zOS
8 1 (0.19%) Embedded Linux
8 1 (0.19%) Oracle Linux
8 1 (0.19%) Solaris
8 1 (0.19%) Windows 10
8 1 (0.19%) Windows Server 2003
Processes & Methodologies
1 308 (57.79%) Agile
2 122 (22.89%) DevOps
3 104 (19.51%) Scrum
4 103 (19.32%) Problem-Solving
5 95 (17.82%) Stakeholder Management
6 88 (16.51%) Project Management
7 82 (15.38%) CI/CD
8 65 (12.20%) Test Automation
9 61 (11.44%) Continuous Improvement
10 51 (9.57%) User Stories
11 48 (9.01%) Microservices
11 48 (9.01%) Sprint Planning
12 45 (8.44%) Kanban
13 40 (7.50%) Acceptance Criteria
13 40 (7.50%) Software Engineering
13 40 (7.50%) Sprint Retrospective
13 40 (7.50%) Waterfall
14 39 (7.32%) Business Intelligence
14 39 (7.32%) Service Management
15 38 (7.13%) Continuous Integration
Programming Languages
1 124 (23.26%) SQL
2 90 (16.89%) Java
3 72 (13.51%) C#
4 63 (11.82%) JavaScript
4 63 (11.82%) Python
5 36 (6.75%) TypeScript
6 26 (4.88%) PL/SQL
7 22 (4.13%) Bash
8 18 (3.38%) PowerShell
9 14 (2.63%) Delphi
10 12 (2.25%) Shell Script
11 9 (1.69%) Groovy
12 8 (1.50%) C++
13 6 (1.13%) C
14 4 (0.75%) Perl
14 4 (0.75%) PHP
14 4 (0.75%) ProC
14 4 (0.75%) Ruby
14 4 (0.75%) VBScript
15 3 (0.56%) JCL
Qualifications
1 115 (21.58%) Security Cleared
2 108 (20.26%) SC Cleared
3 58 (10.88%) Degree
4 19 (3.56%) PMI Certification
5 16 (3.00%) PMP
6 13 (2.44%) Master's Degree
7 12 (2.25%) ISTQB
8 11 (2.06%) CCNA
8 11 (2.06%) Cisco Certification
8 11 (2.06%) VMware Certified Professional (VCP)
9 9 (1.69%) Computer Science Degree
10 6 (1.13%) AWS Certification
11 4 (0.75%) CSPO
11 4 (0.75%) ISEB
11 4 (0.75%) ISTQB Foundation Certification
12 3 (0.56%) AWS Certified Solutions Architect
12 3 (0.56%) Azure Certification
12 3 (0.56%) BPSS Clearance
12 3 (0.56%) Microsoft Certification
12 3 (0.56%) Oracle Certification
Quality Assurance & Compliance
1 50 (9.38%) QA
2 27 (5.07%) Accessibility
3 14 (2.63%) Data Quality
4 12 (2.25%) PMO
5 7 (1.31%) GDPR
6 5 (0.94%) MiFID
7 4 (0.75%) EMIR
7 4 (0.75%) ISO/IEC 27001
8 3 (0.56%) GxP
8 3 (0.56%) SLA
9 2 (0.38%) Actionable Recommendations
9 2 (0.38%) HIPAA
9 2 (0.38%) ISO 9001
9 2 (0.38%) NCSC
9 2 (0.38%) PCI DSS
9 2 (0.38%) Sarbanes-Oxley
9 2 (0.38%) SEPA
9 2 (0.38%) SOC 2
9 2 (0.38%) WCAG
10 1 (0.19%) AUTOSAR
System Software
1 48 (9.01%) Docker
2 23 (4.32%) Active Directory
3 17 (3.19%) VMware Infrastructure
4 12 (2.25%) VMware ESXi
5 10 (1.88%) VMware NSX
6 3 (0.56%) Virtual Machines
6 3 (0.56%) vSphere
7 2 (0.38%) Hyper-V
7 2 (0.38%) Virtual Desktop
8 1 (0.19%) Firmware
8 1 (0.19%) Tivoli Workload Scheduler
Systems Management
1 56 (10.51%) Kubernetes
2 31 (5.82%) Terraform
3 20 (3.75%) Ansible
4 11 (2.06%) vCenter Server
5 10 (1.88%) HP ALM
6 8 (1.50%) Progress Chef
7 7 (1.31%) Single Sign-On
8 6 (1.13%) Opsgenie
9 5 (0.94%) Docker Swarm
9 5 (0.94%) Podman
10 4 (0.75%) Kibana
10 4 (0.75%) Microsoft Intune
10 4 (0.75%) Prometheus
10 4 (0.75%) SCCM
11 3 (0.56%) Grafana
11 3 (0.56%) Packer
11 3 (0.56%) Puppet
11 3 (0.56%) Tivoli
12 2 (0.38%) logstash
12 2 (0.38%) QRadar
Vendors
1 88 (16.51%) Microsoft
2 63 (11.82%) Oracle
3 51 (9.57%) Atlassian
4 27 (5.07%) ServiceNow
5 20 (3.75%) VMware
6 17 (3.19%) Cisco
7 15 (2.81%) Salesforce
7 15 (2.81%) SAP
8 13 (2.44%) Google
9 11 (2.06%) Databricks
9 11 (2.06%) IBM
10 10 (1.88%) HP
11 8 (1.50%) Splunk
12 7 (1.31%) CA Agile Central
12 7 (1.31%) Citrix
12 7 (1.31%) Palo Alto
12 7 (1.31%) Planview
12 7 (1.31%) Red Hat
13 6 (1.13%) Dynatrace
13 6 (1.13%) MuleSoft